
#FutureFresenius: Advancing patient care – Strategic course set to unlock full potential – Fresenius enters new era with simplified Group structure and therapy focus across 3 platforms – 2022 performance in line with expectations – 2023 outlook tough but realistic
- Fresenius has hit RESET and is now moving towards #FutureFresenius with a simplified structure, sharper focus and acceleration of performance
- Intention to deconsolidate Fresenius Medical Care by changing the legal form of FMC to a German Stock Corporation (“Aktiengesellschaft”) in simplified governance
- Focus on Operating Companies Fresenius Kabi and Fresenius Helios
- Active portfolio management for assets where Fresenius lacks best ownership
- New, more rigorous Fresenius Financial Framework with ambitious segment margin bands
- ~€1bn annual structural productivity improvement by 2025
- All initiatives pointed towards advancing patient care and becoming an industry-leading, therapy-focused healthcare company
If no timeframe is specified, information refers to Q4/2022.

1 Before special items, Q1/22 restated following remeasurement Humacyte investment
2 Net income attributable to shareholders of Fresenius SE & Co. KGaA
3 Excluding Ivenix and mAbxience acquisitions
For a detailed overview of special items please see the reconciliation tables on pages 22-25.
Fresenius is moving ahead on its pathway to #FutureFresenius. Through the planned deconsolidation of Fresenius Medical Care, the company will simplify its governance and group structure. The company will have a clear focus on therapy to advance patient care across the three platforms (Bio)Pharma, MedTech and Care Provision. Programs are in place to enhance profitability and for active portfolio management. Fresenius will increase the pace of annual structural productivity improvement to approximately 1 billion euros by 2025.
Intention to deconsolidate Fresenius Medical Care
The company plans to deconsolidate Fresenius Medical Care by changing Fresenius Medical Care’s legal form to a German Stock Corporation (“Aktiengesellschaft”). Subject to the necessary shareholder approvals and the registration with the commercial register, the conversion is expected to become effective by the end of the 2023 financial year at the latest. To this end, an Extraordinary General Meeting of Fresenius Medical Care is expected to be held in July to decide on the proposal to change the company into the legal form of an Aktiengesellschaft (“AG”). Following the planned change in its legal form, Fresenius Medical Care will no longer be part of the fully consolidated subsidiaries of Fresenius. Fresenius’ will continue to hold a 32 percent stake in the share capital of Fresenius Medical Care.
“After careful consideration and very constructive discussions with the Group’s key stakeholders, we are confident that the planned deconsolidation of Fresenius Medical Care is the best way forward to benefit both companies.” said Wolfgang Kirsch, Chairman of the Supervisory Board of Fresenius SE. “By converting Fresenius Medical Care to the legal form of an AG, both companies gain flexibility and can better advance their strategic priorities, positioning themselves in the best possible way for the future. Michael Sen and his management team, who have developed this new corporate structure, will lead Fresenius back to operational strength and sustainable growth. I am convinced that the new structure will enable Helen Giza as CEO to realize the full potential of Fresenius Medical Care, in which we continue to hold a significant stake.”
“This is an inflection point for Fresenius”, said Fresenius SE CEO Michael Sen. “I am pleased that our anchor shareholder, the Else Kröner-Fresenius Foundation, has expressed their support for our plans and I would like to thank them for their trust. The new structure will greatly benefit both companies: Fresenius Medical Care needs an operational turnaround, to improve its performance and focus on its core business. Fresenius needs to simplify its complex corporate structures and commit to its Operating Companies and to maximizing value from its investments.”
“Simplifying our governance structure is an important step towards more optionality for a successful future of Fresenius Medical Care”, said Helen Giza, CEO of Fresenius Medical Care. “The new legal form will give us the flexibility and autonomy to focus all our efforts to unlock value as the leading kidney care company.”
Focus on Operating Companies Fresenius Kabi and Fresenius Helios
The Operating Companies Fresenius Kabi and Fresenius Helios are at the center of the Group’s ambitions under #FutureFresenius. They are both geared for significant value creation and catering to system-critical areas of healthcare. Building on a resilient global generics business, Fresenius Kabi will expand along the growth vectors Nutrition, Biopharma and MedTech. Helios Germany and Quirónsalud are already the leading private hospital providers in Germany and Spain, caring for more than 24 million patients every year. Fresenius Helios intends to leverage its market position to actively shape industry trends across digitalization and integrated care.
For the Investment Companies Fresenius Medical Care and Fresenius Vamed, there will be a strong focus on active financial value management. Across the Group, refining the company’s operating model and advancing its ESG agenda and roadmap for the best of patients will be central elements of the further journey towards #FutureFresenius.
~€1bn annual structural productivity improvement by 2025
Structural productivity improvements are moving forward. The new target is to achieve annual structural cost savings of around €1 billion at EBIT level by 2025. In order to reach this goal, Fresenius is running targeted programs across all business segments and the Corporate Center, with the oversight and steering of the Group. Key elements include measures to optimize procurement, processes, sales and administrative costs, as well as divesting from non-core assets.
Thanks to its cost and efficiency program, the company has already realized €152 million in savings after taxes and non-controlling interests in fiscal year 2022, offset by €260 million in one-time costs. In line with previous practice, these expenses are classified as special items.
Fresenius Medical Care has increased the savings target for its FME25 transformation program from €500 million to €650 million by 2025 and now expects to invest up to €650 million in the same period1. By the end of 2022, Fresenius Medical Care delivered €131 million (on EBIT level) of sustainable savings under the FME25 program, exceeding the original target of €40 to 70 million for the same period.
1 Costs related to the FME25 program will be treated as a special item
New, more rigorous Fresenius Financial Framework
To enable and accelerate performance, the Management Board set up a new, more rigorous Fresenius Financial Framework. The framework sets ambitious EBIT margin bands for the segments. They serve as a benchmark when reviewing businesses, measuring performance and planning for the future.
At group level, Fresenius will measure its future performance based on return on invested capital (ROIC), a leverage target band and the cash conversion rate (CCR), among others.
New progressive dividend policy – Stable dividend proposed
With the new Fresenius Financial Framework, Fresenius aims to generate attractive and predictable dividend yields. In line with its new progressive dividend policy, the Company aims to increase the dividend in line with constant currency earnings per share1 growth but at least maintain the dividend at the prior-year’s level. Therefore, the Management Board of Fresenius will propose to the Supervisory Board a stable dividend at the prior year level of €0.92 per share for FY/22 (FY/21: €0.92).
1 Before Special items
FY/23 Group guidance
For 2023, Fresenius expects Group organic revenue1 to grow in a low- to mid-single-digit percentage range. Group constant currency EBIT2 is expected to remain broadly flat or decline up to a high-single-digit percentage rate.
Excluding Fresenius Medical Care constant currency EBIT3 is expected to remain broadly flat or decline up to a mid-single-digit percentage rate.
Fresenius expects the net debt/EBITDA4 ratio to be slightly above the 2022 level by the end of 2023 (December 31, 2022: 3.65x5), depending on divestment activities. The self-imposed target corridor for the leverage ratio remains unchanged at 3.0x to 3.5x.
1 FY/22 base: €40,840 million
2 FY/22 base: €3,727 million, before special items, excl. PRF; FY/23: before special items
3 FY/22 base: €2,187 million, before special items; FY/23: before special items
4 At LTM average exchange rates for both net debt and EBITDA; pro forma closed acquisitions/divestitures; excluding further potential acquisitions; before special items; including lease liabilities
5 At LTM average exchange rates for both net debt and EBITDA; pro forma closed acquisitions/divestitures; before special items; including lease liabilities
For a detailed overview of special items please see the reconciliation tables on pages 22-25.
Assumptions for guidance FY/23
For 2023, Fresenius assumes no further escalations of geopolitical tensions and challenges from COVID-19, and supply chain constraints continuing to ease.
Fresenius expects that the general cost inflation and labor shortages will have a more significant negative effect on its business than in 2022. This is due to the fact that H2/2022 showed stronger headwinds compared to H1/2022. Thus, Fresenius expects a marked annualization effect.
Fresenius will continue to closely monitor the potential further consequences of the overall heightened volatility and muted visibility, including balance sheet valuations.
For Fresenius Medical Care’s contribution to the Group’s financial figures, the assumptions for Fresenius Medical Care’s FY/23 guidance are also fully applicable to Fresenius Group’s FY/23 guidance. In 2022, Fresenius Medical Care’s EBIT was supported by €277 million of Provider Relief Funding from the U.S. government (at current currency). There is no additional governmental support assumed for 2023.
All of these assumptions are subject to considerable uncertainty.
4% revenue increase in constant currency
Group revenue increased by 7% (4% in constant currency) to €10,643 million (Q4/21: €9,966 million). Organic growth was 3%. Acquisitions/divestitures contributed net 1% to growth. Currency translation increased revenue growth by 3%. Excluding estimated COVID-19 effects1, Group revenue growth would have been 4% to 5% in constant currency (Q4/21: 5% to 6%).
In FY/22, Group revenue increased by 9% (4% in constant currency) to €40,840 million (FY/21: €37,520 million). Organic growth was 3%. Acquisitions/divestitures contributed net 1% to growth. Currency translation increased revenue growth by 5%. Excluding estimated COVID-19 effects1, Group revenue growth would have been 4% to 5% in constant currency (FY/21: 5% to 6%).
16% net income2,3,4 decline in constant currency
Group EBITDA before special items decreased by 2% (-7% in constant currency) to €1,802 million (Q4/212: €1,846 million). Reported Group EBITDA was €1,513 million (Q4/21: €1,868 million).
In FY/22, Group EBITDA before special items decreased by 1% (-6% in constant currency) at €6,808 million (FY/212: €6,854 million). Reported Group EBITDA was €6,294 million (FY/21: €6,825 million).
Group EBIT before special items decreased by 10% (-14% in constant currency) to €1,052 million (Q4/212: €1,166 million). The decrease was mainly driven by ongoing inflation leading to cost increases including personnel costs, material prices, logistics, and energy costs as well as negative one-offs at Fresenius Vamed and Fresenius Kabi. The EBIT margin before special items was 9.9% (Q4/212: 11.7%). Reported Group EBIT was €687 million (Q4/21: €1,123 million).
In FY/22, Group EBIT before special items decreased by 6% (-11% in constant currency) to €4,004 million (FY/212: €4,252 million). The EBIT margin before special items was 9.8% (FY/212: 11.3%). Reported Group EBIT was €3,321 million (FY/21: €4,158 million).
1 For estimated COVID-19 effects please see table on page 20.
2 Before special items
3 Net income attributable to shareholders of Fresenius SE & Co. KGaA
4 Excluding Ivenix and mAbxience acquisitions
For a detailed overview of special items please see the reconciliation tables on pages 22-25.
Group net interest before special items was -€157 million (Q4/211: -€120 million) mainly due to financing activities, rising interest rates and currency translation effects. Reported Group net interest was -€132 million (Q4/21: -€122 million). In FY/22, Group net interest before special items was -€533 million (FY/211: -€504 million). Reported Group net interest was -€507 million (FY/21: -€506 million).
Group tax rate before special items was 24.4% (Q4/21 : 23.2%) mainly due to an increase in the proportionate share of non-tax-deductible expenses compared to taxable income as well as tax law changes at Fresenius Medical Care. Reported Group tax rate was 27.4% (Q4/21: 24.2%). In FY/22, Group tax rate before special items was 23.7% (FY/211: 22.6%) while the reported Group tax rate was 24.8% (FY/2021: 22.8%).
Noncontrolling interests before special items were -€232 million (Q4/211: -€282 million) of which 97% were attributable to the noncontrolling interests in Fresenius Medical Care. Reported noncontrolling interests were -€148 million (Q4/21: -€260 million). In FY/22, Noncontrolling interests before special items were -€918 million (FY/211: -€1,033 million) of which 91% were attributable to the noncontrolling interests in Fresenius Medical Care. Reported noncontrolling interests were -€745 million (FY/21: -1,001 million).
Group net income2 before special items decreased by 15% (-19%/-16% in constant currency) to €445 million (Q4/211: €521 million). The decrease was driven by the challenging macroeconomic environment with increased uncertainties, general cost inflation, staff shortage, disruptions in supply chains, and increased energy costs. Moreover, rising interest costs and negative one-off items at Fresenius Vamed and Fresenius Kabi as well as a higher tax rate weighed on the net income development. Excluding estimated COVID-19 effects4, Group net income2 before special items was -19% to -15% in constant currency (Q4/21: 3% to 7%). Reported Group net income2 decreased to €255 million (Q4/21: €499 million).
In FY/22, Group net income2 before special items decreased by 7% (-12%/-10%3 in constant currency) to €1,729 million (FY/211: €1,867 million). Excluding estimated COVID-19 effects4, Group net income2 before special items was -16% to -12% in constant currency (FY/21: 6% to 10%). Reported Group net income2 decreased to €1,372 million (FY/21: €1,818 million).
1 Before special items
2 Net income attributable to shareholders of Fresenius SE & Co. KGaA
3 Excluding Ivenix and mAbxience acquisitions
4 For estimated COVID-19 effects please see table on page 20
For a detailed overview of special items please see the reconciliation tables on pages 22-25.
Earnings per share1 before special items decreased by 16% (-20% in constant currency) to €0.79 (Q4/21 : €0.94). Reported earnings per share1 were €0.45 (Q4/21: €0.90). In FY/22, earnings per share1 before special items decreased by 8% (-13% in constant currency) to €3.08 (FY/212: €3.35). Reported earnings per share1 were €2.44 (FY/21: €3.26).
1 Net income attributable to shareholders of Fresenius SE & Co. KGaA
2 Before special items
For a detailed overview of special items please see the reconciliation tables on pages 22-25.
Investments
Spending on property, plant and equipment was €713 million corresponding to 7% of revenue (Q4/21: €690 million; 7% of revenue). These investments served primarily for the modernization and expansion of dialysis clinics, production facilities as well as hospitals and day clinics. In FY/22, spending on property, plant and equipment was €1,886 million corresponding to 5% of revenue (FY/21: €2,032 million; 5% of revenue).
Total acquisition spending was €43 million (Q4/21: €278 million) mainly for dialysis clinics at Fresenius Medical Care. In FY/22, total acquisition spending was €1,579 million (FY/21: €1,085 million).
Cash flow development
Group operating cash flow increased to €1,824 million (Q4/21: €1,749 million) with a margin of 17.1% (Q4/21: 17.5%). The strong development was driven by better cash collections and improved working capital management. Free cash flow before acquisitions and dividends increased to €1,219 million (Q4/21: €1,075 million). Free cash flow after acquisitions and dividends increased to €1,107 million (Q4/21: €841 million).
In FY/22, Group operating cash flow decreased to €4,198 million (FY/21: €5,078 million) with a margin of 10.3% (FY/21: 13.5%). The decrease was mainly due to lower net income and higher inventories. Free cash flow before acquisitions and dividends decreased to €2,421 million (FY/21: €3,061 million). Free cash flow after acquisitions and dividends decreased to €701 million (FY/21: €1,193 million).
Solid balance sheet structure
Group total assets increased by 6% (4% in constant currency) to €76,415 million (Dec. 31, 2021: €71,962 million) given currency translation effects, acquisitions and the expansion of business activities. Current assets increased by 5% (4% in constant currency) to €18,279 million (Dec. 31, 2021: €17,461 million), mainly driven by the increase of inventories and other current assets. Non-current assets increased by 7% (4% in constant currency) to €58,136 million (Dec. 31, 2021: €54,501 million).
Total shareholders’ equity increased by 10% (7% in constant currency) to €32,218 million (Dec. 31, 2021: €29,288 million). The equity ratio was 42.2% (Dec. 31, 2021: 40.7%).
Group debt increased by 2% (1% in constant currency) at €27,763 million (Dec. 31, 2021: € 27,155 million). Group net debt increased by 3% (1% in constant currency) to € 25,014 million (Dec. 31, 2021: € 24,391 million).
As of December 31, 2022, the net debt/EBITDA ratio was 3.65x1,2 (Dec. 31, 2021: 3.51x1,2) mainly driven by lower EBITDA contribution as well as acquisition spending. The net debt/EBITDA as of December 31, 2022 excluding the closed acquisition of Ivenix and the completed acquisition of a majority stake in mAbxience was 3.581,2.
1 At LTM average exchange rates for both net debt and EBITDA; pro forma closed acquisitions/divestitures
2 Before special items
For a detailed overview of special items please see the reconciliation tables on pages 22-25.
Business Segments
Fresenius Medical Care
(Financial data according to Fresenius Medical Care press release)
Fresenius Medical Care is the world's largest provider of products and services for individuals with renal diseases. As of December 31, 2022, Fresenius Medical Care was treating approximately 345,000 patients in 4,116 dialysis clinics. Along with its core business, the Renal Care Continuum, the company focuses on expanding in complementary areas and in the field of critical care. ,

- Fresenius Medical Care sets strategic focus and accelerates transformation
- Full year earnings in line with expectations: continued impact from higher labor costs and inflationary cost increases
- 2023 expected to be a transition year towards earnings growth recovery in 2024
Revenue increased by 8% (2% in constant currency) to €4,997million (Q4/21: €4,647 million). Organic growth was 2%. Currency translation increased revenue growth by 6%. In FY/22, revenue increased by 10% (2% in constant currency) to €19,398 million (FY/21: €17,619 million). Organic growth was 2%. Currency translation increased revenue growth by 8%.
EBIT decreased by 22% (-28% in constant currency) to €352 million (Q4/21: €449 million) resulting in a margin of 7.0% (Q4/21: 9.7%). EBIT before special items increased by 1% (-8% in constant currency) to €495 million (Q4/21: €492 million), resulting in a margin1 of 9.9% (Q4/21: 10.6%). At constant currency, the decline was mainly due to supply chain and labor cost increases across all regions, the impact of U.S. Provider Relief funding from the U.S. government (PRF) received in the previous year’s quarter to compensate for certain COVID-19-related costs, and higher legal costs. This was partially offset by an unfavorable impact from the remeasurement of investments in the previous year and savings related to the FME25 program.
1 Before special items
2 Net income attributable to shareholders of Fresenius Medical Care AG & Co. KGaA
3 For further information, please see Fresenius Medical Care’s press release at www.freseniusmedicalcare.com.
For a detailed overview of special items please see the reconciliation tables on pages 22-25.
In FY/22, EBIT decreased by 18% (-25% in constant currency) to €1,512 million
(FY/21: €1,852 million) resulting in a margin of 7.8% (FY/21: 10.5%). At constant currency, the development was supported by €246 million (FY 2021: €63 million) of PRF to compensate for certain COVID-19-related costs. EBIT before special items decreased by 5% (-13% in constant currency) to €1,817 million (FY/21: €1,915 million), resulting in a margin of 9.4% (FY/21: 10.9 %).
Net income2 decreased by 39% (-47% in constant currency) to €139 million (Q4/21: €228 million). Net income2 before special items decreased by 4% (-14% in constant currency) to €253 million (Q4/21: €263 million). Besides the above-mentioned effects on operating income, the constant currency decline was mainly due to an increase in the proportionate share of non-tax-deductible expenses compared to taxable income as well as tax law changes.
In FY/22, net income2 decreased by 31% (-37% in constant currency) to €673 million (FY/21: €969 million). Net income2 before special items decreased by 10%
(-17% in constant currency) to €913 million (FY/21: €1,018 million).
Operating cash flow was €600 million (Q4/21: €669 million) with a margin of 12.0% (Q4/21: 14.4%). The decrease was mainly due to lower net income. In FY/22, operating cash flow was €2,167 million (FY/21: €2,489 million) with a margin of 11.2%
(FY/21: 14.1%).
For FY/23, Fresenius Medical Care expects revenue3 to grow at a low to mid-single digit percentage rate. In 2022, EBIT was supported by €277 million of PRF (at current currency). There is no additional governmental support assumed for 2023. To provide a comparable basis for the 2023 earnings outlook, the 2022 basis4 is adjusted accordingly. On this basis, EBIT is expected to remain flat or decline by up to a high single-digit percentage rate in 2023. In 2025, Fresenius Medical Care targets to achieve an improved operating income margin of 10-14%. Revenue and operating income, as referred to in the outlook, are both on a constant currency basis and excluding special items.
For further information, please see Fresenius Medical Care’s press release at www.freseniusmedicalcare.com.
1 Before special items
2 Net income attributable to shareholders of Fresenius Medical Care AG & Co. KGaA
3 FY/22 base: €19,398 million
4 FY/22 base: €1,540 million
Fresenius Kabi
Fresenius Kabi offers intravenously administered generic drugs, clinical nutrition and infusion therapies for seriously and chronically ill patients in the hospital and outpatient environments. The company is also a leading supplier of medical devices and transfusion technology products. In the biosimilars business, Fresenius Kabi develops products with a focus on oncology and autoimmune diseases.

- Strong organic revenue growth
- Biopharmaceuticals with continued dynamic growth trajectory
- EBIT impacted by a non-cash one time item related to in-process R&D in North America
Revenue increased by 12% (8% in constant currency) to €2,036 million (Q4/21: €1,823 million). Organic growth was 7%. In FY/22, revenue increased by 9% (4% in constant currency) to €7,850 million (FY/21: €7,193 million). Organic growth was 3%. Positive currency translation effects of 4% in Q4/22 and 5% in FY/22 were mainly related to the U.S. dollar.
Revenue in North America increased by 14% (organic growth: 3%) to €669 million (Q4/21: €589 million). The significant revenue growth was mainly driven by positive currency translation effects and a solid development of the regular business. In FY/22, revenue in North America increased by 12% (organic growth: 0%) to €2,522 million (FY/21: €2,258 million).
Revenue in Europe increased by 9% (organic growth: 6%) to €724 million (Q4/21: €664 million) driven by a broad-based positive development, in particular at biopharmaceuticals. In FY/22, revenue in Europe increased by 6% (organic growth: 5%) to €2,691 million (FY/21: €2,544 million).
1 Before special items
2 Net income attributable to shareholders of Fresenius SE & Co. KGaA
3 Excluding Ivenix and mAbxience acquisitions
For a detailed overview of special items please see the reconciliation tables on pages 22-25.
Revenue in Asia-Pacific decreased by 2% (organic growth: -2%) to €389 million (Q4/21: €395 million). Organic growth was affected by COVID lockdowns and associated lower patient demand as well as price pressure from the NVBP (National Volume-Based Procurement) tenders in China. In FY/22, revenue in Asia-Pacific increased by 4% (organic growth: -2%) to €1,714 million (FY/21: €1,643 million).
Revenue in Latin America/Africa increased by 45% (organic growth: 41%) to €254 million (Q4/21: €175 million), due to a positive business development in both regions. In addition, the revenue development was positively impacted by hyperinflation in Brazil and Mexico. In FY/22, revenue in Latin America/Africa increased by 23% (organic growth: 18%) to €923 million (FY/21: €748 million).
Revenue in the Biopharmaceuticals business was €72 million. In FY/22, revenue in the Biopharmaceuticals business was €188 million (FY/21: €62 million).
EBIT1 decreased by 15% (-19%/-13% in constant currency) to €236 million (Q4/21: €279 million). EBIT development was impacted by non-cash one-time write offs, primarily related to a capitalized in-process R&D project in North America. Moreover, ongoing macroeconomic headwinds including inflationary cost increases, staff shortages and disrupted supply chains impacted the EBIT performance. In China COVID lockdowns and associated lower patient demand as well as price declines in connection with NVBP tenders weighed on profitability.
EBIT margin1 was 11.6% (Q4/21: 15.3%). Excluding the acquisitions of Ivenix and the majority stake in mAbxience, the constant currency EBIT margin1 was at 12.7%2 in Q4/22. In FY/22, EBIT1 decreased by 6% (-14%/-10%2 in constant currency) to €1,080 million (FY/21: €1,153 million) with an EBIT margin1 of 13.8%/14.4%2 (FY/21: 16.0%).
Net income1,3 increased by 16% (10% in constant currency) to €206 million (Q4/21: €178 million). In FY/22, net income1,3 remained stable (declined by -7% in constant currency) at €780 million (FY/21: €778 million).
1 Before special items
2 Excluding Ivenix and mAbxience acquisitions
3 Net income attributable to shareholders of Fresenius SE & Co. KGaA
For a detailed overview of special items please see the reconciliation tables on pages 22-25.
Operating cash flow decreased to €298 million (Q4/21: €335 million) with a margin of 14.6% (Q4/21: 18.4%) mainly driven by lower net income and higher inventories. In FY/22, operating cash flow decreased to €841 million (FY/21: €1,203 million) with a margin of 10.7% (FY/21: 16.7%).
For FY/23, Fresenius Kabi expects organic revenue1 growth in a low- to mid-single-digit percentage range. The EBIT margin2 is expected to be around one percentage point (pp) below the structural margin band of 14% to 17%.
1 FY/22 base: €7,850 million
2 FY/22 base: EBIT margin: 13.8%, before special items; FY/23 before special items
For a detailed overview of special items please see the reconciliation tables on pages 22-25.
Fresenius Helios
Fresenius Helios is Europe's leading private hospital operator. The company comprises Helios Germany, Helios Spain and Helios Fertility. Helios Germany operates 87 hospitals, around 240 outpatient centers, 21 occupational health centers and 6 prevention centers. Helios Spain operates 50 hospitals, around 100 outpatient centers and around 300 occupational risk prevention centers. In addition, the company is active in Latin America with 8 hospitals and as a provider of medical diagnostics. Helios Fertility offers a wide spectrum of state-of-the-art services in the field of fertility treatments.

- Fresenius Helios with strong organic revenue growth and healthy EBIT development
- Helios Germany with a return to a pre-COVID patient structure by year-end
- Helios Spain with very strong and consistent patient demand
- Helios Fertility with lower volumes driven by delayed treatments
Revenue increased by 5% (5% in constant currency) to €3,031 million (Q4/21: €2,882 million). Organic growth was 5%. Acquisitions at Helios Spain and Helios Fertility contributed 1% to revenue growth. Divestments reduced revenue by 1%. In FY/22, revenue increased by 8% (7% in constant currency) to €11,716 million (FY/21: €10,891 million). Organic growth was 6%. Acquisitions contributed 2% to revenue growth. Divestments reduced revenue by 1%.
Revenue of Helios Germany was flat (organic growth: 0%) to €1,749 million (Q4/21: €1,745 million), mainly driven by increasing admissions and a return to a pre-COVID patient structure by year-end. In FY/22, revenue of Helios Germany increased by 4% (organic growth: 4%) to €7,021 million (FY/21: €6,733 million.
Revenue of Helios Spain increased by 12% (12% in constant currency) to €1,214 million (Q4/21: €1,084 million). Organic growth of 12% was driven by very strong and consistent patient demand. The clinics in Latin America also showed a good performance. In FY/22, revenue of Helios Spain increased by 10% (10% in constant currency) to €4,441 million (FY/21: €4,021 million). Organic growth was 9%.
Revenue of the Helios Fertility were €66 million (Q4/21: €51 million). In FY/22, revenue of the Helios Fertility were €250 million (FY/21: €133 million).
1 Before special items
2 Net income attributable to shareholders of Fresenius SE & Co. KGaA
For a detailed overview of special items please see the reconciliation tables on pages 22-25.
EBIT1 increased by 4% (5% in constant currency) at €354 million (Q4/21: €339 million) with an EBIT margin1 of 11.7% (Q4/21: 11.8%). In FY/22, EBIT1 increased by 5% (5% in constant currency) to €1,185 million (FY/21: 1,127 million) with an EBIT margin1 of 10.1% (FY/21: 10.3%).
EBIT1 of Helios Germany increased by 2% to €174 million (Q4/21: €171 million) with an EBIT margin1 of 9.9% (Q4/21: 9.8%). The increase of costs from the use of external staff mainly due to flu-related staff absenteeism continued to weigh on profitability. Inflationary cost effects had also a negative impact. In FY/22, EBIT1 of Helios Germany increased by 2% to €623 million (FY/21: €613 million) with an EBIT margin1 of 8.9% (FY/21: 9.1%).
EBIT1 of Helios Spain increased due to the strong revenue growth and despite cost inflation by 6% (7% in constant currency) to €172 million (Q4/21: €162 million). The EBIT margin1 was 14.2% (Q4/21: 14.9%). In FY/22, EBIT1 of Helios Spain increased by 8% (8% in constant currency) to €556 million (FY/21: €514 million). The EBIT margin1 was 12.5% (FY/21: 12.8%).
EBIT1 of Helios Fertility was €6 million (Q4/21: €5 million) with an EBIT margin1 of 9.1% (Q4/21: 9.8%). Lower volumes by delayed treatments driven by macroeconomic environment. In FY/22, EBIT1 of Helios Fertility was €21 million (FY/21: €19 million) with an EBIT margin1 of 8.4% (FY/21: 14.3%).
Net income1,2 increased by 4% (4% in constant currency) to €236 million (Q4/21: €227 million). In FY/22, net income1,2 increased by 5% (5% in constant currency) to €766 million (FY/21: €728 million).
Operating cash flow increased to €956 million (Q4/21: €609 million) with a margin of 31.5% (Q4/21: 21.1%) mainly due to an improved receivables management. In FY/22, operating cash flow increased to €1,367 million (FY/21: €1,204 million) with a margin of 11.7% (FY/21: 11,1%)
For FY/23, Fresenius Helios expects organic revenue growth in a mid-single-digit percentage range. The EBIT margin is expected to be within the structural margin band of 9% to 11%.
1 Before special items
2 Net income attributable to shareholders of Fresenius SE & Co. KGaA
3 FY/22 base: €11,716 million
4 FY/22 base: EBIT margin: 10.1%, before special items, FY/23 before special items
For a detailed overview of special items please see the reconciliation tables on pages 22-25.
Fresenius Vamed
Fresenius Vamed manages projects and provides services for hospitals and other health care facilities worldwide and is a leading post-acute care provider in Central Europe. The portfolio ranges along the entire value chain: from project development, planning, and turnkey construction, via maintenance and technical management to total operational management.

- Service business showing solid top-line performance, but one-time items and macro headwinds impact profitability
- Weak top-line performance driven by difficult economic environment and negative one-time items adversely impact earnings in project business
- Macro environment leading to negative one-time effects: Impairments due to reassessment and revaluation of claims and legal proceedings as well as certain business initiations that did not materialize as planned
Revenue decreased by 5% (-5% in constant currency) to €712 million (Q4/21: €748 million). Organic growth was -5%. In FY/22, revenue increased by 3% (2% in constant currency) to €2,359 million (FY/21: €2,297 million). Organic growth was 2%.
Revenue in the service business increased by 7% (7% in constant currency) to €445 million (Q4/21: €415 million) due to increasing rehabilitation treatments given fewer capacity restrictions. Revenue in the project business decreased by 20% (-20% in constant currency) to €267 million (Q4/21: €333 million. The weak revenue performance is mainly attributable to the continuing difficult macroeconomic environment. In FY/22, revenue in the service business increased by 7% (6% in constant currency) to €1,685 million (FY/21: €1,580 million). Revenue in the project business decreased by 6% (-6% in constant currency) to €674 million (FY/21: €717 million).
1 Before special items
2 Net income attributable to shareholders of VAMED AG
For a detailed overview of special items please see the reconciliation tables on pages 22-25.
EBIT1 decreased by 114% to -€9 million (Q4/21: €66 million) with an EBIT margin1 of -1.3% (Q4/21: 8.8%). Main driver for the weak development is the macroeconomic backdrop which led to a lower than expected revenue development in the project business and to significant negative one-time effects in the form of impairments due to a reassessment and revaluation of claims and legal proceedings as well as certain business initiations that did not materialize as planned. In FY/22, EBIT1 decreased by 80% to €20 million (FY/21: €101 million) with an EBIT margin1 of 0.8% (FY/21: 4.4%).
Net income1,2 decreased by 129% to -€14 million (Q4/21: €49 million). In FY/22, Net income1,2 decreased by 99% to €1 million (FY/21: €67 million).
Order intake was €572 million (Q4/21: €319 million). In FY/22 order intake was €1,241 million (FY/21: €1,290 million). As of December 31, 2022, order backlog was at €3,689 million (December 31, 2021: €3,473 million).
Operating cash flow decreased to €12 million (Q4/21: €128 million) with a margin of 1.7% (Q4/21: 17.1%), due to higher receivables and payed traded acoounts payable. In FY/22, operating cash flow decreased to -€44 million (FY/21: €151 million) with a margin of -1.9% (FY/21: 6.6%).
For FY/2023, Fresenius Vamed expects organic revenue to grow in a low-to mid-single digit percentage range. The EBIT margin is expected to be clearly below the structural margin band of 4% to 6%.
1 Before special items
2 Net income attributable to shareholders of VAMED AG
3 FY/22 base: €2,359 million
4 FY/22 base: EBIT margin: 0.8%, before special items; FY/23 before special items
For a detailed overview of special items please see the reconciliation tables on pages 22-25.
For additional information on the performance indicators used please refer to our website https://www.fresenius.com/alternative-performance-measures.
This release contains forward-looking statements that are subject to various risks and uncertainties. Future results could differ materially from those described in these forward-looking statements due to certain factors, e.g. changes in business, economic and competitive conditions, regulatory reforms, results of clinical trials, foreign exchange rate fluctuations, uncertainties in litigation or investigative proceedings, the availability of financing and unforeseen impacts of international conflicts. Fresenius does not undertake any responsibility to update the forward-looking statements in this release.
- Healthy organic sales growth and ongoing margin pressure
- Fresenius Medical Care’s business development impacted by delayed effects from improvements in North American Services business in challenging environment
- Fresenius Kabi with healthy sales growth and sequential improvement
- Fresenius Helios with strong organic sales growth, solid EBIT in line with usual third quarter seasonality
- Fresenius Vamed impacted by macroeconomic headwinds and COVID-19
If no timeframe is specified, information refers to Q3/2022.

1 Before special items, Q1/22 restated following remeasurement Humacyte investment
2 Net income attributable to shareholders of Fresenius SE & Co. KGaA
3 Excluding Ivenix and mAbxience acquisitions
For a detailed overview of special items please see the reconciliation tables on pages 22-25 in the PDF.
Michael Sen, CEO of Fresenius said, “Over the past month, I’ve met with many of my Fresenius colleagues. Like me, they have tremendous passion and commitment to patients, physicians and health care professionals. What we do is life-saving.”
Sen continued, “Everyone at Fresenius knows we must improve on what we do. My priorities are clear: Reset the company aiming at becoming a stronger company and delivering value for our shareholders. Our businesses are growing yet in a more challenging environment. Now we sharpen our focus on structural productivity. More fundamentally, we have embarked on a top-to-bottom review of every business activity, looking at the entire corporate portfolio. The focus is on returns. This will not happen overnight, but we will move at a faster pace and more decisively than ever before. This will benefit all our stakeholders. This is #FutureFresenius.”
Sen concluded, “Fresenius is a strong company, with great products, great market positions. Now we have to make it stronger.”
FY/22 Group guidance
Since Fresenius Medical Care continues to operate in a challenging environment, the impacts of the Company’s focused efforts to improve North American Health Care Services operations are delayed against previous assumptions. Therefore, Fresenius Medical Care now assumes lower contributions in the financial year 2022.
Consequently, Fresenius Medical Care now expects net income (attributable to shareholders of Fresenius Medical Care AG & Co. KGaA) for the financial year 2022 to decline in the high teens to mid-twenties percentage range. The Company continues to anticipate revenue to grow at a low-single digit percentage range in the financial year 2022. These targets are in constant currency and exclude special items.
All other business segments of the Fresenius Group, in particular Vamed, are also affected by a challenging overall economic environment. Thus, there are increased uncertainties, inflation-related cost increases, staff shortages, disruptions in supply chains, and increased energy costs. This has a direct impact on customer and patient behavior.
However, as a consequence of the development at Fresenius Medical Care, Fresenius Vamed, and in view of increasing indications of a persistent unfavorable development of these and other factors for the further course of the financial year, the Management Board has changed its risk assessment and consequently also adjusted the Group outlook for FY/22.
At constant currency, the Company now anticipates Group net income1,2 to decline around ten percent (previously: decline in a low-to-mid single-digit percentage range). Group sales3 in constant currency continue to be expected to grow in a low-to-mid single-digit percentage range.
Without the closed acquisition of Ivenix and the completed acquisition of a majority stake in mAbxience as well as any further potential acquisitions, Fresenius expects the net debt/EBITDA4 ratio to be roughly on the same level as in Q3/22 (3.64x5) by the end of 2022 (December 31, 2021: 3.51x5).
1 Net income attributable to shareholders of Fresenius SE & Co. KGaA
2 FY/21 base: €1,867 million, before special items; FY/22: before special items
3 FY/21 base: €37,520 million
4 At LTM average exchange rates for both net debt and EBITDA; pro forma closed acquisitions/divestitures; excluding further potential acquisitions; before special items; including lease liabilities
5 At LTM average exchange rates for both net debt and EBITDA; pro forma closed acquisitions/divestitures;
before special items; including lease liabilities
For a detailed overview of special items please see the reconciliation tables on pages 22-25 in the PDF.
Assumptions for guidance FY/22
For 2022 and beyond, Fresenius expects that the current challenging market environment and the global macro-economic headwinds will remain. In particular, the general cost inflation, labor shortages, meaningful uncertainty with regard to the future development of energy prices, burdens from supply chain disruptions and ongoing impacts of the COVID-19 pandemic are expected to continue. The guidance does not consider a significant disruption of gas or electricity supplies in Europe.
Fresenius will continue to closely monitor the potential further consequences of the overall heightened volatility and muted visibility, including balance sheet valuations.
The war in Ukraine is directly and indirectly affecting Fresenius Group operations. The direct adverse effects of the war amounted to €24 million at net income1 level of Fresenius Group in Q1-3/22 and are treated as a special item.
An unlikely but possible significant deterioration of the situation triggering containment measures that could have a significant and direct impact on the health care sector without any appropriate compensation is not reflected in the Group’s FY/22 guidance.
For Fresenius Medical Care‘s contribution to the Group’s financial figures, the assumptions for Fresenius Medical Care's FY/22 guidance are also fully applicable to Fresenius Group's FY/22 guidance.
All of these assumptions are subject to considerable uncertainty.
The acquisitions of Ivenix and of the majority stake in mAbxience as well as any further potential acquisitions remain excluded from guidance.
1 Net income attributable to shareholders of Fresenius SE & Co. KGaA
5% sales increase in constant currency
Group sales increased by 12% (5% in constant currency) to €10,459 million (Q3/21: €9,324 million). Organic growth was 4%. Acquisitions/divestitures contributed net 1% to growth. Currency translation increased sales growth by 7%. Excluding estimated COVID-19 effects1, Group sales growth would have been 4% to 5% in constant currency (Q3/21: 7% to 8%).
In Q1-3/22, Group sales increased by 10% (4% in constant currency) to €30,197 million (Q1-3/21: €27,554 million). Organic growth was 3%. Acquisitions/divestitures contributed net 1% to growth. Currency translation increased sales growth by 6%. Excluding estimated COVID-19 effects1, Group sales growth would have been 3% to 4% in constant currency (Q1-3/21: 5% to 6%).
19% net income2,3,4 decline in constant currency
Group EBITDA before special items decreased by 2% (-10% in constant currency) to €1,662 million (Q3/212: €1,703 million). Reported Group EBITDA was €1,658 million (Q3/21: €1,667 million).
In Q1-3/22, Group EBITDA before special items remained nearly unchanged (-6% in constant currency) at €5,006 million (Q1-3/212: €5,008 million). Reported Group EBITDA was €4,781 million (Q1-3/21: €4,957 million).
Group EBIT before special items decreased by 9% (-17% in constant currency) to €949 million (Q3/212: €1,044 million). The decrease was mainly driven by higher labor costs at Fresenius Medical Care in the U.S., general cost inflation, revaluation of contract assets in the international service and project business at Fresenius Vamed as well as higher costs in the Corporate segment. The EBIT margin before special items was 9.1% (Q3/212: 11.2%). Reported Group EBIT was €887 million (Q3/21: €1,008 million).
In Q1-3/22, Group EBIT before special items decreased by 4% (-10% in constant currency) to €2,952 million (Q1-3/212: €3,086 million). The EBIT margin before special items was 9.8% (Q1-3/212: 11.2%). Reported Group EBIT was €2,634 million (Q1-3/21: €3,035 million).
1 For estimated COVID-19 effects please see table on page 20.
2 Before special items
3 Net income attributable to shareholders of Fresenius SE & Co. KGaA
4 Excluding Ivenix and mAbxience acquisitions
For a detailed overview of special items please see the reconciliation tables on pages 22-25 in the PDF.
Group net interest before special items was -€141 million (Q3/211: -€126 million) mainly due to currency translation effects and overall higher interest rates. Reported Group net interest decreased to -€141 million (Q3/21: -€126 million).
In Q1-3/22, Group net interest before special items improved to -€376 million (Q1-3/211: -€384 million). Reported Group net interest improved to -€375 million (Q1-3/21: -€384 million).
Group tax rate before special items was 25.0% (Q3/211: 22.9%) mainly due to an increase in the proportionate share of non-tax-deductible expenses compared to taxable income at Fresenius Medical Care. Reported Group tax rate was 26.1% (Q3/21: 22.8%). In Q1-3/22, Group tax rate before special items was 23.5% (Q1-3/211: 22.4%) while the reported Group tax rate was 24.1% (Q1-3/21: 22.3%).
Noncontrolling interests before special items were -€235 million (Q3/211: -€273 million) of which 90% were attributable to the noncontrolling interests in Fresenius Medical Care. Reported noncontrolling interests were -€230 million (Q3/21: -€268 million).
In Q1-3/22, Noncontrolling interests before special items were -€686 million (Q1-3/211: -€751 million) of which 89% were attributable to the noncontrolling interests in Fresenius Medical Care. Reported noncontrolling interests were -€597 million (Q1-3/21: -€741 million).
Group net income2 before special items decreased by 15% (-22%/-19%3 in constant currency) to €371 million (Q3/211: €435 million). The decrease was mainly driven by higher labor costs at Fresenius Medical Care in the U.S., general cost inflation, revaluation of contract assets in the international service and project business at Fresenius Vamed as well as higher costs in the Corporate/Other segment. Moreover, increased interest expenses and a higher tax rate had a negative effect on Group net income. Excluding estimated COVID-19 effects4, Group net income2 before special items was -26% to -22% in constant currency (Q3/21: 12% to 16%). Reported Group net income2 decreased to €321 million (Q3/21: €413 million).
In Q1-3/22, Group net income2 before special items decreased by 5% (-10%/-8%3 in constant currency) to €1,284 million (Q1-3/211: €1,346 million). Excluding estimated COVID-19 effects4, Group net income2 before special items was -15% to -11% in constant currency (Q1-3/21: 7% to 11%). Reported Group net income2 decreased to €1,117 million (Q1-3/21: €1,319 million).
1 Before special items
2 Net income attributable to shareholders of Fresenius SE & Co. KGaA
3 Excluding Ivenix and mAbxience acquisitions
4 For estimated COVID-19 effects please see table on page 20
For a detailed overview of special items please see the reconciliation tables on pages 22-25 in the PDF.
Earnings per share1 before special items decreased by 15% (-22% in constant currency) to €0.66 (Q3/212: €0.78). Reported earnings per share1 were €0.57 (Q3/21: €0.74).
In Q1-3/22, earnings per share1 before special items decreased by 5% (-10% in constant currency) to €2.29 (Q1-3/212: €2.41). Reported earnings per share1 were €1.99 (Q1-3/21: €2.36).
Continued investment in growth
Spending on property, plant and equipment was €416 million corresponding to 4% of sales (Q3/21: €449 million; 5% of sales). These investments served primarily for the modernization and expansion of dialysis clinics, production facilities as well as hospitals and day clinics. In Q1-3/22, spending on property, plant and equipment was €1,173 million corresponding to 4% of sales (Q1-3/21: €1,342 million; 5% of sales).
Total acquisition spending was €502 million (Q3/21: €167 million), mainly for the majority stake in mAbxience by Fresenius Kabi. In Q1-3/22, total acquisition spending was €955 million (Q1-3/21: €807 million).
Cash flow development
Group operating cash flow increased to €1,256 million (Q3/21: €1,226 million) with a margin of 12.0% (Q3/21: 13.1%). Free cash flow before acquisitions and dividends increased to €876 million (Q3/21: €793 million). Free cash flow after acquisitions and dividends decreased to €388 million (Q3/21: €594 million).
In Q1-3/22, Group operating cash flow decreased to €2,374 million (Q1-3/21: €3,329 million) with a margin of 7.9% (Q1-3/21: 12.1%). Free cash flow before acquisitions and dividends decreased to €1,202 million (Q1-3/21: €1,986 million). Free cash flow after acquisitions and dividends decreased to -€406 million (Q1-3/21: €352 million).
Solid balance sheet structure
Group total assets increased by 12% (4% in constant currency) to €80,328 million (Dec. 31, 2021: €71,962 million) given currency translation effects, acquisitions and the expansion of business activities. Current assets increased by 11% (6% in constant currency) to €19,443 million (Dec. 31, 2021: €17,461 million), mainly driven by the increase of trade accounts receivables and inventories. Non-current assets increased by 12% (4% in constant currency) to €60,885 million (Dec. 31, 2021: €54,501 million).
Total shareholders’ equity increased by 17% (6% in constant currency) to €34,156 million (Dec. 31, 2021: €29,288 million). The equity ratio was 42.5% (Dec. 31, 2021: 40.7%).
Group debt increased by 5% (1% in constant currency) at €28,607 million (Dec. 31, 2021: € 27,155 million). Group net debt increased by 9% (4% in constant currency) to € 26,479 million (Dec. 31, 2021: € 24,391 million).
As of September 30, 2022, the net debt/EBITDA ratio was 3.74x1,2 (Dec. 31, 2021: 3.51x1,2) mainly driven by lower EBITDA contribution as well as acquisition spending. The net debt/EBITDA as of September 30, 2022 excluding the closed acquisition of Ivenix and the completed acquisition of a majority stake in mAbxience was 3.641,2.
1 At LTM average exchange rates for both net debt and EBITDA; pro forma closed acquisitions/divestitures
2 Before special items
For a detailed overview of special items please see the reconciliation tables on pages 22-25 in the PDF.
Business Segments
Fresenius Medical Care
(Financial data according to Fresenius Medical Care press release)
Fresenius Medical Care is the world's largest provider of products and services for individuals with renal diseases. As of September 30, 2022, Fresenius Medical Care was treating 344,593 patients in 4,153 dialysis clinics. Along with its core business, the Renal Care Continuum, the company focuses on expanding in complementary areas and in the field of critical care.

- Business development continues to be strongly impacted by uncertain inflationary macroeconomic environment
- Impacts of improvements in North American Health Care Services operations delayed
- COVID-19-related excess mortality in line with expectations
- Important step in value-based care achieved with closing of InterWell Health merger
Sales increased by 15% (3% in constant currency) to €5,096 million (Q3/21: €4,441 million). Organic growth was 2%. Currency translation increased sales growth by 12%. In Q1-3/22, sales increased by 11% (2% in constant currency) to €14,401 million (Q1-3/21: €12,972 million). Organic growth was 1%. Currency translation increased sales growth by 9%.
EBIT decreased by 7% (-17% in constant currency) to €472 million (Q3/21: €505 million) resulting in a margin of 9.3% (Q3/21: 11.4%). EBIT before special items decreased by 8% (-18% in constant currency) to €470 million (Q3/21: €513 million), resulting in a margin1 of 9.2% (Q3/21: 11.6%). At constant currency, the decline was mainly due to higher labor costs as well as inflationary and supply chain cost increases. This was partially offset by €80 million (Q3 2021: €0.3 million) of Provider Relief Funding from the U.S. government to compensate for certain COVID-19-related costs. In Q1-3/22, EBIT decreased by 17% (-24% in constant currency) to €1,160 million (Q1-3/21: €1,403 million) resulting in a margin of 8.1% (Q1-3/21: 10.8%). EBIT before special items decreased by 7% (-14% in constant currency) to €1,322 million (Q1-3/21: €1,423 million), resulting in a margin1 of 9.2% (Q1-3/21: 11.0%).
Net income2 decreased by 16% (-24% in constant currency) to €230 million (Q3/21: €273 million). Net income2 before special items decreased by 17% (-25% in constant currency) to €231 million (Q3/21: €280 million). Besides the above-mentioned effects on operating income, the constant currency decline was mainly due to an increase in the proportionate share of non-tax-deductible expenses compared to taxable income.
In Q1-3/22, net income2 decreased by 28% (-34% in constant currency) to €535 million (Q1-3/21: €741 million). Net income2 before special items decreased by 13% (-18% in constant currency) to €660 million (Q1-3/21: €756 million).
Operating cash flow was €658 million (Q3/21: €692million) with a margin of 12.9% (Q3/21: 15.6%). The decrease was mainly due to lower net income. In Q1-3/22, operating cash flow was €1,568 million (Q1-3/21: €1,820 million) with a margin of 10.9% (Q1-3/21: 14.0%).
Based on the delayed impacts of improvements in North American Health Care Services operations, the continuously challenging and uncertain macroeconomic environment, and the results for the third quarter, which had a more pronounced support by one-time effects, Fresenius Medical Care, as a matter of caution, extends its 2022 guidance range for net income2,3 decline from a high-teens to a high-teens to mid-twenties percentage range. The Company confirms its target for revenue4 to grow at a low single digit percentage rate in full year 2022. Revenue and net income guidance are both on a constant currency basis and excluding special items5.
1 Before special items
2 Net income attributable to shareholders of Fresenius Medical Care AG & Co. KGaA
3 FY/21 base: €1,018 million, before special items; FY/22 before special items
4 FY/21 base: €17,619 million
5 These targets are based on the 2021 results excluding the costs related to FME25 of EUR 49 million (for Net Income). They are in constant currency and exclude special items. Special items include further costs related to FME25, the impact of the war in Ukraine, the impact of hyperinflation in Turkiye, the Humacyte investment remeasurement, the net gain related to InterWell Health and other effects that are unusual in nature and have not been foreseeable or not foreseeable in size or impact at the time of giving guidance.
For a detailed overview of special items please see the reconciliation tables on pages 22-25 in the PDF.
InterWell Health merger closed
With the closing of the three-way merger of Fresenius Health Partners, InterWell Health and Cricket Health, a premier value-based kidney care provider has been created in the U.S. This is an important step in the execution of Fresenius Medical Care’s strategy. The new company operates under the InterWell Health brand and will be fully consolidated by Fresenius Medical Care as the majority owner. The closing of the merger resulted in a net gain of €56 million (on EBIT level) in the third quarter, which is treated as a special item.
For further information, please see Fresenius Medical Care’s press release at www.freseniusmedicalcare.com.
Fresenius Kabi
Fresenius Kabi offers intravenously administered generic drugs, clinical nutrition and infusion therapies for seriously and chronically ill patients in the hospital and outpatient environments. The company is also a leading supplier of medical devices and transfusion technology products. In the biosimilars business, Fresenius Kabi develops products with a focus on oncology and autoimmune diseases.

1 Before special items
2 Net income attributable to shareholders of Fresenius SE & Co. KGaA
3 Excluding Ivenix and mAbxience acquisitions
For a detailed overview of special items please see the reconciliation tables on pages 22-25 in the PDF.
- Solid organic sales growth in all three growth vectors against already strong Q3/21
- Biopharmaceuticals continue strong trajectory in line with ambitious plan
- Growth in Europe and rest of the world outweighing pressures in North America
- Sequentially constant EBIT margin3 despite headwinds from cost increases
Sales increased by 12% (4% in constant currency) to €2,071 million (Q3/21: €1,854 million). Organic growth was 3%. In Q1-3/22, sales increased by 8% (2% in constant currency) to €5,814 million (Q1-3/21: €5,370 million). Organic growth was 2%. Positive currency translation effects of 8% in Q3/22 and 6% in Q1-3/22 were mainly related to the U.S. dollar and Chinese yuan.
Sales in North America increased by 13% (organic growth: -2%) to €668 million (Q3/21: €589 million). The significant sales growth was mainly driven by positive currency effects while organic growth continued to be impacted by ongoing competitive pressure and supply chain challenges. In Q1-3/22, sales in North America increased by 11% (organic growth: -1%) to €1,853 million (Q1-3/21: €1,669 million).
Sales in Europe increased by 8% (organic growth: 6%) to €669 million (Q3/21: €620 million) driven by a broad-based positive development, and biopharmaceuticals. In Q1-3/22, sales in Europe increased by 5% (organic growth: 4%) to €1,967 million (Q1-3/21: €1,880 million).
Sales in Asia-Pacific increased by 4% (organic growth: -4%) to €467 million (Q3/21: €447 million). Organic growth was affected by price pressure from the NVBP (National Volume-Based Procurement) tenders in China. In Q1-3/22, sales in Asia-Pacific increased by 6% (organic growth: -2%) to €1,325 million (Q1-3/21: €1,248 million).
Sales in Latin America/Africa increased by 35% (organic growth: 27%) to €267 million (Q3/21: €198 million), due to a positive business development in both regions. In Q1-3/22, sales in Latin America/Africa increased by 17% (organic growth: 11%) to €669 million (Q1-3/21: €573 million).
Sales in the Biopharmaceuticals business was €64 million. In Q1-3/22, sales in the Biopharmaceuticals business was €116 million.
EBIT1 decreased by 7% (-18%/-11% in constant currency) to €280 million (Q3/21: €300 million), mainly related to ongoing cost inflation, supply chain challenges as well as competitive pressure. EBIT margin1 was 13.5% (Q3/21: 16.2%). Excluding the acquisitions of Ivenix and the majority stake in mAbxience, the constant currency EBIT margin1 was sequentially stable at 14.6%2 in Q3/22 (Q2/22: 14.7%2) despite the mentioned headwinds. In Q1-3/22, EBIT1 decreased by 3% (-12%/-9%2 in constant currency) to €844 million (Q1-3/21: €874 million) with an EBIT margin1 of 14.5%/15.0%2 (Q1-3/21: 16.3%).
Net income1,3 decreased by 11% (-21% in constant currency) to €184 million (Q3/21: €206 million). In Q1-3/22, net income1,3 decreased by 4% (-13% in constant currency) to €574 million (Q1-3/21: €600 million).
1 Before special items
2 Excluding Ivenix and mAbxience acquisitions
3 Net income attributable to shareholders of Fresenius SE & Co. KGaA
For a detailed overview of special items please see the reconciliation tables on pages 22-25 in the PDF.
Operating cash flow decreased to €301 million (Q3/21: €393 million) with a margin of 14.5% (Q3/21: 21.2%), mainly driven by a working capital build-up from e.g. higher inventories. In Q1-3/22, operating cash flow decreased to €543 million (Q1-3/21: €868 million) with a margin of 9.3% (Q1-3/21: 16.2%).
For FY/22, Fresenius Kabi confirms its outlook and expects organic sales1 growth in a low-single-digit percentage range. Constant currency EBIT2 is expected to decline in a high-single- to low-double-digit percentage range. Both sales and EBIT outlook include expected COVID-19 effects. The financial effects from the acquisitions of Ivenix and the majority stake in mAbxience remain excluded from guidance.
1 FY/21 base: €7,193 million
2 FY/21 base: €1,153 million, before special items, FY/22 before special items,
excluding Ivenix and mAbxience acquisitions
For a detailed overview of special items please see the reconciliation tables on pages 22-25 in the PDF.
Fresenius Helios
Fresenius Helios is Europe's leading private hospital operator. The company comprises Helios Germany, Helios Spain and Helios Fertility. Helios Germany operates 87 hospitals, ~130 outpatient centers and 6 prevention centers. Helios Spain operates 50 hospitals, 101 outpatient centers and around 300 occupational risk prevention centers. In addition, the company is active in Latin America with 8 hospitals and as a provider of medical diagnostics. Helios Fertility offers a wide spectrum of state-of-the-art services in the field of fertility treatments.

- Fresenius Helios with strong organic sales growth; solid EBIT development in line with usual third quarter seasonality
- Helios Germany with gradually improving admissions
- Helios Spain with ongoing healthy activity levels
- Helios Fertility with lower volumes driven by delayed treatments
Sales increased by 8% (7% in constant currency) to €2,829 million (Q3/21: €2,622 million). Organic growth was 6%. Acquisitions, mainly at Helios Fertility, contributed 2% to sales growth. Divestments reduced sales by 1%. In Q1-3/22, sales increased by 8% (8% in constant currency) to €8,685 million (Q1-3/21: €8,009 million). Organic growth was 6%. Acquisitions contributed 2% to sales growth.
Sales of Helios Germany increased by 6% (organic growth: 5%) to €1,731 million (Q3/21: €1,640 million), mainly driven by gradually increasing admissions, which are however still below pre-pandemic levels. Acquisitions contributed 1% to sales growth. In Q1-3/22, sales of Helios Germany increased by 6% (organic growth: 5%) to €5,272 million (Q1-3/21: €4,988 million). Acquisitions contributed 1% to sales growth.
Sales of Helios Spain increased by 10% (9% in constant currency) to €1,037 million (Q3/21: €941 million). Organic growth of 8% was driven by the continuous high level of treatment activity. The clinics in Latin America also showed a good performance. Acquisitions contributed 1% to sales growth. In Q1-3/22, sales of Helios Spain increased by 10% (9% in constant currency) to €3,227 million (Q1-3/21: €2,937 million). Organic growth was 9%.
Sales of the Helios Fertility were €62 million (Q3/21: €40 million). In Q1-3/22, sales of the Helios Fertility were €184 million.
EBIT1 remained stable (-1% in constant currency) at €222 million (Q3/21: €222 million) with an EBIT margin1 of 7.8% (Q3/21: 8.5%). In Q1-3/22, EBIT1 increased by 5% (5% in constant currency) to €831 million (Q1-3/21: 788 million) with an EBIT margin1 of 9.6% (Q1-3/21: 9.8%).
EBIT1 of Helios Germany increased by 1% to €141 million (Q3/21: €140 million) with an EBIT margin1 of 8.1% (Q3/21: 8.5%). The increase of costs from the use of external staff due to COVID-19 related staff absenteeism continued to weigh on profitability. Inflationary cost effects had only a small negative impact. In Q1-3/22, EBIT1 of Helios Germany increased by 2% to €449 million (Q1-3/21: €442 million) with an EBIT margin1 of 8.5% (Q1-3/21: 8.9%).
EBIT1 of Helios Spain increased by 5% (3% in constant currency) to €83 million (Q3/21: €79 million) despite increased cost inflation. The EBIT margin1 was 8.0% (Q3/21: 8.4%). In Q1-3/22, EBIT1 of Helios Spain increased by 9% (9% in constant currency) to €384 million (Q1-3/21: €352 million). The EBIT margin1 was 11.9% (Q1-3/21: 12.0%).
EBIT1 of Helios Fertility was €4 million with an EBIT margin1 of 6.5% (Q3/21: €9 million). Lower volumes by delayed treatments driven by macroeconomic environment. Prior year quarter was inflated by a positive special item. In Q1-3/22, EBIT1 of Helios Fertility was €15 million (Q1-3/21: €14 million) with an EBIT margin1 of 8.2%.
Net income1,2 increased by 2% (1% in constant currency) to €138 million (Q3/21: €135 million). In Q1-3/22, net income1,2 increased by 6% (5% in constant currency) to €530 million (Q1-3/21: €501 million).
Operating cash flow increased to €353 million (Q3/21: €157 million) with a margin of 12.5% (Q3/21: 6.0%) mainly due to an improved receivables management in Spain. In Q1-3/22, operating cash flow decreased to €411 million (Q1-3/21: €595 million) with a margin of 4.7% (Q1-3/21: 7.4%)
For FY/22, Fresenius Helios confirms its outlook and expects organic sales3 growth in a low- to mid-single-digit percentage range and constant currency EBIT4 growth in a mid-single-digit percentage range. Both sales and EBIT outlook include expected COVID-19 effects.
1 Before special items
2 Net income attributable to shareholders of Fresenius SE & Co. KGaA
3 FY/21 base: €10,891 million
4 FY/21 base: €1,127 million, before special items, FY/22 before special items
For a detailed overview of special items please see the reconciliation tables on pages 22-25 in the PDF.
Fresenius Vamed
Fresenius Vamed manages projects and provides services for hospitals and other health care facilities worldwide and is a leading post-acute care provider in Central Europe. The portfolio ranges along the entire value chain: from project development, planning, and turnkey construction, via maintenance and technical management to total operational management.

- Service business with solid top-line performance, but higher than estimated COVID-19 impact in rehabilitation business impacts earnings
- Despite improved top-line development, macro challenges remain a headwind in the project business
- Revaluation of contractual assets in the international service and project business weighed on EBIT development
Sales increased by 11% (10% in constant currency) to €572 million (Q3/21: €516 million). Organic growth was 10%. In Q1-3/22, sales increased by 6% (6% in constant currency) to €1,647 million (Q1-3/21: €1,549 million). Organic growth was 6%.
Sales in the service business increased by 2% (1% in constant currency) to €418 million (Q3/21: €410 million) due to increasing rehabilitation treatments given fewer capacity restrictions. Sales in the project business increased by 45% (45% in constant currency) to €154 million (Q3/21: €106 million. In Q1-3/22, sales in the service business increased by 6% (5% in constant currency) to €1,240 million (Q1-3/21: €1,165 million). Sales in the project business increased by 6% (6% in constant currency) to €407 million (Q1-3/21: €384 million).
EBIT1 decreased by 57% to €10 million (Q3/21: €23 million) with an EBIT margin1 of 1.7% (Q3/21: 4.5%) driven by macroeconomic headwinds, ongoing COVID impacts, cost inflation as well as the revaluation of contractual assets in the international service and project business. In Q1-3/22, EBIT1 decreased by 17% to €29 million (Q1-3/21: €35 million) with an EBIT margin1 of 1.8% (Q1-3/21: 2.3%).
Net income1,2 decreased by 64% to €5 million (Q3/21: €14 million). In Q1-3/22, Net income1,2 decreased by 17% to €15 million (Q1-3/21: €18 million).
Order intake was €153 million (Q3/21: €120 million). In Q1-3/22 order intake was €669 million (Q1-3/21: €971 million). As of September 30, 2022, order backlog was at €3,726 million (December 31, 2021: €3,473 million).
Operating cash flow decreased to -€18 million (Q3/21: €9 million) with a margin of -3.1% (Q3/21: 1.7%), due to working capital build-ups. In Q1-3/22, operating cash flow decreased to -€56 million (Q1-3/21: €23 million) with a margin of -3.4% (Q1-3/21: 1.5%).
Fresenius Vamed adjusts its outlook for FY/22 and now expects organic sales3 to grow in a mid-single digit percentage range (previously: high-single to low-double-digit percentage range). Constant currency EBIT4 is expected to be around €100 million (previously: return to absolute pre-COVID-19 levels (FY/19: €134 million). Both sales and EBIT outlook include expected COVID-19 effects.
1 Before special items
2 Net income attributable to shareholders of VAMED AG
3 FY/21 base: €2,297 million
4 FY/21 base: €101 million, before special items; FY/22 before special items
For a detailed overview of special items please see the reconciliation tables on pages 22-25 in the PDF.
This release contains forward-looking statements that are subject to various risks and uncertainties. Future results could differ materially from those described in these forward-looking statements due to certain factors, e.g. changes in business, economic and competitive conditions, regulatory reforms, results of clinical trials, foreign exchange rate fluctuations, uncertainties in litigation or investigative proceedings, the availability of financing and unforeseen impacts of international conflicts. Fresenius does not undertake any responsibility to update the forward-looking statements in this release.
- Business development marked by significantly worsening headwinds at Fresenius Medical Care and increased macroeconomic challenges
- Fresenius Medical Care Business development impacted by unprecedented U.S. labor market situation and worsening macroeconomic environment
- Fresenius Kabi with solid organic sales growth despite tough prior-year-quarter
- Fresenius Helios with continued good admissions growth in Germany and Spain
- Fresenius Vamed still impacted by ongoing headwinds; service business supported by increasing elective treatment activity
- Cost and efficiency program evolving according to plan
- Starting date for Dr. Carla Kriwet as CEO of Fresenius Medical Care advanced to October 1, 2022
If no timeframe is specified, information refers to Q2/2022.

1 Before special items, Q1/22 restated following remeasurement Humacyte investment
2 Net income attributable to shareholders of Fresenius SE & Co. KGaA
3 Excluding Ivenix acquisition
For a detailed overview of special items please see the reconciliation tables on pages 21-24 in the PDF.
FY/22 Group guidance revised
Fresenius Medical Care’s financial performance in Q2/22 was significantly impacted by worsened labor shortages and related meaningfully increased wage inflation in the U.S. The further deterioration of the macro-economic environment resulted in accelerated non-wage inflation, particularly higher supply chain costs.
Against this backdrop and growing indications for a persistent unfavorable development of these and other factors, Fresenius Medical Care has revised its outlook for FY/22.
All other Fresenius Group segments confirm their respective outlook for FY/22 for both revenue and EBIT.
However, as a consequence of the development at Fresenius Medical Care, and despite all other Fresenius Group segments confirming their respective outlook for both revenue and EBIT, Fresenius now also revises its Group outlook for FY/22. As announced on July 27, 2022, at constant currency, the Company now anticipates Group sales1 to grow in a low-to-mid single-digit percentage range (previously: mid-single digit percentage range) and Group net income2,3 to decline in a low-to-mid single-digit percentage range (previously: increase in a low-single-digit percentage range).
Without the already closed acquisitions of Ivenix and the already completed acquisition of a majority stake in mAbxience as well as any further potential acquisitions, Fresenius expects the net debt/EBITDA4 ratio (December 31, 2021: 3.51x5) to be slightly above the top end of the self-imposed target corridor of 3.0x to 3.5x by the end of 2022.
1 FY/21 base: €37,520 million
2 Net income attributable to shareholders of Fresenius SE & Co. KGaA
3 FY/21 base: €1,867 million; before special items; FY/22: before special items
4 At LTM average exchange rates for both net debt and EBITDA; pro forma closed acquisitions/divestitures; excluding further potential acquisitions; before special items; including lease liabilities
5 At LTM average exchange rates for both net debt and EBITDA; pro forma closed acquisitions/divestitures; before special items; including lease liabilities
For a detailed overview of special items please see the reconciliation tables on pages 21-24 in the PDF.
Assumptions for guidance FY/22
Due to the meaningfully increased uncertainty and volatility related to the war in Ukraine, the ongoing impacts of the COVID-19 pandemic, and a rapidly worsening global macro-economic development, Fresenius now expects significantly more pronounced headwinds in 2022 from supply chain disruptions and cost inflation, including energy prices. Furthermore, Fresenius expects significant negative effects from ongoing labor shortages and associated wage inflation, especially at Fresenius Medical Care in the U.S.
The war in Ukraine is directly and indirectly affecting Fresenius Group operations. The direct adverse effects of the war amounted to €20 million at net income level of Fresenius Group in H1/22 and are treated as a special item. Fresenius will continue to closely monitor the potential further consequences of the war, including balance sheet valuations. The guidance does not consider a significant disruption of gas or electricity supplies in Europe.
COVID-19 will continue to impact Fresenius Group operations in 2022. An unlikely but possible significant deterioration of the situation triggering containment measures that could have a significant and direct impact on the health care sector without any appropriate compensation is not reflected in the Group’s FY/22 guidance.
Furthermore, the updated assumptions for Fresenius Medical Care's FY/22 guidance are also fully applicable to Fresenius Group's FY/22 guidance. All of these assumptions are subject to considerable uncertainty. The acquisitions of Ivenix and of the majority stake in mAbxience as well as any further potential acquisitions remain excluded from guidance.
Group medium-term targets
As a result of the updated expectations for FY/22, Fresenius now believes its medium-term net income1 target is no longer achievable. Fresenius had expected Group organic net income1 growth to be at the bottom end of the 5% to 9% compounded annual growth rate (CAGR) range for 2020 to 2023. At the same time, Fresenius specifies its Group organic sales growth target to reach the low-end of the targeted 4% to 7% compounded annual growth rate (CAGR) range for 2020 to 2023.
1 Net income attributable to shareholders of Fresenius SE & Co. KGaA
Cost and efficiency program
The Group’s cost and efficiency program is running according to plan and Fresenius confirms its increased savings targets provided in February 2022 of at least €150 million p.a. after tax and minority interest in 2023. For the years thereafter, a further significant increase in sustainable cost savings is expected.
Management Board change at Fresenius Medical Care
Dr. Carla Kriwet will now join Fresenius Medical Care as CEO on October 1, 2022, earlier than previously announced and Rice Powell will step down as CEO effective September 30, 2022.
3% sales increase in constant currency
Group sales increased by 8% (3% in constant currency) to €10,018 million (Q2/21: €9,246 million). Organic growth was 2%. Acquisitions/divestitures contributed net 1% to growth. Currency translation increased sales growth by 5%. Excluding estimated COVID-19 effects , Group sales growth would have been 2% to 3% in constant currency (Q2/21: 6% to 7%).
In H1/22, Group sales increased by 8% (4% in constant currency) to €19,738 million (H1/21: €18,230 million). Organic growth was 3%. Acquisitions/divestitures contributed net 1% to growth. Currency translation increased sales growth by 4%. Excluding estimated COVID-19 effects1, Group sales growth would have been 4% to 5% in constant currency (H1/21: 5% to 6%).
9% net income2,3,4 decline in constant currency
Group EBITDA before special items remained stable (-6% in constant currency) at €1,682 million (Q2/212: €1,674 million). Reported Group EBITDA was €1,528 million (Q2/21: €1,662 million).
In H1/22, Group EBITDA before special items increased by 1% (-4% in constant currency) to €3,344 million (H1/212: €3,305 million). Reported Group EBITDA was €3,123 million (H1/21: €3,290 million).
Group EBIT before special items decreased by 3% (-9% in constant currency) to €1,003 million (Q2/212: €1,033 million). The decrease was mainly driven by worsened labor shortages and related meaningfully increased wage inflation at Fresenius Medical Care in the U.S. as well as elevated material and logistic costs. The EBIT margin before special items was 10.0% (Q2/212: 11.2%). Reported Group EBIT was €845 million (Q2/21: €1,021 million).
In H1/22, Group EBIT before special items decreased by 2% (-7% in constant currency) to €2,003 million (H1/212: €2,042 million). The EBIT margin before special items was 10.1% (H1/212: 11.2%). Reported Group EBIT was €1,747 million (H1/21: €2,027 million).
1 For estimated COVID-19 effects please see table on page 19.
2 Before special items
3 Net income attributable to shareholders of Fresenius SE & Co. KGaA
4 Excluding Ivenix acquisition
For a detailed overview of special items please see the reconciliation tables on pages 21-24 in the PDF.
Group net interest before special items improved to -€116 million (Q2/21: -€121 million) mainly due to positive one-time effects despite an increased interest rate environment. Reported Group net interest also improved to -€116 million (Q2/21: -€121 million). In H1/22, Group net interest before special items improved to -€235 million (H1/211: -€258 million). Reported Group net interest also improved to -€234 million (H1/21: -€258 million).
Group tax rate before special items was 23.0% (Q2/211: 21.5%) while the reported Group tax rate was 22.6% (Q2/21: 21.3%). In H1/22, Group tax rate before special items was 22.9% (H1/211: 22.1%) while the reported Group tax rate was 23.1% (H1/2021: 22.0%).
Noncontrolling interests before special items were -€233 million (Q2/211: -€241 million) of which 90% were attributable to the noncontrolling interests in Fresenius Medical Care. Reported noncontrolling interests were -€181 million (Q2/21: -€237 million). In H1/22, Noncontrolling interests before special items were -€451 million (H1/211: -€478 million) of which 89% were attributable to the noncontrolling interests in Fresenius Medical Care. Reported noncontrolling interests were -€367 million (H1/21: -€473 million).
Group net income2 before special items decreased by 5% (-9%3 in constant currency) to €450 million (Q2/211: €475 million). The decrease was mainly driven by worsened labor shortages and related meaningfully increased wage inflation at Fresenius Medical Care in the U.S. as well as elevated material and logistic costs. Excluding estimated COVID-19 effects4, Group net income2 before special items was -16% to -12% in constant currency (Q2/21: 10% to 14%). Reported Group net income2 decreased to €383 million (Q2/21: €471 million).
In H1/22, Group net income2 before special items remained stable (-3%3 in constant currency) at €913 million (H1/211: €911 million). Excluding estimated COVID-19 effects4, Group net income2 before special items was -10% to -6% in constant currency (H1/21: 4% to 8%). Reported Group net income2 decreased to €796 million (H1/21: €906 million).
1 Before special items
2 Net income attributable to shareholders of Fresenius SE & Co. KGaA
3 Excluding Ivenix acquisition
4 For estimated COVID-19 effects please see table on page 19
For a detailed overview of special items please see the reconciliation tables on pages 21-24 in the PDF.
Earnings per share1 before special items decreased by 6% (-11% in constant currency) to €0.80 (Q2/21 : €0.85). Reported earnings per share1 were €0.68 (Q2/21: €0.84). In H1/22, earnings per share1 before special items remained stable (-4% in constant currency) at €1.63 (H1/212: €1.63). Reported earnings per share1 were €1.42 (H1/21: €1.62).
Continued investment in growth
Spending on property, plant and equipment was €419 million corresponding to 4% of sales (Q2/21: €509 million; 6% of sales). These investments served primarily for the modernization and expansion of dialysis clinics, production facilities as well as hospitals and day clinics. In H1/22, spending on property, plant and equipment was €757 million corresponding to 4% of sales (H1/21: €893 million; 5% of sales).
Total acquisition spending was €291 million (Q2/21: €491 million), mainly for the acquisition of Ivenix by Fresenius Kabi and dialysis clinics at Fresenius Medical Care. In H1/22, total acquisition spending was €453 million (H1/21: €640 million).
Cash flow development
Group operating cash flow decreased to €1,017 million (Q2/21: €1,451 million) with a margin of 10.2% (Q2/21: 15.7%), mainly driven by working capital build-up from higher raw material inventories and receivables, among others, as well as phasing effects. Free cash flow before acquisitions and dividends decreased to €581 million (Q2/21: €952 million). Free cash flow after acquisitions and dividends decreased to -€391 million (Q2/21: -€359 million).
In H1/22, Group operating cash flow decreased to €1,118 million (H1/21: €2,103 million) with a margin of 5.7% (H1/21: 11.5%). Free cash flow before acquisitions and dividends decreased to €326 million (H1/21: €1,193 million). Free cash flow after acquisitions and dividends decreased to -€794 million (H1/21: -€242 million).
1 Net income attributable to shareholders of Fresenius SE & Co. KGaA
2 Before special itemsFor a detailed overview of special items please see the reconciliation tables on pages 21-24 in the PDF.
Solid balance sheet structure
Group total assets increased by 6% (1% in constant currency) to €76,112 million (Dec. 31, 2021: €71,962 million) given currency translation effects and the expansion of business activities. Current assets increased by 8% (4% in constant currency) to €18,818 million (Dec. 31, 2021: €17,461 million), mainly driven by the increase of trade accounts receivables. Non-current assets increased by 5% (1% in constant currency) to €57,294 million (Dec. 31, 2021: €54,501 million).
Total shareholders’ equity increased by 9% (3% in constant currency) to €32,033 million (Dec. 31, 2021: €29,288 million). The equity ratio was 42.1% (Dec. 31, 2021: 40.7%).
Group debt increased by 4% (2% in constant currency) at €28,368 million (Dec. 31, 2021: € 27,155 million). Group net debt increased by 8% (5% in constant currency) to € 26,239 million (Dec. 31, 2021: € 24,391 million).
As of June 30, 2022, the net debt/EBITDA ratio increased to 3.72x1,2 (Dec. 31, 2021: 3.51x1,2) mainly driven by dividend payments, lower EBITDA contribution as well as acquisition spending. The net debt/EBITDA as of June 30, 2022 excluding the already closed acquisition of Ivenix was 3.681,2.
1 At LTM average exchange rates for both net debt and EBITDA; pro forma closed acquisitions/divestitures
2 Before special items
For a detailed overview of special items please see the reconciliation tables on pages 21-24 in the PDF.
Business Segments
Fresenius Medical Care (Financial data according to Fresenius Medical Care press release)
Fresenius Medical Care is the world's largest provider of products and services for individuals with renal diseases. As of June 30, 2022, Fresenius Medical Care was treating 345,687 patients in 4,163 dialysis clinics. Along with its core business, the Renal Care Continuum, the company focuses on expanding in complementary areas and in the field of critical care.

- Business development impacted by unprecedented U.S. labor market situation and worsening macroeconomic environment driving cost inflation and supply chain disruptions
- Meaningful decline in COVID-19-related excess mortality
- Solid support by positive exchange rates
Sales increased by 10% (1% in constant currency) to €4,757 million (Q2/21: €4,320 million). Organic growth was 0%. Currency translation increased sales growth by 9%. In H1/22, sales increased by 9% (2% in constant currency) to €9,305 million (H1/21: €8,530 million). Organic growth was 1%. Currency translation increased sales growth by 7%.
EBIT decreased by 20% (-27% in constant currency) to €341 million (Q2/21: €424 million) resulting in a margin of 7.2% (Q2/21: 9.8%). EBIT before special items, i.e., costs incurred for FME25, the impacts related to the war in Ukraine, the impact of hyperinflation in Turkey and the remeasurement effect on the fair value of the investment in Humacyte, Inc. increased by 3% (-6% in constant currency) to €445 million (Q2/21: €433 million), resulting in a margin1 of 9.4% (Q2/21: 10.0%). At constant currency, the decline was mainly due to higher labor costs as well as inflationary and supply chain cost increases. This was partially offset by Provider Relief Funding received from the U.S. government to compensate for certain COVID-19-related costs.
1 Before special items
2 Net income attributable to shareholders of Fresenius Medical Care AG & Co. KGaA
For a detailed overview of special items please see the reconciliation tables on pages 21-24 in the PDF.
In H1/22, EBIT decreased by 23% (-29% in constant currency) to €688 million (H1/21: €898 million) resulting in a margin of 7.4% (H1/21: 10.5%). EBIT before special items decreased by 6% (-13% in constant currency) to €852 million (H1/21: €910 million), resulting in a margin of 9.2% (H1/21: 10.7%).
Net income2 decreased by 33% (-39% in constant currency) to €147 million (Q2/21: €219 million). Net income2 before special items remained stable (-7% in constant currency) at €225 million (Q2/21: €225 million) mainly due to the mentioned negative effects on operating income.
In H1/22, net income2 decreased by 35% (-39% in constant currency) to €305 million (H1/21: €468 million). Net income2 before special items decreased by 10%
(-15% in constant currency) to €428 million (H1/21: €476 million).
Operating cash flow was €751 million (Q2/21: €921 million) with a margin of 15.8% (Q2/21: 21.3%). The decrease was mainly due to an unfavorable development of days sales outstanding as well as a decrease in net income2, partially offset by U.S. government relief funding. In H1/22, operating cash flow was €910 million (H1/21: €1,129 million) with a margin of 9.8% (H1/21: 13.2%).
As announced on July 27, 2022, Fresenius Medical Care expects revenue to grow at a low single digit percentage rate and net income2, to decline at around a high teens percentage range. Revenue and net income guidance are both on a constant currency basis and before special items .
Given the uncertain labor situation and macro-economic inflationary environment and the substantially reduced earnings base compared to 2020, Fresenius Medical Care does not expect today to be able to achieve the meaningfully higher compounded annual average increases that would now be needed to accomplish its 2025 targets. Against this background, Fresenius Medical Care has cut its financial targets for FY 2022 and withdrawn its 2025 targets.
For further information, please see Fresenius Medical Care’s press release at www.freseniusmedicalcare.com.
1 Before special items
2 Net income attributable to shareholders of Fresenius Medical Care AG & Co. KGaA
3 FY/21 base: €17,619 million
4 FY/21 base: €1,018 million, before special items; FY/22 before special items
5 These targets are based on the 2021 results excluding the costs related to FME25 of EUR 49 million (for Net Income). They are in constant currency and exclude special items. Special items include further costs related to FME25, the impact of the War in Ukraine, the impact of Hyperinflation in Turkey, the Humacyte investment remeasurement and other effects that are unusual in nature and have not been foreseeable or not foreseeable in size or impact at the time of giving guidance.
For a detailed overview of special items please see the reconciliation tables on pages 21-24 in the PDF.
Fresenius Kabi
Fresenius Kabi offers intravenously administered generic drugs, clinical nutrition and infusion therapies for seriously and chronically ill patients in the hospital and outpatient environments. The company is also a leading supplier of medical devices and transfusion technology products. In the biosimilars business, Fresenius Kabi develops products with a focus on oncology and autoimmune diseases.

- North America with solid organic sales growth despite macroeconomic headwinds
- Asia-Pacific impacted by price pressure from NVBP tenders in China
- Biosimilars business progressing well; completing acquisition of majority stake in mAbxience
Sales increased by 8% (2% in constant currency) to €1,896 million (Q2/21: €1,755 million). Organic growth was 2%. In H1/22, sales increased by 6% (1% in constant currency) to €3,743 million (H1/21: €3,516 million). Organic growth was 1%. Positive currency translation effects of 6% in Q2/22 and 5% in H1/22 were mainly related to the U.S. dollar and Chinese yuan.
Sales in North America increased by 16% (organic growth: 3%) to €606 million (Q2/21: €522 million). The significant sales growth was mainly driven by positive currency effects while organic growth continued to be impacted a high level of COVID-related absenteeism of production staff, ongoing competitive pressure and supply chain challenges. In H1/22, sales in North America increased by 10% (organic growth: 0%) to €1,185 million (H1/21: €1,080 million).
Sales in Europe increased by 4% (organic growth: 4%) to €658 million (Q2/21: €634 million) driven by a broad-based positive development and biosimilars. In H1/22, sales in Europe increased by 3% (organic growth: 3%) to €1,298 million (H1/21: €1,260 million).
1 Before special items
2 Net income attributable to shareholders of Fresenius SE & Co. KGaA
3 Excluding Ivenix acquisition
For a detailed overview of special items please see the reconciliation tables on pages 21-24 in the PDF.
Sales in Asia-Pacific increased by 4% (organic growth: -4%) to €425 million (Q2/21: €409 million). Organic growth was primarily affected by price pressure from the NVBP (National Volume-Based Procurement) tenders in China while Asia-Pacific ex China showed healthy underlying growth. In H1/22, sales in Asia-Pacific increased by 7% (organic growth: -1%) to €858 million (H1/21: €801 million).
Sales in Latin America/Africa increased by 9% (organic growth: 2%) to €207 million (Q2/21: €190 million), over a high prior-year COVID-19-related base. In H1/22, sales in Latin America/Africa increased by 7% (organic growth: 2%) to €402 million (H1/21: €375 million).
Sales in the Biosimilars business was €29 million. In H1/22, sales in the Biosimilars business was €52 million, consistent with Fresenius Kabi’s expectations. The U.S. Food and Drug Administration (FDA) has accepted for review Fresenius Kabi's Biologics License Application (BLA) for MSB11456, a biosimilar candidate of Actemra®4 (tocilizumab). Moreover, Fresenius Kabi closed the majority stake acquisition of mAbxience Holding S.L., a leading international biopharmaceutical company. The transaction was announced in March 2022. The acquisition significantly strengthens Fresenius Kabi’s footprint in the biopharmaceuticals space. The purchase price will be a combination of c. €495 million upfront payment and milestone payments, strictly tied to the achievement of commercial and development targets.
EBIT1 decreased by 9% (-15% in constant currency) to €271 million (Q2/21: €298 million) with an EBIT margin1 of 14.3% (Q2/21: 17.0%). Ongoing competitive pressure, staff shortages, supply chain challenges as well as accelerated input cost inflation weighed on the financial performance. In H1/22, EBIT1 decreased by 2% (-8%2 in constant currency) to €564 million (H1/21: €574 million) with an EBIT margin1 of 15.1% (H1/21: 16.3%).
Net income1,3 decreased by 7% (-16% in constant currency) to €189 million (Q2/21: €204 million). In H1/22, net income1,3 decreased by 1% (-8% in constant currency) to €390 million (H1/21: €394 million).
Operating cash flow decreased to €109 million (Q2/21: €197 million) with a margin of 5.7% (Q2/21: 11.2%), mainly driven by a working capital build-up from e.g. higher raw material inventories. In H1/22, operating cash flow decreased to €242 million (H1/21: €475 million) with a margin of 6.5% (H1/21: 13.5%).
1 Before special items
2 Excluding Ivenix acquisition
3 Net income attributable to shareholders of Fresenius SE & Co. KGaA
4 Actemra® is a registered trademark of Chugai Seiyaku Kabushiki Kaisha Corp., a member of the Roche Group
For a detailed overview of special items please see the reconciliation tables on pages 21-24 in the PDF.
For FY/22, Fresenius Kabi confirms its outlook and expects organic sales1 growth in a low-single-digit percentage range. Constant currency EBIT2 is expected to decline in a high-single- to low-double-digit percentage range. Both sales and EBIT outlook include expected COVID-19 effects. The financial effects from the acquisitions of Ivenix and the majority stake in mAbxience remain excluded from guidance.
Save the date: Fresenius will host a virtual Meet the Management event on its business segment Fresenius Kabi on Friday, October 7, 2022 (virtual event).
1 FY/21 base: €7,193 million
2 FY/21 base: €1,153 million, before special items, FY/22 before special items
For a detailed overview of special items please see the reconciliation tables on pages 21-24 in the PDF.
Fresenius Helios
Fresenius Helios is Europe's leading private hospital operator. The company comprises Helios Germany, Helios Spain and Helios Fertility. Helios Germany operates 87 hospitals, ~130 outpatient centers and 6 prevention centers. Helios Spain operates 50 hospitals, 97 outpatient centers and around 300 occupational risk prevention centers. In addition, the company is active in Latin America with 8 hospitals and as a provider of medical diagnostics. Helios Fertility offers a wide spectrum of state-of-the-art services in the field of fertility treatments.

- Fresenius Helios with solid organic growth in Germany and Spain based on increased number of admissions
- Helios Fertility with solid financial performance
Sales increased by 7% (6% in constant currency) to €2,925 million (Q2/21: €2,738 million). Organic growth was 5%. Acquisitions, mainly at Helios Fertility, contributed 1% to sales growth. In H1/22, sales increased by 9% (8% in constant currency) to €5,856 million (H1/21: €5,387 million). Organic growth was 6%. Acquisitions contributed 2% to sales growth.
Sales of Helios Germany increased by 5% (organic growth: 4%) to €1,758 million (Q2/21: €1,675 million), mainly driven by increasing admissions, which are however still below pre-pandemic levels. Acquisitions contributed 1% to sales growth. In H1/22, sales of Helios Germany increased by 6% (organic growth: 5%) to €3,541 million (H1/21: €3,348 million). Acquisitions contributed 1% to sales growth.
Sales of Helios Spain increased by 8% (7% in constant currency) to €1,101 million (Q2/21: €1,020 million). Organic growth of 6% was driven by consistently high activity levels. The hospitals in Latin America also contributed to sales growth. Acquisitions contributed 2% to sales growth. In H1/22, sales of Helios Spain increased by 10% (9% in constant currency) to €2,190 million (H1/21: €1,996 million). Organic growth was 9%.
Sales of the Helios Fertility were €65 million (Q2/21: €42 million). In H1/22, sales of the Helios Fertility were €122 million.
1 Before special items
2 Net income attributable to shareholders of Fresenius SE & Co. KGaA
For a detailed overview of special items please see the reconciliation tables on pages 21-24 in the PDF.
EBIT1 increased by 2% (1% in constant currency) to €303 million (Q2/21: €298 million) with an EBIT margin1 of 10.4% (Q2/21: 10.9%). In H1/22, EBIT1 increased by 8% (7% in constant currency) to €609 million (H1/21: €566 million) with an EBIT margin1 of 10.4% (H1/21: 10.5%).
EBIT1 of Helios Germany increased by 1% to €154 million (Q2/21: €152 million) with an EBIT margin1 of 8.8% (Q2/21: 9.1%). COVID-related elevated staff absenteeism weighed on profitability. Inflationary effects had only a small negative impact. In H1/22, EBIT1 of Helios Germany increased by 2% to €308 million (H1/21: €302 million) with an EBIT margin1 of 8.7% (H1/21: 9.0%).
EBIT1 of Helios Spain increased by 1% (0% in constant currency) to €148 million (Q2/21: €147 million) due to an extraordinary high prior-year quarter comp. The Latin American business also showed a good performance. The EBIT margin1 was 13.4% (Q2/21: 14.4%). In H1/22, EBIT1 of Helios Spain increased by 10% (10% in constant currency) to €301 million (H1/21: €273 million). The EBIT margin1 was 13.7% (H1/21: 13.7%).
EBIT1 of Helios Fertility was €7 million with an EBIT margin1 of 10.8% (Q2/21: €5 million). In H1/22, EBIT1 of Helios Fertility was €11 million with an EBIT margin1 of 9.0%.
Net income1,2 increased by 2% (2% in constant currency) to €197 million (Q2/21: €193 million). In H1/22, net income1,2 increased by 7% (7% in constant currency) to €392 million (H1/21: €366 million).
Operating cash flow decreased to €194 million (Q2/21: €223 million) with a margin of 6.6% (Q2/21: 8.1%) following COVID-19-related delays in budget negotiations in Germany. In H1/22, operating cash flow decreased to €58 million (H1/21: €438 million) with a margin of 1.0% (H1/21: 8.1%)
For FY/22, Fresenius Helios confirms its outlook and expects organic sales3 growth in a low- to mid-single-digit percentage range and constant currency EBIT4 growth in a mid-single-digit percentage range. Both sales and EBIT outlook include expected COVID-19 effects.
1 Before special items
2 Net income attributable to shareholders of Fresenius SE & Co. KGaA
3 FY/21 base: €10,891 million
4 FY/21 base: €1,127 million, before special items, FY/22 before special items
For a detailed overview of special items please see the reconciliation tables on pages 21-24 in the PDF.
Fresenius Vamed
Fresenius Vamed manages projects and provides services for hospitals and other health care facilities worldwide and is a leading post-acute care provider in Central Europe. The portfolio ranges along the entire value chain: from project development, planning, and turnkey construction, via maintenance and technical management to total operational management.

• Project business still marked by the Ukraine war and COVID-19-related headwinds in project execution as well as global supply chain challenges and cost inflation
• Service business supported by increasing elective treatment activity
• Order backlog at all-time high
Sales increased by 1% (1% in constant currency) to €562 million (Q2/21: €556 million). Organic growth was 1%. In H1/22, sales increased by 4% (3% in constant currency) to €1,075 million (H1/21: €1,033 million). Organic growth was 4%.
Sales in the service business increased by 6% (6% in constant currency) to €417 million (Q2/21: €392 million) due to recovering elective treatments. Sales in the project business decreased by 12% (-12% in constant currency) to €145 million (Q2/21: €164 million),
driven by the Ukraine war and COVID-19-related headwinds as well as global supply chain challenges. In H1/22, sales in the service business increased by 9% (8% in constant currency) to €822 million (H1/21: €755 million). Sales in the project business decreased by 9% (-9% in constant currency) to €253 million (H1/21: €278 million).
EBIT1 decreased by 31% to €11 million (Q2/21: €16 million) with an EBIT margin1 of 2.0% (Q2/21: 2.9%) driven by the Ukraine war and COVID-19-related headwinds as well as global supply chain challenges. In H1/22, EBIT1 increased by 58% to €19 million (H1/21: €12 million) with an EBIT margin1 of 1.8% (H1/21: 1.2%).
1 Before special items
2 Net income attributable to shareholders of VAMED AG
For a detailed overview of special items please see the reconciliation tables on pages 21-24 in the PDF.
Net income1,2 decreased by 45% to €6 million (Q2/21: €11 million). In H1/22, Net income1,2 increased to €10 million (H1/21: €4 million).
Order intake was €253 million (Q2/21: €713 million). In H1/22 order intake was €516 million (H1/21: €851 million). As of June 30, 2022, order backlog was at €3,732 million (December 31, 2021: €3,473 million).
Operating cash flow decreased to €7 million (Q2/21: €58 million) with a margin of 1.2% (Q2/21: 10.4%), due to phasing effects and COVID-19-related delays in the project business as well as some working capital build-ups. In H1/22, operating cash flow decreased to -€38 million (H1/21: €14 million) with a margin of -3.5% (H1/21: 1.4%).
For FY/22, Fresenius Vamed confirms its outlook and expects organic sales3 growth in a high-single to low-double-digit percentage range and constant currency EBIT4 to return to absolute pre-COVID-19 levels (FY/19: €134 million). Both sales and EBIT outlook include expected COVID-19 effects.
1 Before special items
2 Net income attributable to shareholders of VAMED AG
3 FY/21 base: €2,297 million
4 FY/21 base: €101 million, before special items; FY/22 before special items
For a detailed overview of special items please see the reconciliation tables on pages 21-24 in the PDF.
This release contains forward-looking statements that are subject to various risks and uncertainties. Future results could differ materially from those described in these forward-looking statements due to certain factors, e.g. changes in business, economic and competitive conditions, regulatory reforms, results of clinical trials, foreign exchange rate fluctuations, uncertainties in litigation or investigative proceedings, the availability of financing and unforeseen impacts of international conflicts. Fresenius does not undertake any responsibility to update the forward-looking statements in this release.
Fresenius Medical Care’s financial performance in Q2/22 was significantly impacted by worsened labor shortages and related meaningfully increased wage inflation in the U.S. The further deterioration of the macro-economic environment resulted in accelerated non-wage inflation, particularly higher supply chain costs.
Against this backdrop and growing indications for a persistent unfavorable development of these and other factors, Fresenius Medical Care has revised its outlook for FY/22.
All other Fresenius Group segments confirm their respective outlook for FY/22 for both revenue and EBIT.
However, as a consequence of the development at Fresenius Medical Care, and despite all other Fresenius Group segments confirming their respective outlook for both revenue and EBIT, Fresenius now also revises its Group outlook for FY/22. At constant currency, the Company now anticipates Group sales1 to grow in a low-to-mid single-digit percentage range (previously: mid-single digit percentage range) and Group net income2,3 to decline in a low-to-mid single-digit percentage range (previously: increase in a low-single-digit percentage range).
1 FY/21 base: €37,520 million
2 Net income attributable to shareholders of Fresenius SE & Co. KGaA
3 FY/21 base: €1,867 million; before special items; FY/22: before special items
Stephan Sturm, CEO of Fresenius, said: “As a globally active healthcare group, we, too, have inevitably been impacted by – in many cases massive – cost increases, growing problems in the global supply chains, and staff shortages. And unlike companies in other industries, we cannot simply pass on the resulting cost burdens in the short term by raising our prices. To the extent possible and foreseeable, we factored these burdens into the guidance we provided in February and May. In the meantime, though, it has become apparent that patient-facing healthcare services in the United States are affected even more heavily, hence also Fresenius Medical Care. It will take fortitude and energy to overcome this particularly challenging phase, and I am therefore very pleased that Carla Kriwet will assume her new position as CEO of Fresenius Medical Care quite a bit earlier than initially planned. I am confident that, together with her colleagues, she will find the right solutions and lead Fresenius Medical Care into a successful future.”
“Our goal at Fresenius is, and remains, to create more value: for our patients, our employees and our shareholders,” added Sturm. “We are working tirelessly, guided by our clear strategic priorities, to achieve this. And we continue to see good prospects, despite the current burdens and difficulties resulting from global crises. Not least because, from our strong market positions, we moved early to capitalize on the right trends, such as home dialysis. Healthcare is a market of the future that we want to play an important role in shaping, and where we intend to continue our sustained, profitable growth.”
Assumptions for guidance FY/22
Due to the meaningfully increased uncertainty and volatility related to the war in Ukraine, the ongoing impacts of the COVID-19 pandemic, and a rapidly worsening global macro-economic development, Fresenius now expects significantly more pronounced headwinds in 2022 from supply chain disruptions and cost inflation, including energy prices. Furthermore, Fresenius expects significant negative effects from ongoing labor shortages and associated wage inflation, especially at Fresenius Medical Care in the U.S.
The war in Ukraine is directly and indirectly affecting Fresenius Group operations. The direct adverse effects of the war amounted to €20 million at net income1 level of Fresenius Group in H1/22 and are treated as a special item. Fresenius will continue to closely monitor the potential further consequences of the war, including balance sheet valuations. The guidance does not consider a significant disruption of gas or electricity supplies in Europe.
COVID-19 will continue to impact Fresenius Group operations in 2022. An unlikely but possible significant deterioration of the situation triggering containment measures that could have a significant and direct impact on the health care sector without any appropriate compensation is not reflected in the Group’s FY/22 guidance.
Furthermore, the updated assumptions for Fresenius Medical Care's FY/22 guidance are also fully applicable to Fresenius Group's FY/22 guidance. All of these assumptions are subject to considerable uncertainty. The acquisition of Ivenix and the announced acquisition of the majority stake in mAbxience as well as any further potential acquisitions remain excluded from guidance.
1 Net income attributable to shareholders of Fresenius SE & Co. KGaA
Group medium-term targets
As a result of the updated expectations for FY/22, Fresenius now believes its medium-term net income1 target is no longer achievable. Fresenius had expected Group organic net income1 growth to be at the bottom end of the 5% to 9% compounded annual growth rate (CAGR) range for 2020 to 2023. At the same time, Fresenius specifies its Group organic sales growth target to reach the low-end of the targeted 4% to 7% compounded annual growth rate (CAGR) range for 2020 to 2023.
Cost and efficiency program
The Group’s cost and efficiency program is running according to plan and Fresenius confirms its increased savings targets provided in February 2022 of at least €150 million p.a. after tax and minority interest in 2023. For the years thereafter, a further significant increase in sustainable cost savings is expected.
Management Board change at Fresenius Medical Care
Dr. Carla Kriwet will now join Fresenius Medical Care as CEO on October 1, 2022, earlier than previously announced and Rice Powell will step down as CEO effective September 30, 2022.
Preliminary Q2 and H1/22 results2

1 Net income attributable to shareholders of Fresenius SE & Co. KGaA
2 EBIT and net income before special items
3 Excluding Ivenix acquisition
Fresenius Kabi preliminary financial results
Sales in Q2/22 increased by 8% (2% in constant currency) to €1,896 million (Q2/21: €1,755 million). Organic growth was 2%. The positive currency translation effects of 6% in Q2/22 were mainly related to the U.S. dollar and Chinese yuan.
Sales in North America increased by 16% (organic growth: 3%) to €606 million (Q2/21: €522 million), strongly supported by U.S. Dollar-related currency translation effects. Sales in Europe increased by 4% (organic growth: 4%) to €658 million (Q2/21: €634 million). Sales in Asia-Pacific increased by 4% (organic growth: -4%) to €425 million (Q2/21: €409 million). Positive currency translation effects contributed to reported sales growth. Sales in Latin America/Africa increased by 9% (organic growth: 2%) to €207 million (Q2/21: €190 million). Sales for the Biosimilars business were €29 million.
EBIT1 decreased by 9% (-15%2 in constant currency) to €271 million (Q2/21: €298 million). The EBIT margin1 was 14.3% (Q2/21: 17.0%).
Fresenius Kabi EBIT by region

Fresenius Kabi confirms its FY/22 outlook and expects organic sales3 growth in a low-single-digit percentage range. Constant currency EBIT2,4 is expected to decline in a high-single- to low-double-digit percentage range. The sales and EBIT outlook ranges include expected COVID-19 effects and exclude the effects of the acquisitions Ivenix and mAbxience.
1 Before special items
2 Excluding Ivenix acquisition
3 FY/21 base: €7,193 million
4 FY/21 base: €1,153 million, before special items, FY/22 before special items
Fresenius Helios preliminary financial results
Sales increased by 7% (6% in constant currency) to €2,925 million (Q2/21: €2,738 million). Organic growth was 5%. Acquisitions contributed 1% to sales growth.
Sales of Helios Germany increased by 5% (organic growth: 4%) to €1,758 million (Q2/21: €1,675 million). Sales of Helios Spain increased by 8% (7% in constant currency) to €1,101 million (Q2/21: €1,020 million). Organic growth was 6%. Sales of Helios Fertility were €65 million (Q2/21: €42 million).
EBIT1 of Fresenius Helios increased by 2% (1% in constant currency) to €303 million (Q2/21: €298 million) with an EBIT margin1 of 10.4% (Q2/21: 10.9%).
EBIT of Helios Germany increased by 1% to €154 million (Q2/21: €152 million) with an EBIT margin of 8.8% (Q2/21: 9.1%). EBIT of Helios Spain increased by 1% (0% in constant currency) to €148 million (Q2/21: €147 million). The EBIT margin was 13.4% (Q2/21: 14.4%). EBIT1 of Helios Fertility was €7 million with an EBIT1 margin of 10.8% (Q2/21: €5 million).
Fresenius Helios confirms its FY/22 outlook and expects organic sales2 growth in a low- to mid-single-digit percentage range and constant currency EBIT3 growth in a mid-single-digit percentage range. The sales and EBIT outlook ranges include expected COVID-19 effects.
Fresenius Vamed preliminary financial results
Sales increased by 1% (1% in constant currency) to €562 million (Q2/21: €556 million). Organic growth was 1%.
Sales in the service business increased by 6% (6% in constant currency) to €417 million (Q2/21: €392 million). Sales in the project business decreased by 12% (-12% in constant currency) to €145 million (Q2/21: €164 million).
EBIT1 decreased by 31% to €11 million (Q2/21: €16 million) with an EBIT margin1 of 2.0% (Q2/21: 2.9%).
Order intake was €253 million (Q2/21: €713 million). As of June 30, 2022, order backlog was at €3,732 million (December 31, 2021: €3,473 million).
Fresenius Vamed confirms its FY/22 outlook and expects organic sales4 growth in a high-single to low-double-digit percentage range and constant currency EBIT5 to return to absolute pre-COVID-19 levels (FY/19: €134 million). The sales and EBIT outlook ranges include expected COVID-19 effects.
1 Before special items
2 FY/21 base: €10,891 million
3 FY/21 base: €1,127 million, before special items, FY/22 before special items
4 FY/21 base: €2,297 million
5 FY/21 base: €101 million, before special items; FY/22 before special items
Detailed financial results publication and Conference Call
As part of the publication of the preliminary results for Q2/2022, a conference call will be held on July 28, 2022 at 1:30 p.m. CEDT (7:30 a.m. EDT) replacing the originally planned call from August 2, 2022.
All investors are cordially invited to follow the conference call in a live broadcast over the Internet at www.fresenius.com/investors. Following the call, a replay will be available on our website.
On August 2, 2022, Fresenius will publish detailed Q2/22 and H1/22 financials.
This release contains forward-looking statements that are subject to various risks and uncertainties. Future results could differ materially from those described in these forward-looking statements due to certain factors, e.g. changes in business, economic and competitive conditions, regulatory reforms, results of clinical trials, foreign exchange rate fluctuations, uncertainties in litigation or investigative proceedings, the availability of financing and unforeseen impacts of international conflicts. Fresenius does not undertake any responsibility to update the forward-looking statements in this release.
• Fresenius Medical Care in line with its expectations countering significant headwinds
• Fresenius Kabi’s solid financial performance based on strong Emerging Markets growth
• Fresenius Helios’ strong performance driven by growing admissions in Germany and Spain
• Fresenius Vamed with continued progress towards normal operations, very good performance in the service business
• Ongoing headwinds from cost inflation and supply chain challenges, with uncertainty and volatility fueled by the Ukraine war
• Guidance for 2022 confirmed
• Fresenius appoints Sara Hennicken as Chief Financial Officer – Rachel Empey to leave company at own request1
• Dr. Carla Kriwet to succeed Rice Powell on January 1, 2023, as Chief Executive Officer of Fresenius Medical Care and member of the Fresenius Management Board1
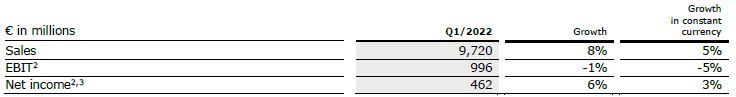
1 Please see separate Fresenius and Fresenius Medical Care press releases
2 Before special items
3 Net income attributable to shareholders of Fresenius SE & Co. KGaA
For a detailed overview of special items please see the reconciliation tables on pages 18-19 in the PDF.
Stephan Sturm, CEO of Fresenius, said: “We have made a solid start into 2022 – somewhat better, even, than expected at Fresenius Helios and Fresenius Kabi. The first quarter was burdened by the ongoing coronavirus pandemic, the war in Ukraine, supply chain bottlenecks and, above all, cost increases that are in some cases significant. We will have to watch all these factors very closely. Still, our businesses developed well. With the announced transactions at Fresenius Kabi and Fresenius Medical Care we’ve taken important steps in the realization of our growth strategy, thereby improving the foundations for our future business success. We therefore continue to expect overall healthy sales and earnings growth, and to look ahead with confidence to the rest of our business year and beyond.”
FY/22 Group guidance confirmed
For FY/22, Fresenius confirms its guidance and projects sales growth1 in a mid-single-digit percentage range in constant currency. Net income2,3 is expected to grow in a low-single-digit percentage range in constant currency. Implicitly, net income2 for the Group excluding Fresenius Medical Care is also expected to grow in a low-single-digit percentage range in constant currency.
Without further acquisitions4, Fresenius projects an improvement of the net debt/EBITDA5 ratio (December 31, 2021: 3.51x6) into the self-imposed target corridor of 3.0x to 3.5x by the end of 2022. Fresenius expects the net debt/EBITDA ratio to slightly increase once the acquisitions of Ivenix and the majority stake in mAbxience are closed.
The Group’s cost and efficiency program is evolving according to plan and Fresenius confirms its increased savings targets provided in February 2022 of at least €150 million p.a. after tax and minority interest in 2023. For the years thereafter, a further significant increase in sustainable cost savings is expected.
1 FY/21 base: €37,520 million
2 Net income attributable to shareholders of Fresenius SE & Co. KGaA
3 FY/21 base: €1,867 million; before special items; FY/22: before special items
4 Cut-off date 22 February 2022
5 At LTM average exchange rates for both net debt and EBITDA; pro forma closed acquisitions/divestitures;
excluding further potential acquisitions; before special items; including lease liabilities
6 At LTM average exchange rates for both net debt and EBITDA; pro forma closed acquisitions/divestitures;
before special items; including lease liabilities
For a detailed overview of special items please see the reconciliation tables on pages 18-19 in the PDF.
Assumptions for guidance FY/22
COVID-19 will continue to impact Fresenius’ operations in 2022. Fresenius expects COVID-19 case numbers to decline going forward and consequently the number of elective treatments and staff availability to improve. An unlikely but possible significant deterioration of the situation triggering containment measures that could have a significant and direct impact on the health care sector without any appropriate compensation is not reflected in the Group’s FY/22 guidance.
The war in Ukraine is affecting Fresenius Group’s operations. The adverse effect of the war amounted to €14 million at net income level of Fresenius Group in the first quarter and is treated as a special item. Fresenius will continue to monitor closely the potential effects of the war.
With the increased uncertainty and volatility related to the Ukraine war, Fresenius now expects more pronounced cost inflationary effects and supply chain disruptions in 2022.
The Management Board assumes an unchanged corporate tax rate in the United States.
Furthermore, the assumptions for Fresenius Medical Care's FY/22 guidance are also fully applicable to Fresenius Group's FY/22 guidance.
All of these assumptions are subject to considerable uncertainty.
The recently announced acquisitions of Ivenix and the majority stake in mAbxience as well as any further potential acquisitions are excluded from guidance.
5% sales increase in constant currency
Group sales increased by 8% (5% in constant currency) to €9,720 million (Q1/21: €8,984 million). Organic growth was 3%. Acquisitions/divestitures contributed net 2% to growth. Currency translation increased sales growth by 3%. Excluding estimated COVID-19 effects1, Group sales growth would have been 5% to 6% in constant currency (Q1/21: 4% to 5%).
3% net income2,3 growth in constant currency
Group EBITDA before special items increased by 2% (-2% in constant currency) to €1,658 million (Q1/212: €1,631 million). Reported Group EBITDA was €1,595 million (Q1/21: €1,628 million).
Group EBIT before special items decreased by 1% (-5% in constant currency) to €996 million (Q1/212: €1,009 million) driven by the COVID-19-related excess mortality among Fresenius Medical Care’s patients as well as elevated labor, material and logistic costs. The EBIT margin before special items was 10.2% (Q1/212: 11.2%). Reported Group EBIT was €902 million (Q1/21: €1,006 million).
Group net interest before special items improved to -€119 million (Q1/212: -€137 million) mainly due to successful refinancing activities. Reported Group net interest also improved to -€118 million (Q1/21: -€137 million).
Group tax rate before special items was 22.7% (Q1/212: 22.8%) while the reported Group tax rate was 23.6% (Q1/21: 22.8%).
Noncontrolling interests before special items were -€216 million (Q1/212: -€237 million) of which 88% were attributable to the noncontrolling interests in Fresenius Medical Care. Reported noncontrolling interests were -€186 million (Q1/21: -€236 million).
1 For estimated COVID-19 effects in Q1/22 and Q1/21 please see table on page 16 in the PDF.
2 Before special items
3 Net income attributable to shareholders of Fresenius SE & Co. KGaA
For a detailed overview of special items please see the reconciliation tables on pages 18-19 in the PDF.
Group net income1 before special items increased by 6% (3% in constant currency) to €462 million (Q1/212: €436 million). Excluding estimated COVID-19 effects3, Group net income1 before special items would have been broadly stable (-2% to 2% in constant currency (Q1/21: 0% to 4%)). Reported Group net income1 decreased to €413 million (Q1/21: €435 million).
Earnings per share1 before special items increased by 6% (3% in constant currency) to €0.83 (Q1/212: €0.78). Reported earnings per share1 were €0.74 (Q1/21: €0.78).
Continued investment in growth
Spending on property, plant and equipment was €338 million corresponding to 3% of sales (Q1/21: €384 million; 4% of sales). These investments served primarily for the modernization and expansion of dialysis clinics, production facilities as well as hospitals and day clinics.
Total acquisition spending was €162 million (Q1/21: €149 million), mainly for the acquisition of dialysis clinics by Fresenius Medical Care and hospitals by Helios Spain.
Cash flow development
Group operating cash flow decreased to €101 million (Q1/21: €652 million) with a margin of 1.0% (Q1/21: 7.3%), mainly driven by working capital build-up from higher raw material inventories and receivables, among others, as well as phasing effects. Free cash flow before acquisitions and dividends decreased to -€255 million (Q1/21: €241 million). Free cash flow after acquisitions and dividends decreased to -€403 million (Q1/21: €117 million).
1 Net income attributable to shareholders of Fresenius SE & Co. KGaA
2 Before special items
3 For estimated COVID-19 effects in Q1/22 and Q1/21 please see table on page 16 in the PDF.
For a detailed overview of special items please see the reconciliation tables on pages 18-19 in the PDF.
Solid balance sheet structure
Group total assets increased by 2% (0% in constant currency) to €73,114 million (Dec. 31, 2021: €71,962 million) given currency translation effects and the expansion of business activities. Current assets increased by 3% (2% in constant currency) to €18,002 million (Dec. 31, 2021: €17,461 million), mainly driven by the increase of trade accounts receivables. Non-current assets increased by 1% (0% in constant currency) to €55,112 million (Dec. 31, 2021: €54,501 million).
Total shareholders’ equity increased by 4% (3% in constant currency) to €30,584 million (Dec. 31, 2021: €29,288 million). The equity ratio was 41.8% (Dec. 31, 2021: 40.7%).
Group debt remained stable (0% in constant currency) at €27,211 million (Dec. 31, 2021: € 27,155 million). Group net debt increased by 3% (2% in constant currency) to € 25,134 million (Dec. 31, 2021: € 24,391 million).
As of March 31, 2022, the net debt/EBITDA ratio increased to 3.60x1,2 (Dec. 31, 2021: 3.51x1,2) mainly driven by COVID-19 effects weighing on operating cash flow.
1 At LTM average exchange rates for both net debt and EBITDA; pro forma closed acquisitions/divestitures
2 Before special items
For a detailed overview of special items please see the reconciliation tables on pages 18-19 in the PDF.
Business Segments
Fresenius Medical Care (Financial data according to Fresenius Medical Care press release)
Fresenius Medical Care is the world's largest provider of products and services for individuals with renal diseases. As of March 31, 2022, Fresenius Medical Care was treating 343,493 patients in 4,153 dialysis clinics. Along with its core business, the Renal Care Continuum, the company focuses on expanding in complementary areas and in the field of critical care.
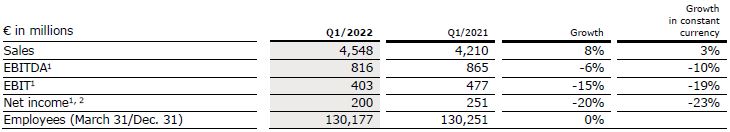
• Higher than anticipated COVID-19-related excess mortality, but declining throughout the quarter
• Earnings development affected by ongoing significantly elevated labor costs compounded by effects from Omicron in Health Care Services and by increased material and logistic costs in Health Care Products
• Earnings development in EMEA additionally impacted by the war in Ukraine
Sales increased by 8% (3% in constant currency) to €4,548 million (Q1/21: €4,210 million). Organic growth was 2%. Currency translation increased sales growth by 5%.
EBIT decreased by 27% (-30% in constant currency) to €348 million (Q1/21: €474 million) resulting in a margin of 7.6% (Q1/21: 11.3%). EBIT before special items, i.e. costs incurred for FME25 and the impact related to the war in Ukraine, decreased by 15% (-19% in constant currency) to €403 million (Q1/21: €477 million), resulting in a margin1 of 8.9% (Q1/21: 11.3%). At constant currency, the decline was mainly due to higher labor costs, adverse COVID-19-related effects, as well as inflationary and supply chain cost increases. These effects were only partially mitigated by the partial reversal of an accrual related to a revenue recognition adjustment for accounts receivable in legal dispute.
1 Before special items
2 Net income attributable to shareholders of Fresenius Medical Care AG & Co. KGaA
For a detailed overview of special items please see the reconciliation tables on pages 18-19 in the PDF.
Net income1 decreased by 37% (-39% in constant currency) to €157 million (Q1/21: €249 million). Net income1 before special items decreased by 20% (-23% in constant currency) to €200 million (Q1/21: €251 million) mainly due to the mentioned negative effects on operating income.
Operating cash flow was €159 million (Q1/21: €208 million) with a margin of 3.5% (Q1/21: 4.9%). The decrease was mainly due to continued recoupment of the U.S. government’s payments received in 2020 under the CARES Act and a decrease in net income, partially offset by a favorable impact from trade accounts and other receivables.
For FY/22, Fresenius Medical Care confirms its outlook and expects revenue2 and net income1,3 to grow at low- to mid-single-digit percentage rates in constant currency4.
For further information, please see Fresenius Medical Care’s press release at www.freseniusmedicalcare.com.
1 Net income attributable to shareholders of Fresenius Medical Care AG & Co. KGaA
2 FY/21 base: €17,619 million
3 FY/21 base: €1,018 million, before special items; FY/22 before special items
4 These targets are based on the 2021 results excluding the costs related to FME25 of €49 million (for net income). They are based on the assumptions outlined in the press release on the Q4 and FY 2021 results (Feb.22, 2022), in constant currency and exclude special items. Special items include further costs related to FME25, the impacts related to the war in Ukraine, and other effects that are unusual in nature and have not been foreseeable or not foreseeable in size or impact at the time of giving guidance.
For a detailed overview of special items please see the reconciliation tables on pages 18-19 in the PDF.
Fresenius Kabi
Fresenius Kabi offers intravenously administered generic drugs, clinical nutrition and infusion therapies for seriously and chronically ill patients in the hospital and outpatient environments. The company is also a leading supplier of medical devices and transfusion technology products. In the biosimilars business, Fresenius Kabi develops products with a focus on oncology and autoimmune diseases.
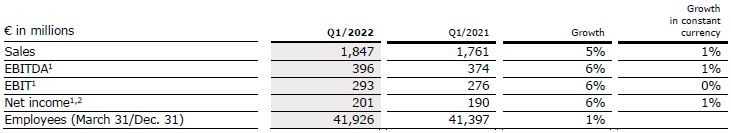
• North America performance impacted by persistent headwinds
• Emerging Markets showed strong earnings growth
• Acquisition of Ivenix and majority stake in mAbxience expected to accelerate growth
Sales increased by 5% (1% in constant currency) to €1,847 million (Q1/21: €1,761 million). Organic growth was 1%. Positive currency translation effects of 4% were mainly related to the U.S. dollar and Chinese yuan.
Sales in North America increased by 4% (organic growth: -3%) to €579 million (Q1/21: €558 million). The organic revenue decrease was mainly due to high level of COVID-related absenteeism of production staff and ongoing competitive pressure.
Sales in Europe increased by 2% (organic growth: 2%) to €640 million (Q1/21: €626 million) mainly driven by increasingly normalizing volume demand given progressing recovery of elective treatments.
Sales in Asia-Pacific increased by 10% (organic growth: 3%) to €433 million (Q1/21: €392 million), due to solid growth across the region. In China, higher sales of products not affected by the NVBP (National Volume-Based Procurement) tenders contributed positively.
Sales in Latin America/Africa increased by 5% (organic growth: 2%) to €195 million (Q1/21: €185 million), over a high prior-year COVID-19-related base.
Sales in the Biosimilars business was €23 million, consistent with Fresenius Kabi’s expectations.
1 Before special items
2 Net income attributable to shareholders of Fresenius SE & Co. KGaA
For a detailed overview of special items please see the reconciliation tables on pages 18-19 in the PDF.
EBIT1 increased by 6% (0% in constant currency) to €293 million (Q1/21: €276 million) with an EBIT margin1 of 15.9% (Q1/21: 15.7%). The high level of absenteeism of production staff primarily due to COVID-19, ongoing competitive pressure, supply chain challenges as well as input cost inflation weighed on the financial performance.
Net income1,2 increased by 6% (increased by 1% in constant currency) to €201 million (Q1/21: €190 million).
Operating cash flow decreased to €133 million (Q1/21: €278 million) with a margin of 7.2% (Q1/21: 15.8%) mainly driven by a working capital build-up from e.g. higher raw material inventories.
For FY/22, Fresenius Kabi confirms its outlook and expects organic sales3 growth in a low single- digit percentage range. Constant currency EBIT4 is expected to decline in a high single- to low-double-digit percentage range. Both sales and EBIT outlook include expected COVID-19 effects.
In March, the acquisitions of Ivenix and a majority stake in mAbxience were announced. mAbxience significantly enhances Fresenius Kabi’s presence in the high-growth biopharmaceuticals market. The acquisition of Ivenix, closed at the beginning of May, strengthens the company’s MedTech business. The financial effects from both acquisitions are excluded from guidance.
1 Before special items
2 Net income attributable to shareholders of Fresenius SE & Co. KGaA
3 FY/21 base: €7,193 million
4 FY/21 base: €1,153 million, before special items, FY/22 before special items
For a detailed overview of special items please see the reconciliation tables on pages 18-19 in the PDF.
Fresenius Helios
Fresenius Helios is Europe's leading private hospital operator. The company comprises Helios Germany, Helios Spain and Helios Fertility. Helios Germany operates 88 hospitals, ~130 outpatient centers and 6 prevention centers. Helios Spain operates 50 hospitals, 97 outpatient centers and around 300 occupational risk prevention centers. In addition, the company is active in Latin America with 8 hospitals and as a provider of medical diagnostics. Helios Fertility offers a wide spectrum of state-of the-art services in the field of fertility treatments.
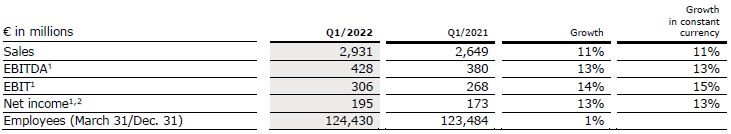
• Helios Germany with solid organic growth based on increased number of admissions
• Helios Spain delivered excellent organic sales and earnings growth given continued strong activity levels
• Helios Fertility with solid financial performance
Sales increased by 11% (11% in constant currency) to €2,931 million (Q1/21: €2,649 million). Organic growth was 8%. Acquisitions, mainly at Helios Fertility, contributed 3% to sales growth.
Sales of Helios Germany increased by 7% (organic growth: 5%) to €1,783 million (Q1/21: €1,673 million), mainly driven by increasing admissions, which are however still below prepandemic levels. Hence growth was supported by COVID-19-related reimbursement schemes. Acquisitions contributed 1% to sales growth.
Sales of Helios Spain increased by 12% (12% in constant currency) to €1,089 million (Q1/21: €976 million). Organic growth of 11% was driven by consistently high activity levels. The hospitals in Latin America also contributed to sales growth. Acquisitions contributed 1% to sales growth.
Sales of the Helios Fertility were €57 million.
1 Before special items
2 Net income attributable to shareholders of Fresenius SE & Co. KGaA
For a detailed overview of special items please see the reconciliation tables on pages 18-19 in the PDF.
EBIT1 increased by 14% (15% in constant currency) to €306 million (Q1/21: €268 million) with an EBIT margin1 of 10.4% (Q1/21: 10.1%).
EBIT1 of Helios Germany increased by 3% to €154 million (Q1/21: €150 million) with an EBIT margin1 of 8.6% (Q1/21: 9.0%). COVID-related elevated staff absenteeism at the beginning of the quarter weighed on profitability. Inflationary effects had only a small negative impact.
EBIT1 of Helios Spain increased by 21% (22% in constant currency) to €153 million (Q1/21: €126 million) due to the consistently high level of treatments. The Latin American business also showed a good performance. The EBIT margin1 was 14.0% (Q1/21: 12.9%).
EBIT1 of Helios Fertility was €4 million with an EBIT1 margin of 7.0%.
Net income1,2 increased by 13% (13% in constant currency) to €195 million (Q1/21: €173 million).
Operating cash flow decreased to -€136 million (Q1/21: €215 million) with a margin of -4.6% (Q1/21: 8.1%) following a strong Q4/21 and COVID-19-related delays in budget negotiations in Germany.
For FY/22, Fresenius Helios confirms its outlook and expects organic sales3 growth in a low to mid-single-digit percentage range and constant currency EBIT4 growth in a mid-single digit percentage range. Both sales and EBIT outlook include expected COVID-19 effects.
1 Before special items
2 Net income attributable to shareholders of Fresenius SE & Co. KGaA
3 FY/21 base: €10,891 million
4 FY/21 base: €1,127 million, before special items, FY/22 before special items
For a detailed overview of special items please see the reconciliation tables on pages 18-19 in the PDF.
Fresenius Vamed
Fresenius Vamed manages projects and provides services for hospitals and other health care facilities worldwide and is a leading post-acute care provider in Central Europe. The portfolio ranges along the entire value chain: from project development, planning, and turnkey construction, via maintenance and technical management to total operational management.
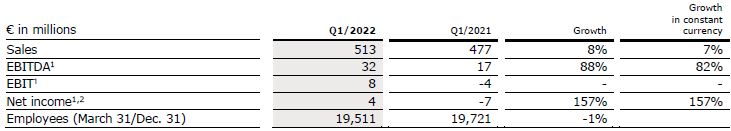
• Project business still marked by COVID-19-related headwinds as well as global supply chain challenges and cost inflation
• Service business supported by increasing elective treatment activity
• Excellent order intake
Sales increased by 8% (7% in constant currency) to €513 million (Q1/21: €477 million). Organic growth was 7%.
Sales in the service business increased by 12% (11% in constant currency) to €405 million (Q1/21: €363 million) due to recovering elective treatments. Sales in the project business decreased by 5% (-5% in constant currency) to €108 million (Q1/21: €114 million), driven by COVID-19-related headwinds as well as global supply chain challenges.
EBIT1 increased to €8 million (Q1/21: -€4 million) mainly driven by the service business with an EBIT margin1 of 1.6% (Q1/21: -0.8%).
1 Before special items
2 Net income attributable to shareholders of VAMED AG
For a detailed overview of special items please see the reconciliation tables on pages 18-19 in the PDF.
Net income1,2 increased to €4 million (Q1/21: -€7 million).
Order intake was €263 million (Q1/21: €138 million). As of March 31, 2022, order backlog was at €3,626 million (December 31, 2021: €3,473 million).
Operating cash flow decreased to -€45 million (Q1/21: -€44 million) with a margin of -8.8% (Q1/21: -9.2%), due to phasing effects and COVID-19-related delays in the project business as well as some working capital build-ups.
For FY/22, Fresenius Vamed confirms its outlook and expects organic sales3 growth in a high single to low-double-digit percentage range and constant currency EBIT4 to return to absolute pre-COVID-19 levels (FY/19: €134 million). Both sales and EBIT outlook include expected COVID-19 effects.
1 Before special items
2 Net income attributable to shareholders of VAMED AG
3 FY/21 base: €2,297 million
4 FY/21 base: €101 million, before special items; FY/22 before special items
For a detailed overview of special items please see the reconciliation tables on pages 18-19 in the PDF.
Conference Call
As part of the publication of the results for Q1/2022, a conference call will be held on May 4, 2022 at 1:30 p.m. CEDT (7:30 a.m. EDT). All investors are cordially invited to follow the conference call in a live broadcast over the Internet at www.fresenius.com/investors. Following the call, a replay will be available on our website.
For additional information on the performance indicators used please refer to our website www.fresenius.com/alternative-performance-measures.
This release contains forward-looking statements that are subject to various risks and uncertainties. Future results could differ materially from those described in these forward-looking statements due to certain factors, e.g. changes in business, economic and competitive conditions, regulatory reforms, results of clinical trials, foreign exchange rate fluctuations, uncertainties in litigation or investigative proceedings, and the availability of financing. Fresenius does not undertake any responsibility to update the forward-looking statements in this release.
- Further earnings growth in 2022 expected despite ongoing COVID-19 effects, and cost inflation impact
- Accelerated execution of cost and efficiency program leading to earlier and significantly higher savings
- Medium-term growth targets confirmed and specified
- 29th consecutive dividend increase – scrip dividend proposed
- Fresenius to be climate neutral by 2040
If no timeframe is specified, information refers to Q4/2021.
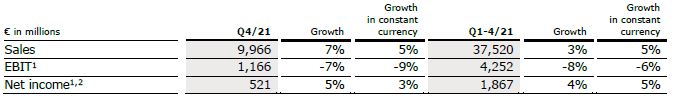
1 Before special items
2 Net income attributable to shareholders of Fresenius SE & Co. KGaA
For a detailed overview of special items please see the reconciliation tables on pages 21-25 in the PDF.
Stephan Sturm, CEO of Fresenius, said: “Our mission is to protect people’s health. Fulfilling that mission has rarely been as difficult as during this pandemic. But we have done our part and have lived up to our responsibility. In business terms, too, 2021 was challenging yet successful: We delivered a strong final quarter and fully met our targets for the year. In 2022 we expect continued profitable growth, despite rising inflation and the ongoing burdens caused by the pandemic. In our cost and efficiency program, we have made faster than expected progress. This is an important factor enabling us to confirm the medium-term targets we set well before the pandemic, giving us all the more reason to look ahead with optimism.”
Path to accelerated growth
Fresenius has defined a strategic path to pursue accelerated profitable growth and hence to sustainably strengthen the Group and each of its business segments by tapping new sources of capital and prioritizing segment capital allocation. All our stakeholders continue to benefit from the advantages of the Group’s current structure, which offers stability through diversification as well as efficiency through economies of scale, access to attractive debt financing and tax savings.
All of Fresenius’ business segments have excellent market positions and ample meaningful growth opportunities. Properly balancing the objectives of all our stakeholder groups requires an even more targeted approach to capital allocation. While Fresenius continues to believe in the virtues of vertical integration, the Company is keen to gradually re-balance the relative weights of its products and service businesses.
Primarily based on its superior profitability and excellent growth prospects, Fresenius Kabi is defined as top priority. With respect to Fresenius Medical Care, which has been particularly hard hit by the pandemic, the transformation program FME25 is expected to result in ever improving profitability and accelerated growth, driving improved valuation for Fresenius’ controlling stake. For Fresenius Helios and Fresenius Vamed, smaller inorganic growth opportunities will continue to be financed from Fresenius Group funds. For larger growth opportunities, Fresenius is open to value-enhancing external equity investments at the level of these business segments. An equity increase on Group level would then be redundant and is hence not foreseen.
By setting this course, Fresenius will accelerate the growth of each of our business segments for the benefit of all stakeholders.
“We are moving Fresenius ahead at speed, with a measured and well-managed transformation of our company. All our business segments have strong market positions, and great growth potential. We intend to harness this potential – guided by clear strategic priorities that will combine additional sources of more dynamic growth with the advantages of a broad business structure. Fresenius remains a diversified healthcare group, with a sharper profile, that will be active in wide-ranging and very exciting areas of medicine,” said Stephan Sturm, CEO of Fresenius.
FY/22 Group guidance
For FY/22, Fresenius projects sales growth1 in a mid-single-digit percentage range in constant currency. Net income2,3 is expected to grow in a low-single-digit percentage range in constant currency. Implicitly, net income2 for the Group excluding Fresenius Medical Care is expected to grow in a low-single-digit percentage range in constant currency.
Without further acquisitions, Fresenius projects an improvement of the net debt/EBITDA4 ratio (December 31, 2021: 3.51x5) into the self-imposed target corridor of 3.0x to 3.5x by the end of 2022.
Assumptions for guidance FY/22
COVID-19 will continue to impact Fresenius’ operations in 2022. The extent of the impact on the Group is to a large degree dependent on the vaccination coverage in Fresenius’ relevant markets and the potential evolution of new virus mutants.
Fresenius closely monitors the development of the COVID-19 pandemic and the associated various containment measures enacted in the Company’s relevant markets. Fresenius expects COVID-19 case numbers to decline from spring 2022 onwards and consequently the number of elective treatments and staff availability to improve. A possible significant deterioration of the situation associated with further containment measures that could have a significant and direct impact on the health care sector without any appropriate compensation is not reflected in the Group’s FY/22 guidance.
1 FY/21 base: €37,520 million
2 Net income attributable to shareholders of Fresenius SE & Co. KGaA
3 FY/21 base: €1,867 million; before special items; FY/22: before special items
4 At LTM average exchange rates for both net debt and EBITDA; pro forma closed acquisitions/divestitures; excluding further potential acquisitions; before special items; including lease liabilities
5 At LTM average exchange rates for both net debt and EBITDA; pro forma closed acquisitions/divestitures; before special items; including lease liabilities
For a detailed overview of special items please see the reconciliation tables on pages 21-25 in the PDF.
Headwinds from cost inflation are reflected. However, Fresenius expects no significant acceleration of inflation effects and supply chain challenges versus the current environment. The Management Board assumes an unchanged corporate tax rate in the United States.
Furthermore, the assumptions for Fresenius Medical Care's FY/22 guidance are also fully applicable to Fresenius Group's FY/22 guidance.
All of these assumptions are subject to considerable uncertainty.
Cost and efficiency program leading to significantly higher savings
Fresenius has successfully completed the first phase of its cost and efficiency program aiming to further safeguard the Group’s medium-term targets and to sustainably enhance profitability. This has led to initial cost savings of ~€20 million and one-time expenses of ~€80 million in 2021. Given the good progress, especially driven by the accelerated implementation of initiatives, Fresenius significantly increases its savings target and now expects cost savings of at least €150 million p.a. after tax and minority interest in 2023. Initially, more than €100 million p.a. after tax and minority interest were projected. For the years thereafter, a further significant increase in sustainable cost savings is expected. The savings will be achieved by all four business segments and the corporate center.
Fresenius anticipates that achieving these sustainable efficiency improvements will require up-front expenses of more than €200 million in 2022 and further expenses of around €100 million in 2023, in each case after taxes and minority interest. No further significant expenses are expected thereafter. In line with previous practice, these expenses are classified as special items.
Growth targets for 2020 – 2023 confirmed and specified
Based on the anticipated positive contributions from the cost and efficiency program as well as the attractive growth opportunities across all business segments, Fresenius expects Group earnings growth to meaningfully accelerate until 2023. The company hence confirms its medium-term targets set in 2019 despite the ongoing challenges posed by COVID-19. At the same time, Fresenius specifies its expectations and now anticipates Group organic sales growth to reach the bottom to middle of the targeted 4% to 7% compounded annual growth rate (CAGR) and Group organic net income1,2 growth to be at the bottom end of the 5% to 9% CAGR during 2020 to 2023. Due to the COVID-19 pandemic, Fresenius now expects small and medium-sized acquisitions to contribute an incremental CAGR of less than 1% to both sales and net income growth.
29th consecutive dividend increase proposed
Consistent with Fresenius’ stated policy, the Management Board of Fresenius will propose to the Supervisory Board a dividend increase of 5% to €0.92 per share for FY/21 (FY/20: €0.88). Provided the proposal is approved by the Supervisory Board and the Annual General Meeting, this will be the 29th consecutive dividend increase.
The Management Board will propose a scrip dividend to the Supervisory Board, thereby giving shareholders the option to receive their dividend (except for the tax portion of the dividend) in the form of new Fresenius shares. The Else Kröner-Fresenius-Foundation has informed Fresenius that it intends to fully participate in the scrip dividend.
Fresenius to be climate neutral by 2040
Fresenius has set a climate target for the Group complementing its existing sustainability targets and programs. The company aims to be climate neutral by 2040 and to reduce 50% of absolute scope 1 and scope 2 emissions by 2030 compared to 2020 levels. Fresenius will continuously assess scope 3 emission impacts for inclusion in targets. Further information at www.fresenius.com/sustainability and in today’s separate press release at www.fresenius.com/news.
1 Net income attributable to shareholders of Fresenius SE & Co. KGaA
2 Before special items
For a detailed overview of special items please see the reconciliation tables on pages 21-25 in the PDF.
5% sales growth in constant currency
Group sales increased by 7% (5% in constant currency) to €9,966 million (Q4/20: €9,304 million). Organic growth was 4%. Acquisitions/divestitures contributed net 1% to sales growth. Currency translation increased sales growth by 2%. Excluding estimated COVID-19 effects1, Group sales growth would have been 5% to 6% in constant currency.
In FY/21, Group sales increased by 3% (5% in constant currency) to €37,520 million (FY/20: €36,277 million). Organic growth was 4%. Acquisitions/divestitures contributed net 1% to sales growth. Currency translation reduced sales growth by 2%. Excluding estimated COVID-19 effects1, Group sales growth would have been 5% to 6% in constant currency.
5% net income2,3 growth in constant currency
Group EBITDA before special items decreased by 2% (-5% in constant currency) to €1,846 million (Q4/202: €1,886 million). Reported Group EBITDA was €1,868 million (Q4/20: €1,854 million).
In FY/21, Group EBITDA before special items decreased by 4% (-2% in constant currency) to €6,854 million (FY/202: €7,132 million). Reported Group EBITDA was €6,825 million (FY/20: €7,100 million).
Group EBIT before special items decreased by 7% (-9% in constant currency) to €1,166 million (Q4/202: €1,251 million). The decrease is primarily due to COVID-19 related headwinds at Fresenius Medical Care. The EBIT margin before special items was 11.7% (Q4/202: 13.4%). Reported Group EBIT was €1,123 million (Q4/20: €1,024 million).
In FY/21, Group EBIT before special items decreased by 8% (-6% in constant currency) to €4,252 million (FY/202: €4,612 million). The decrease is primarily due to COVID-19 related headwinds at Fresenius Medical Care. The EBIT margin before special items was 11.3% (FY/202: 12.7%). Reported Group EBIT was €4,158 million (FY/20: €4,385 million).
1 For estimated COVID-19 effects in Q4/21 and FY/21 please see table on page 19 in the PDF.
2 Before special items
3 Net income attributable to shareholders of Fresenius SE & Co. KGaA
For a detailed overview of special items please see the reconciliation tables on pages 21-25 in the PDF.
Group net interest before special items improved to -€120 million (Q4/202: -€159 million) mainly due to successful refinancing activities. Reported Group net interest improved to -€122 million (Q4/20: -€156 million).
In FY/21, Group net interest before special items improved to -€504 million (FY/201: - €654 million) while reported Group net interest improved to -€506 million (FY/20: -€659 million).
The Group tax rate before special items was 23.1% (Q4/201: 24.1%) while the reported Group tax rate was 24.2% (Q4/20: 29.4%). In FY/21, the Group tax rate before special items was 22.6% (FY/201: 23.1%) while the reported Group tax rate was 22.8% (FY/20: 24.2%).
Noncontrolling interests before special items were €283 million (Q4/201: €335 million) of which 90% were attributable to the noncontrolling interests in Fresenius Medical Care. Reported noncontrolling interests were €260 million (Q4/20 reported: €203 million).
In FY/21, noncontrolling interests before special items were €1,033 million (FY/201: €1,248 million) of which 91% were attributable to the noncontrolling interests in Fresenius Medical Care. Reported noncontrolling interests were €1,001 million (FY/20 reported: €1,116 million).
Group net income2 before special items increased by 5% (3% in constant currency) to €521 million (Q4/201: €494 million). The increase is driven by the strong development of Fresenius Kabi’s Emerging Market business, a good performance at Helios Germany, an excellent finish to the year by Fresenius Vamed and the favorable net interest development. Excluding estimated COVID-19 effects3, Group net income2 before special items would have grown 3% to 7% in constant currency. Reported Group net income2 increased to €499 million (Q4/20: €410 million).
In FY/21, Group net income2 before special items increased by 4% (5% in constant currency) to €1,867 million (FY/201: €1,796 million). Excluding estimated COVID-19 effects3, Group net income2 before special items would have grown 6% to 10% in constant currency. Reported Group net income2 increased to €1,818 million (FY/20: €1,707 million).
1 Before special items
2 Net income attributable to shareholders of Fresenius SE & Co. KGaA
3 For estimated COVID-19 effects in Q4/21 and FY/21 please see table on page 19 in the PDF.
For a detailed overview of special items please see the reconciliation tables on pages 21-25 in the PDF.
Earnings per share1 before special items increased by 5% (2% in constant currency) to €0.94 (Q4/202: €0.88). Reported earnings per share1 were €0.90 (Q4/20: €0.73). In FY/21, earnings per share1 before special items increased by 4% (5% in constant currency) to €3.35 (FY/202: €3.22). Reported earnings per share1 were €3.26 (FY/20: €3.06).
Continued investment in growth
Spending on property, plant and equipment was €690 million corresponding to 7% of sales (Q4/20: €856 million; 9% of sales). These investments served primarily for the modernization and expansion of dialysis clinics, production facilities as well as hospitals and day clinics. In FY/21, spending on property, plant and equipment was €2,032 million corresponding to 5% of sales (FY/20: €2,398 million; 7% of sales).
Total acquisition spending was €278 million (Q4/20: €251 million). In FY/21, total acquisition spending was €1,085 million (FY/20: €902 million) mainly for the acquisition of the Eugin Group at Fresenius Helios which has been consolidated since April 1, 2021, and the acquisition of dialysis clinics at Fresenius Medical Care.
Strong cash flow development in Q4/21
Group operating cash flow increased by 26% to €1,749 million (Q4/20: €1,390 million) with an improved margin of 17.5% (Q4/20: 14.9%) mainly due to stringent working capital management. The good operating performance at Helios Spain, Fresenius Vamed and Fresenius Kabi also contributed to the positive development. Free cash flow before acquisitions and dividends increased to €1,075 million (Q4/20: €590 million). Free cash flow after acquisitions and dividends increased to €841 million (Q4/20: €329 million).
In FY/21, Group operating cash flow decreased to €5,078 million (FY/20: €6,549 million) with a margin of 13.5% (FY/20: 18.1%) mainly due to the U.S. government’s advanced payments received in 2020 and the partial recoupment of these payments in 2021 at Fresenius Medical Care.
Free cash flow before acquisitions and dividends decreased to €3,061 million (FY/20: €4,183 million). Free cash flow after acquisitions and dividends decreased to €1,193 million (FY/20: €2,478 million).
1 Net income attributable to shareholders of Fresenius SE & Co. KGaA
2 Before special items
For a detailed overview of special items please see the reconciliation tables on pages 21-25 in the PDF.
Solid balance sheet structure
Group total assets increased by 8% (4% in constant currency) to €71,962 million (Dec. 31, 2020: €66,646 million). The increase is mainly due to currency translation effects, acquisitions as well as the expansion of business activities. Current assets increased by 11% (8% in constant currency) to €17,461 million (Dec. 31, 2020: €15,772 million) driven by the increase of cash and cash equivalents, trade accounts receivables and inventories. Non-current assets increased by 7% (3% in constant currency) to €54,501 million (Dec. 31, 2020: €50,874 million).
Total shareholders’ equity increased by 13% (7% in constant currency) to €29,288 million (Dec. 31, 2020: €26,023 million). The increase is due to currency translation effects as well as the good net income development. The equity ratio was 40.7% (Dec. 31, 2020: 39.0%).
Group debt increased by 5% (2% in constant currency) to €27,155 million (Dec. 31, 2020: € 25,913 million). Group net debt increased by 1% (-1% in constant currency) to € 24,391 million (Dec. 31, 2020: € 24,076 million).
As of December 31, 2021, the net debt/EBITDA ratio increased to 3.51x1,2 (Dec. 31, 2020: 3.44x1,2) driven by COVID-19 effects weighing on EBITDA.
1 At LTM average exchange rates for both net debt and EBITDA; pro forma closed acquisitions/divestitures; including lease liabilities
2 Before special items
For a detailed overview of special items please see the reconciliation tables on pages 21-25 in the PDF.
Business Segments
Fresenius Medical Care (Financial data according to Fresenius Medical Care press release)
Fresenius Medical Care is the world's largest provider of products and services for individuals with renal diseases. As of December 31, 2021, Fresenius Medical Care was treating 345,425 patients in 4,171 dialysis clinics. Along with its core business, the Renal Care Continuum, the company focuses on expanding in complementary areas and in the field of critical care.
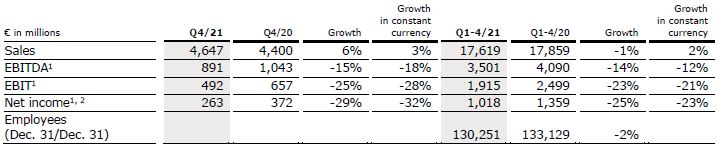
• Business development significantly impacted by COVID-19 in 2021, effects are expected to continue into 2022
• Decline in excess mortality in the fourth quarter
• Return to earnings growth in 2022 targeted
Sales increased by 6% (3% in constant currency) to €4,647 million (Q4/20: €4,400 million). Currency translation increased sales growth by 3%. Organic growth was 2%. Acquisitions/divestitures contributed net 1% to sales growth.
In FY/21, sales decreased by 1% (increased by 2% in constant currency) to €17,619 million (FY/20: €17,859 million). Currency translation decreased sales growth by 3%. Organic growth was 1%. Acquisitions/divestitures contributed net 1% to sales growth.
EBIT decreased by 3% (-7% in constant currency) to €449 million (Q4/20: €462 million) resulting in a margin of 9.7% (Q4/20: 10.5%). EBIT before special items decreased by 25% (-28% in constant currency) to €492 million (Q4/20: €657 million), resulting in a margin of 10.6% (Q4/20: 14.9%). The decline was mainly due to a remeasurement effect on the fair value of investments, higher labor cost, the adverse COVID-19-related net effects and inflationary materials cost increases. These effects were only slightly mitigated by an improved U.S. payor mix, in particular due to an increased number of patients with Medicare Advantage coverage.
1 Before special items
2 Net income attributable to shareholders of Fresenius Medical Care AG & Co. KGaA
For a detailed overview of special items please see the reconciliation tables on pages 21-25 in the PDF.
In FY/21, EBIT decreased by 20% (-17% in constant currency) to €1,852 million (FY/20: €2,304 million) resulting in a margin of 10.5% (FY/20: 12.9%). EBIT before special items decreased by 23% (-21% in constant currency) to €1,915 million (FY/20: €2,499 million), resulting in a margin of 10.9% (FY/20: 14.0%).
Net income1 increased by 29% (23% in constant currency) to €229 million (Q4/20: €177 million). Net income1 before special items decreased by 29% (-32% in constant currency) to €263 million (Q4/20: €372 million) mainly due to the mentioned negative effects on operating income. In FY/21, net income1 decreased by 17% (-14% in constant currency) to €969 million (FY/20: €1,164 million). Net income1 before special items decreased by 25% (-23% in constant currency) to €1,018 million (FY/20: €1,359 million).
Operating cash flow was €669 million (Q4/20: €584 million) with a margin of 14.4% (Q4/20: 13.3%). The increase was mainly due to improved working capital including contributions from FME25 and U.S. federal relief funding, partially offset by continued recoupment of the U.S. government’s payments received in 2020 under the CARES Act and lower tax payments related to COVID-19 reliefs in the prior year. In FY/21, operating cash flow was €2,489 million (FY/20: €4,233 million) with a margin of 14.1% (FY/20: 23.7%).
For FY/22, Fresenius Medical Care expects revenue2 and net income1,3 to grow at low- to mid-single-digit percentage rates in constant currency4. For the underlying assumptions please see Fresenius Medical Care’s press release at www.freseniusmedicalcare.com.
For further information, please see Fresenius Medical Care’s press release at www.freseniusmedicalcare.com.
1 Net income attributable to shareholders of Fresenius Medical Care AG & Co. KGaA
2 FY/21 base: €17,619 million
3 FY/21 base: €1,018 million, before special items; FY/22 before special items
4 These targets are based on the 2021 results excluding the costs related to FME25 of €49 million (for net income). They are based on the outlined assumptions (http://www.freseniusmedicalcare.com), in constant currency and exclude special items. Special items include further costs related to FME25 and other effects that are unusual in nature and have not been foreseeable or not foreseeable in size or impact at the time of giving guidance.
For a detailed overview of special items please see the reconciliation tables on pages 21-25 in the PDF.
Fresenius Kabi
Fresenius Kabi offers intravenously administered generic drugs, clinical nutrition and infusion therapies for seriously and chronically ill patients in the hospital and outpatient environments. The company is also a leading supplier of medical devices and transfusion technology products. In the biosimilars business, Fresenius Kabi develops products with a focus on oncology and autoimmune diseases.
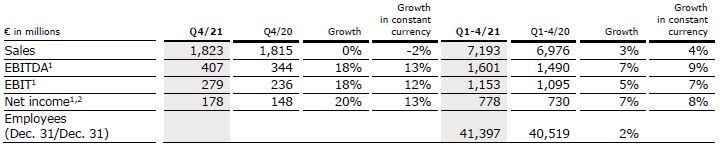
• Good performance in Q4 supported by COVID-driven demand, not expected to continue through 2022
• North America with positive organic sales and EBIT growth despite supply chain challenges
• Asia-Pacific with anticipated organic sales decline due to price effects in China post successful participation in NVBP tenders
• Separate reporting of Biosimilars sales starting Q1/22
Sales remained on previous year’s level (decreased by -2% in constant currency) at €1,823 million (Q4/20: €1,815 million). Organic growth was -1%. Divestitures reduced sales growth by 1%. Positive currency translation effects (2%) were mainly related to the appreciation of the U.S. dollar and the Chinese yuan against the Euro.
In FY/21, sales increased by 3% (4% in constant currency) to €7,193 million (FY/20: €6,976 million). Organic growth was 4%. Negative currency translation effects of 1% were mainly related to the weakness of the U.S. dollar.
Sales in North America increased by 7% (organic growth: 2%) to €589 million (Q4/20: €549 million) driven by COVID-19 related extra demand. In FY/21, sales in North America decreased by 5% (organic growth: -2%) to €2,258 million (FY/20: €2,376 million).
Sales in Europe decreased by 2% (organic growth: 0%) to €664 million (Q4/20: €680 million) mainly due to the high prior-year base. In FY/21, sales in Europe increased by 3% (organic growth: 3%) to €2,544 million (FY/20: €2,458 million).
1 Before special items
2 Net income attributable to shareholders of Fresenius SE & Co. KGaA
For a detailed overview of special items please see the reconciliation tables on pages 21-25 in the PDF.
Sales in Asia-Pacific decreased by 8% (organic growth: -13%) to €395 million (Q4/20: €428 million) due to the anticipated negative price effects from successful participation in NVBP (National Volume-Based Purchasing) tenders as well as the exceptionally high prior-year base. In FY/21, sales in Asia-Pacific increased by 10% (organic growth: 8%) to €1,643 million (FY/20: €1,497 million).
Sales in Latin America/Africa increased by 11% (organic growth: 12%) to €175 million (Q4/20: €158 million) due to ongoing COVID-19 related extra demand. In FY/21, sales in Latin America/Africa increased by 16% (organic growth: 23%) to €748 million (FY/20: €645 million).
EBIT before special items increased by 18% (12% in constant currency) to €279 million (Q4/201: €236 million) with a margin of 15.3% (Q4/201:13.0%). The excellent performance is primarily due to COVID-19 related extra demand, and cost savings in the Asia-Pacific region, mainly in China. The ongoing competitive situation, supply chain challenges, the flow-through effects of tenders in China were headwinds. There were broadly offsetting one time effects across the regions. In FY/21, EBIT before special items increased by 5% (7% in constant currency) to €1,153 million (FY/201: €1,095 million) with a margin of 16.0% (FY/201: 15.7%).
Net income1,2 increased by 20% (13% in constant currency) to €178 million (Q4/201: €148 million). In FY/21, net income1,2 increased by 7% (8% in constant currency) to €778 million (FY/201: €730 million).
Operating cash flow increased by 9% to €335 million (Q4/20: €307 million) with a margin of 18.4% (Q4/20: 16.9%) mainly due to a healthy operational performance. In FY/21, operating cash flow increased by 5% to €1,203 million (FY/20: €1,143 million) with a margin of 16.7% (FY/20: 16.4%).
For FY/22, Fresenius Kabi expects organic sales3 growth in a low-single-digit percentage range. Constant currency EBIT4 is expected to decline in a high-single- to low-double-digit percentage range. Both sales and EBIT outlook include expected COVID-19 effects.
Starting Q1/22, the sales of the Biosimilars business will be reported on a quarterly basis.
1 Before special items
2 Net income attributable to shareholders of Fresenius SE & Co. KGaA
3 FY/21 base: €7,193 million
4 FY/21 base: €1,153 million, before special items, FY/22 before special items
For a detailed overview of special items please see the reconciliation tables on pages 21-25 in the PDF.
Fresenius Helios
Fresenius Helios is Europe's leading private hospital operator. The company comprises Helios Germany and Helios Spain (Quirónsalud) and the Eugin Group. Helios Germany operates 90 hospitals, ~130 outpatient centers and 6 prevention centers. Quirónsalud operates 49 hospitals in Spain as well as 88 outpatient centers and ~300 occupational risk prevention centers. In addition, the company is active in Latin America with 7 hospitals and as a provider of medical diagnostics.
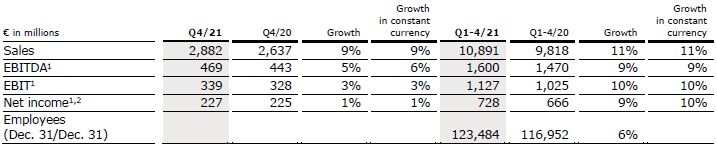
• Sales growth at Helios Germany driven by increasing admissions and acquisitions
• Helios Spain with strong organic sales growth; EBIT growth influenced by exceptionally high prior-year base
• Separate reporting of Fertility Services starting Q1/22
Sales increased by 9% (9% in constant currency) to €2,882 million (Q4/20: €2,637 million). Organic growth was 5%. Acquisitions contributed 4% to sales growth. In FY/21, sales increased by 11% (11% in constant currency) to €10,891 million (FY/20: €9,818 million). Organic growth was 7%. Acquisitions contributed 4% to sales growth.
Sales of Helios Germany increased by 7% (organic growth: 4%) to €1,745 million (Q4/20: €1,637 million) primarily driven by increasing admissions. Acquisitions contributed 3% to sales growth. In FY/21, sales of Helios Germany increased by 6% (organic growth: 2%) to €6,733 million (FY/20: €6,340 million). Acquisitions contributed 4% to sales growth.
Sales of Helios Spain increased by 9% (9% in constant currency) to €1,084 million (Q4/20: €999 million). Organic growth of 9% was driven by the continuous high level of treatment activity and a consistently high level of demand for the occupational risk prevention services as well as good contributions from Latin America. In FY/21, sales of Helios Spain increased by 16% (17% in constant currency) to €4,021 million (FY/20: €3,475 million). Organic growth was 15%. Acquisitions contributed 2% to sales growth.
1 Before special items
2 Net income attributable to shareholders of Fresenius SE & Co. KGaA
For a detailed overview of special items please see the reconciliation tables on pages 21-25 in the PDF.
EBIT1 of Fresenius Helios increased by 3% (3% in constant currency) to €339 million (Q4/20: €328 million) with a margin1 of 11.8% (Q4/20: 12.4%). In FY/21, EBIT1 of Fresenius Helios increased by 10% (10% in constant currency) to €1,127 million (FY/20: €1,025 million) with a margin1 of 10.3% (FY/20: 10.4%).
EBIT1 of Helios Germany increased by 9% to €171 million (Q4/20: €157 million) with a margin1 of 9.8% (Q4/20: 9.6%) driven by the positive business development as well as the compensation for COVID-19 related revenue shortfalls. In FY/21, EBIT1 of Helios Germany increased by 2% to €613 million (FY/20: €602 million) with a margin1 of 9.1% (FY/20: 9.5%).
EBIT1 of Helios Spain increased by 2% (3% in constant currency) to €162 million (Q4/20: €159 million) with a margin1 of 14.9% (Q4/20: 15.9%). EBIT growth was influenced by the exceptionally high prior-year base. In addition, higher costs for personnel, personal protective equipment and selected medical products, among others, had a negative impact.
In FY/21, EBIT1 of Helios Spain increased by 22% (24% in constant currency) to €514 million (FY/20: €420 million) with a margin1 of 12.8% (FY/20: 12.1%).
Net income1,2 increased by 1% to €227 million (Q4/20: €225 million). In FY/21, net income1,2 increased by 9% to €728 million (FY/20: €666 million).
Operating cash flow increased to €609 million (Q4/20: €434 million) with a margin of 21.1% (Q4/20: 16.5%) driven by the positive business development as well as stringent working capital management. In FY/21, operating cash flow increased to €1,204 million (FY/20: €1,149 million) with a margin of 11.1% (FY/20: 11.7%).
For FY/22, Fresenius Helios expects organic sales3 growth in a low- to mid-single-digit percentage range and constant currency EBIT4 growth in a mid-single-digit percentage range. Both sales and EBIT outlook include expected COVID-19 effects.
The Eugin Group contributed €133 million to sales and €19 million EBIT in 2021, with first-time consolidation effective April 1, 2021. Starting Q1/22, sales and EBIT of the Eugin Group will be reported under “Fertility Services” on a quarterly basis.
1 Before special items
2 Net income attributable to shareholders of Fresenius SE & Co. KGaA
3 FY/21 base: €10,891 million
4 FY/21 base: €1,127 million, FY/22 before special items
For a detailed overview of special items please see the reconciliation tables on pages 21-25 in the PDF.
Fresenius Vamed
Fresenius Vamed manages projects and provides services for hospitals and other health care facilities worldwide and is a leading post-acute care provider in Central Europe. The portfolio ranges along the entire value chain: from project development, planning, and turnkey construction, via maintenance and technical management to total operational management.
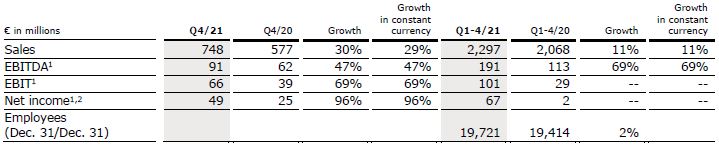
• Strong finish to the year with excellent organic sales and EBIT growth
• Project business recovering - back to the typical phasing with a strong Q4
• Rehabilitation business developing steadily despite continuous COVID-19 impact; technical service business remains robust
Sales increased by 30% (29% in constant currency) to €748 million (Q4/20: €577 million). Organic growth was 29%. In FY/21, sales increased by 11% (11% in constant currency) to €2,297 million (FY/20: €2,068 million). Organic growth was 11%.
Sales in the service business increased by 12% to €415 million (Q4/20: €372 million). Sales in the project business increased by 62% to €333 million (Q4/20: €205 million), driven by the good operating performance across all regions. In FY/21, sales in the service business increased by 10% to €1,580 million (FY/20: €1,435 million). Sales in the project business increased by 13% to €717 million (FY/20: €633 million).
1 Before special items
2 Net income attributable to shareholders of VAMED AG
For a detailed overview of special items please see the reconciliation tables on pages 21-25 in the PDF.
EBIT1 increased by 69% (69% in constant currency) to €66 million (Q4/20: €39 million) with a margin1 of 8.8% (Q4/20: 6.8%). This significant recovery is due to the good business performance in all regions. In FY/21, EBIT1 more than tripled (248% in constant currency) to €101 million (FY/20: €29 million) with a margin1 of 4.4% (FY/20: 1.4%).
Net income1,2 increased to €49 million (Q4/20: €25 million). In FY/21, net income1,2 increased to €67 million (FY/20: €2 million).
Order intake was €319 million in Q4/21 (Q4/20: €648 million) and €1,290 million in FY/21 (FY/20: €1,010 million). As of December 31, 2021, order backlog was at €3,473 million (December 31, 2020: €3,055 million).
Operating cash flow increased to €128 million (Q4/20: €74 million) with a margin of 17.1% (Q4/20: 12.8%) mainly due to an improved working capital development. In FY/21, operating cash flow increased to €151 million (FY/20: €78 million) with a margin of 6.6% (FY/20: 3.8%).
For FY/22, Fresenius Vamed expects organic sales3 growth in a high-single to low-double-digit percentage range and constant currency EBIT4 to return to absolute pre-COVID-19 levels (FY/19: €134 million). Both sales and EBIT outlook include expected negative COVID-19 effects.
1 Before special items
2 Net income attributable to shareholders of VAMED AG
3 FY/21 base: €2,297 million
4 FY/21 base: €101 million; FY/22 before special items
For a detailed overview of special items please see the reconciliation tables on pages 21-25 in the PDF.
Conference Call
As part of the publication of the results for FY 2021, a conference call will be held on February 22, 2022 at 1:30 p.m. CET (7:30 a.m. EST). All investors are cordially invited to follow the conference call in a live broadcast over the Internet at www.fresenius.com/investors. Following the call, a replay will be available on our website.
For additional information on the performance indicators used please refer to our website www.fresenius.com/alternative-performance-measures.
This release contains forward-looking statements that are subject to various risks and uncertainties. Future results could differ materially from those described in these forward-looking statements due to certain factors, e.g. changes in business, economic and competitive conditions, regulatory reforms, results of clinical trials, foreign exchange rate fluctuations, uncertainties in litigation or investigative proceedings, and the availability of financing. Fresenius does not undertake any responsibility to update the forward-looking statements in this release.
Business segments
Topics
Time span
News 0 - 0 of 0 |
Open order serviceAd Hoc News
Contact

Senior Vice President Investor Relations
Head of Investor Relations
T: +49 (0) 6172 608-97033
nick.stone@fresenius.com
- Fresenius Medical Care with stronger than projected COVID-19 related headwind
- Fresenius Kabi improves EBIT1 outlook; North America returning to growth; Emerging Markets business with continued healthy financial performance
- Helios Germany with ongoing upward trend for elective treatments; activity levels at Helios Spain above pre-pandemic levels
- Fresenius Vamed with good performance in the service business; order book in the project business remains at all-time high
- Cost and efficiency program on track; savings targets confirmed for FY/23
- Fresenius raises FY/21 Group sales outlook; earnings now expected to be around the top-end of guidance
If no timeframe is specified, information refers to Q3/21.
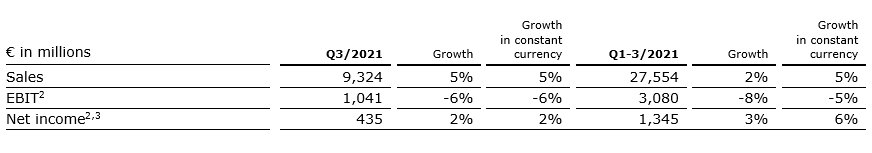
1 In constant currency
2 Before special items
3 Net income attributable to shareholders of Fresenius SE & Co. KGaA
For a detailed overview of special items please see the reconciliation table in the PDF document.
Stephan Sturm, CEO of Fresenius, said: “More and more people being vaccinated against COVID-19 is good news. However, the pandemic remains very relevant. It has also more strongly impacted Fresenius and for longer than could have been foreseen. Yet despite this, we continue to grow and remain on track to achieve this year’s, again raised, targets. Launching the Group cost and efficiency program has proved to be the right decision: Our initiatives will help us to better absorb the burdens caused by the pandemic. At the same time, they will strengthen our foundations to thrive, long-term, in a challenging environment. The demand for high-quality, affordable healthcare will be even greater in the future. Fresenius will continue making an important contribution, while creating value for all stakeholders.”
COVID-19 assumptions for guidance FY/21
Negative COVID-19 effects at Fresenius have increased sequentially in Q3/21, driven by significant excess patient mortality at Fresenius Medical Care. Fresenius expects also Q4/21 to be impacted by COVID-19 effects. Meaningfully rising COVID-19 case numbers, the further evolution of virus mutations as well as stalling vaccination progress could impact Fresenius’ ability to achieve its FY/21 guidance. Additionally, Fresenius expects headwinds from cost inflation including rising commodity and shipping prices, increasing energy costs, as well as supply chain constraints in Q4/21. Hence, Fresenius remains vigilant.
Whilst the risk of renewed far-reaching containment measures in one or more of Fresenius’ major markets cannot be excluded, it now appears unlikely. Any resulting significant and direct impact on the health care sector without appropriate compensation is not reflected in the Group’s FY/21 guidance. These assumptions are subject to considerable uncertainty.
FY/21 Group sales guidance raised, earnings guidance improved
Based on the Group’s good Q3/21 results and the progress to improve Group-wide efficiencies, Fresenius raises its sales guidance and improves its earnings guidance. The Company now projects constant currency sales1 to grow in a mid single-digit range in FY/21. Previously, the Company projected sales1 growth in a low-to-mid single-digit percentage range in constant currency. Earnings2,3 growth in constant currency is now expected to be around the top-end of the low single-digit percentage range.
Implicitly, net income2 for the Group excluding Fresenius Medical Care is now expected to grow in a low double-digit percentage range in constant currency. Previously, Fresenius expected high single-digit percentage growth in constant currency.
The guidance implies ongoing COVID-19 related headwinds, primarily at Fresenius Medical Care, and increasingly noticeable cost inflation across selected markets in Q4/21. It also reflects negative pricing effects related to tender activity at Fresenius Kabi in China.
Based on expected lower contributions to Group EBITDA from Fresenius Medical Care as well as assumed cash phasing effects in Q4/21, Fresenius does not expect the net debt/EBITDA4 ratio of 3.55x as of September 30, 2021 to improve in Q4/21.
1 FY/20 base: €36,277 million
2 Net income attributable to shareholders of Fresenius SE & Co. KGaA
3 FY/20 base: €1,796 million, before special items; FY/21: before special items
4 At LTM average exchange rates for both net debt and EBITDA; pro forma closed acquisitions/divestitures; excluding further potential acquisitions; before special items
For a detailed overview of special items please see the reconciliation table in the PDF document.
Progress on efficiency measures to sustainably improve profitability
During Q3/21, Fresenius finalized the concept phase of its cost and efficiency program. At the same time, first initiatives were already implemented. Fresenius Medical Care is providing an update on its FME25 transformation program in addition to its Q3/21 results presentation. Fresenius confirms its expectation that the measures to sustainably enhance profitability and operational excellence to reach cost savings of more than €100 million p.a. after tax and minority interest in 2023, with some potential to increase thereafter.
Achieving these sustainable efficiencies will require significant up-front expenses. For the years 2021 to 2023, those expenses are expected to average more than €100 million p.a. after tax and minority interest, with the largest portion currently expected to materialize in 2022. They will be classified as special items, consistent with previous practice.
Fresenius expects significant contributions from all four business segments and from the corporate center in the 2021 to 2023 period. For FY/21, low double-digit million Euro savings after tax and minority interest from the Group’s cost and efficiency measures are expected to support the Group’s profitability. These savings and efficiency gains derive from activities in all four business segments.
5% sales increase in constant currency
Group sales increased by 5% (5% in constant currency) to €9,324 million (Q3/20: €8,918 million). Organic growth was 3%. Acquisitions/divestitures contributed net 2% to growth. Currency translation had no effect on sales growth. Excluding estimated COVID-19 effects1, Group sales growth would have been 7% to 8% in constant currency.
In Q1-3/21, Group sales increased by 2% (5% in constant currency) to €27,554 million (Q1-3/20: €26,973 million). Organic growth was 4%. Acquisitions/divestitures contributed net 1% to growth. Currency translation reduced sales growth by 3%. Excluding estimated COVID-19 effects1, Group sales growth would have been 5% to 6% in constant currency.
2% net income2,3 increase in constant currency
Group EBITDA before special items decreased by 2% (-2% in constant currency) to €1,700 million (Q3/20: €1,729 million). Reported Group EBITDA was €1,667 million (Q3/20: €1,729 million).
In Q1-3/21, Group EBITDA before special items decreased by 5% (-1% in constant currency) to €5,002 million (Q1-3/20: €5,246 million). Reported Group EBITDA was €4,957 million (Q1-3/20: €5,246 million).
Group EBIT before special items decreased by 6% (-6% in constant currency) to €1,041 million (Q3/20: €1,113 million). The decrease is primarily due to COVID-19 related headwinds at Fresenius Medical Care. The EBIT margin before special items was 11.2% (Q3/20: 12.5%). Reported Group EBIT was €1,008 million (Q3/20: €1,113 million).
In Q1-3/21, Group EBIT before special items decreased by 8% (-5% in constant currency) to €3,080 million (Q1-3/20: €3,361 million). The constant currency decrease is primarily due to COVID-19 related headwinds at Fresenius Medical Care. The EBIT margin before special items was 11.2% (Q1-3/20: 12.5%). Reported Group EBIT was €3,035 million (Q1-3/20: €3,361 million).
1 For estimated COVID-19 effects please see table in the PDF document.
2 Before special items
3 Net income attributable to shareholders of Fresenius SE & Co. KGaA
For a detailed overview of special items please see the reconciliation table in the PDF document.
Group net interest before special items and reported net interest improved to -€126 million (Q3/202: -€154 million) mainly due to lower interest rates.
In Q1-3/21, Group net interest before special items improved to -€384 million (Q1-3/202: -€495 million). Reported Group net interest improved to -€384 million (Q1-3/20: -€503 million).
Group tax rate before special items was 23.0% (Q3/202: 22.0%) while reported Group tax rate was 22.8% (Q3/20: 22.0%).
In Q1-3/21, Group tax rate before special items was 22.4% (Q1-3/202: 22.7%) while reported Group tax rate was 22.3% (Q1-3/20: 22.7%).
Noncontrolling interests before special items were -€270 million (Q3/20: -€321 million) of which 91% were attributable to the noncontrolling interests in Fresenius Medical Care. Reported noncontrolling interests were -€268 million (Q3/20: -€321 million).
In Q1-3/21, noncontrolling interests before special items were -€747 million (Q1-3/20: -€913 million) of which 91% were attributable to the noncontrolling interests in Fresenius Medical Care. Reported noncontrolling interests were -€741 million (Q3/20: -€913 million).
Group net income1 before special items increased by 2% (2% in constant currency) to €435 million (Q3/202: €427 million) driven by Fresenius Vamed and Fresenius Kabi as well as by the favorable net interest development. Excluding estimated COVID-19 effects3, Group net income1 before special items would have grown 12% to 16% in constant currency. Reported Group net income1 decreased to €413 million (Q3/20: €427 million).
In Q1-3/21, Group net income1 before special items increased by 3% (6% in constant currency) to €1,345 million (Q1-3/202: €1,302 million). Excluding estimated COVID-19 effects3, Group net income1 before special items would have grown 7% to 11% in constant currency. Reported Group net income1 increased to €1,319 million (Q1-3/20: €1,297 million).
1 Net income attributable to shareholders of Fresenius SE & Co. KGaA
2 Before special items
3 For estimated COVID-19 effects please see table in the PDF document.
For a detailed overview of special items please see the reconciliation table in the PDF document.
Earnings per share1 before special items increased by 1% (1% in constant currency) to €0.78 (Q3/202: €0.77). Reported earnings per share1 were €0.74 (Q3/20: €0.77).
In Q1-3/21, earnings per share1 before special items increased by 3% (6% in constant currency) to €2.41 (Q1-3/202: €2.34). Reported earnings per share1 were €2.36 (Q1-3/20: €2.33).
Continued investment in growth
Spending on property, plant and equipment was €449 million corresponding to 5% of sales (Q3/20: €521 million; 6% of sales). These investments served primarily for the modernization and expansion of dialysis clinics, production facilities as well as hospitals and day clinics.
In Q1-3/21, spending on property, plant and equipment was €1,342 million corresponding to 5% of sales (Q1-3/20: €1,542 million; 6% of sales).
Total acquisition spending was €167 million (Q3/20: €142 million). In Q1-3/21, total acquisition spending was €807 million (Q1-3/20: €651 million) mainly for the acquisition of Eugin Group at Fresenius Helios which has been consolidated since April 1, 2021, and the acquisition of dialysis clinics at Fresenius Medical Care.
Cash flow development
Group operating cash flow increased to €1,226 million (Q3/20: €1,199 million) with a margin of 13.1% (Q3/20: 13.4%). Free cash flow before acquisitions and dividends increased correspondingly to €793 million (Q3/20: €682 million). Free cash flow after acquisitions and dividends increased to €594 million (Q3/20: -€185 million).
In Q1-3/21, Group operating cash flow decreased to €3,329 million (Q1-3/20: €5,159 million) with a margin of 12.1% (Q1-3/20: 19.1%). The decrease was mainly due to continued recoupment of the U.S. federal government’s payments under the CARES Act in Q2/20. Free cash flow before acquisitions and dividends decreased to €1,986 million (Q1-3/20: €3,593 million). Free cash flow after acquisitions and dividends decreased to €352 million (Q1-3/20: €2,149 million).
1 Net income attributable to shareholders of Fresenius SE & Co. KGaA
2 Before Special items
Solid balance sheet structure
Group total assets increased by 7% (4% in constant currency) to €71,081 million (Dec. 31, 2020: €66,646 million) given the expansion of business activities and currency effects. Current assets increased by 10% (7% in constant currency) to €17,334 million (Dec. 31, 2020: €15,772 million) driven by the increase of cash and cash equivalents, trade accounts receivables, and inventories. Non-current assets increased by 6% (3% in constant currency) to €53,747 million (Dec. 31, 2020: €50,874 million).
Total shareholders’ equity increased by 8% (4% in constant currency) to €28,186 million (Dec. 31, 2020: €26,023 million). The equity ratio was 39.7% (Dec. 31, 2020: 39.0%).
Group debt increased by 5% (3% in constant currency) to €27,191 million (Dec. 31, 2020: € 25,913 million). Group net debt increased by 3% (1% in constant currency) to € 24,778 million (Dec. 31, 2020: € 24,076 million).
As of September 30, 2021, the net debt/EBITDA ratio increased to 3.55x1,2 (Dec. 31, 2020: 3.44x1,2) driven by COVID-19 effects weighing on EBITDA as well as increased net debt. The improvement over June 30, 2021 (3.60x1,2) is driven by the reduction of net debt in Q3/21 due to the good cash flow performance.
1 At LTM average exchange rates for both net debt and EBITDA; pro forma closed acquisitions/divestitures
2 Before special items
For a detailed overview of special items please see the reconciliation table in the PDF document.
Business Segments
Fresenius Medical Care (Financial data according to Fresenius Medical Care press release)
Fresenius Medical Care is the world's largest provider of products and services for individuals with renal diseases. As of September 30, 2021, Fresenius Medical Care was treating approximately 345,000 patients in 4,151 dialysis clinics. Along with its core business, the Renal Care Continuum, the company focuses on expanding in complementary areas and in the field of critical care.
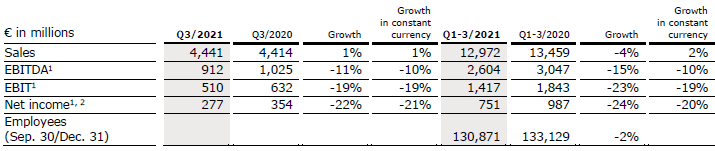
- Stronger than projected headwind from COVID-19 effects with significantly increased patient excess mortality due to global spread of Delta variant
- Organic growth continued with 1%
- Financial targets for FY 2021 confirmed, expectation to reach lower end of the guidance ranges for revenue and net income
Sales of Fresenius Medical Care increased by 1% (increased by 1% in constant currency) to €4,441 million (Q3/20: €4,414 million). Organic growth was 1%. In Q1-3/21, sales of Fresenius Medical Care decreased by 4% (increased by 2% in constant currency) to €12,972 million (Q1-3/20: €13,459 million). Thus, currency translation had a negative effect of 6%. Organic growth was 1%.
EBIT decreased by 20% (-19% in constant currency) to €505 million (Q3/20: €632 million) resulting in a margin of 11.4% (Q3/20: 14.3%). EBIT before special items declined by 19% to €510 million (-19% in constant currency; Q3/20: €632 million), resulting in a margin of 11.5% (Q3/20: 14.3%). The decline was mainly due to adverse COVID-19-related effects, inflationary cost increases and higher labor costs. These effects were slightly mitigated by an improved U.S. payor mix, in particular due to an increased number of patients with Medicare Advantage coverage.
In Q1-3/21, EBIT decreased by 24% (-20% in constant currency) to €1,403 million (Q1-3/20: €1,843 million) resulting in a margin of 10.8% (Q1-3/20: 13.7%). EBIT before special items decreased by 23% (-19% in constant currency) to €1,417 million (Q1-3/20: €1,843 million) resulting in an EBIT margin before special items of 10.9% (Q1-3/20: 13.7%).
1 Before special items
2 Net income attributable to shareholders of Fresenius Medical Care AG & Co. KGaA
For a detailed overview of special items please see the reconciliation tables in the PDF document.
Net income1 decreased by 23% (-22% in constant currency) to €273 million (Q3/20: €354 million) mainly due to effects explained for operating income and a higher tax rate. Net income1 before special items decreased by 22% (-21% in constant currency) to €277 million (Q3/20: €354 million).
In Q1-3/21, net income1 decreased by 25% (-21% in constant currency) to €741 million (Q1-3/20: €987 million). Net income1 before special items decreased by 24% (-20% in constant currency) to €751 million (Q1-3/20: €987 million).
Operating cash flow was €692 million (Q3/20: €746 million) with a margin of 15.6% (Q3/20: 16.9%). The decrease was mainly due to continued recoupment of the U.S. federal government’s payments in the second quarter of 2020 under the CARES Act. In Q1-3/21, operating cash flow was €1,820 million (Q1-3/20: €3,649 million) with a margin of 14.0% (Q1-3/20: 27.1%).
For FY/21, Fresenius Medical Care confirms its outlook for revenue2 to grow at a low-to-mid single-digit percentage rate and net income1,3 to decline at a high-teens to mid-twenties percentage rate against the 2020 base and is now expecting to be at the lower end of these guidance ranges4.
For further information, please see Fresenius Medical Care’s press release at http://www.freseniusmedicalcare.com.
1 Net income attributable to shareholders of Fresenius Medical Care AG & Co. KGaA
2 FY/20 base: €17,859 million
3 FY/20 base: €1,359 million, before special items; FY/21: before special items
4 These targets are based on the 2020 results excluding the impairment of goodwill and trade names in the Latin America Segment of €195 million. They are inclusive of anticipated COVID-19 effects, in constant currency and exclude special items. Special items include costs related to FME25 and other effects that are unusual in nature and have not been foreseeable or not foreseeable in size or impact at the time of giving guidance.
For a detailed overview of special items please see the reconciliation tables in the PDF document.
Fresenius Kabi
Fresenius Kabi offers intravenously administered generic drugs, clinical nutrition and infusion therapies for seriously and chronically ill patients in the hospital and outpatient environments. The company is also a leading supplier of medical devices and transfusion technology products. In the biosimilars business, Fresenius Kabi develops products with a focus on oncology and autoimmune diseases.
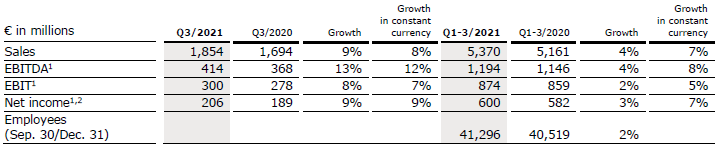
- North America with healthy organic sales growth; EBIT growth only hindered by a non-cash one-time effect
- Solid organic sales growth in Europe supported by ongoing recovery of elective treatments
- Continued strong Emerging Markets growth driven primarily by Latin America; China slowing down due to price effects post successful participation in VBP tenders
- EBIT outlook3 for FY/21 improved
Sales increased by 9% (8% in constant currency) to €1,854 million (Q3/20: €1,694 million). Organic growth was 8%. In Q1-3/21, sales increased by 4% (7% in constant currency) to €5,370 million (Q1-3/20: €5,161 million). Organic growth was 6%. Negative currency translation effects of 3% in Q1-3 were mainly related to the weakness of the US dollar, the Argentinian peso and the Brazilian real.
Sales in North America increased by 6% (organic: 6%) to €589 million (Q3/20: €558 million) driven by extra demand for COVID-19 related products. In Q1-3/21, sales in North America decreased by 9% (organic: -4%) to €1,669 million (Q1-3/20: €1,827 million).
Sales in Europe increased by 7% (organic: 5%) to €620 million (Q3/20: €581 million) supported by the ongoing recovery of elective treatments. In Q1-3/21, sales in Europe increased by 6% (organic: 5%) to €1,880 million (Q1-3/20: €1,778 million).
1 Before special items
2 Net income attributable to shareholders of Fresenius SE & Co. KGaA
3 In constant currency
For a detailed overview of special items please see the reconciliation tables in the PDF document.
Sales in Asia-Pacific increased by 12% (organic: 8%) to €447 million (Q3/20: €399 million) mainly due to normalizing elective treatment activity in the region. In China, organic growth is slowing down due to initial negative price effects from successful participation in VBP (Volume-Based Purchasing) tenders as well as the demanding prior-year base. In Q1-3/21, sales in Asia-Pacific increased by 17% (organic: 16%) to €1,248 million (Q1-3/20: €1,069 million).
Sales in Latin America/Africa increased by 27% (organic: 27%) to €198 million (Q3/20: €156 million) due to ongoing COVID-19 related extra demand. In Q1-3/21, sales in Latin America/Africa increased by 18% (organic: 26%) to €573 million (Q1-3/20: €487 million).
EBIT1 increased by 8% (7% in constant currency) to €300 million (Q3/20: €278 million) with an EBIT margin of 16.2% (Q3/20: 16.4%). The increase in constant currency was primarily driven by the Emerging Markets and European businesses, tempered by an IP R&D write-off in North America. Adjusted for this one-time effect, North America returned to healthy growth. EBIT was supported by positive COVID-19 effects. In Q1-3/21, EBIT1 increased by 2% (5% in constant currency) to €874 million (Q1-3/20: €859 million) with an EBIT margin of 16.3% (Q1-3/20: 16.6%).
Net income1,2 increased by 9% (9% in constant currency) to €206 million (Q3/201: €189 million). In Q1-3/21, net income1,2 increased by 3% (7% in constant currency) to €600 million (Q1-3/201: €582 million).
Operating cash flow increased to €393 million (Q3/20: €225 million) with a margin of 21.2% (Q3/20: 13.3%) mainly due to a healthy operational performance. In Q1-3/21, operating cash flow increased to €868 million (Q1-3/20: €836 million) with a margin of 16.2% (Q1-3/20: 16.2%).
For FY/21, Fresenius Kabi improves its EBIT outlook. The company now projects EBIT1,3 growth in constant currency around the top end of its low single-digit percentage guidance range. The company continues to expect organic sales growth4 in a low-to-mid single-digit percentage range. Both sales and EBIT outlook include expected COVID-19 effects.
1 Before special items
2 Net income attributable to shareholders of Fresenius SE & Co. KGaA
3 FY/20 base: €1,095 million, before special items; FY/21: before special items
4 FY/20 base: €6,976 million
For a detailed overview of special items please see the reconciliation tables in the PDF document.
Fresenius Helios
Fresenius Helios is Europe's leading private hospital operator. The company comprises Helios Germany and Helios Spain. Helios Germany operates 89 hospitals, ~130 outpatient centers and 6 prevention centers. Helios Spain operates 47 hospitals, 86 outpatient centers and around 300 occupational risk prevention centers. In addition, the company is active in Latin America with 6 hospitals and as a provider of medical diagnostics and reproduction medicine worldwide.
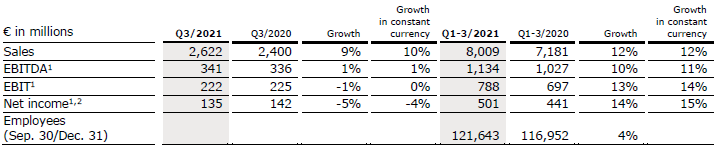
- Helios Germany with ongoing upward trend for elective treatments
- Treatment activity at Helios Spain above pre-pandemic levels in most medical areas
- Strong results in Latin America
- FY/21 outlook confirmed
Sales increased by 9% (10% in constant currency) to €2,622 million (Q3/20: €2,400 million). Organic growth was 5%. Acquisitions, including the hospital acquisitions from the Order of Malta in Germany and the fertility business Eugin (consolidated as from April 1, 2021) contributed 5% to sales growth. In Q1-3/21, sales increased by 12% (12% in constant currency) to €8,009 million (Q1-3/20: €7,181 million). Organic growth was 7%. Acquisitions contributed 5% to sales growth.
Sales of Helios Germany increased by 7% (organic: 3%) to €1,640 million (Q3/20: €1,529 million) driven by positive price and case mix effects. The hospital acquisitions from the Order of Malta contributed 4% to sales growth. In Q1-3/21, sales of Helios Germany increased by 6% (organic: 2%) to €4,988 million (Q1-3/20: €4,703 million).
Sales of Helios Spain increased by 8% (9% in constant currency) to €941 million (Q3/20: €870 million). Organic growth of 8% was driven by a consistently high level of treatments and ongoing demand for occupational risk prevention (ORP) services. Furthermore, the hospitals in Latin America showed a good development and contributed 2% to sales growth. In Q1-3/21, sales of Helios Spain increased by 19% (20% in constant currency) to €2,937 million (Q1-3/20: €2,476 million). Organic growth was 18%.
1 Before special items
2 Net income attributable to shareholders of Fresenius SE & Co. KGaA
For a detailed overview of special items please see the reconciliation tables in the PDF document.
EBIT1 of Fresenius Helios decreased by 1% (0% in constant currency) to €222 million (Q3/20: €225 million) due to the demanding prior-year base at Helios Spain. The EBIT1 margin was 8.5% (Q3/20: 9.4%). In Q1-3/21, EBIT1 of Fresenius Helios increased by 13% (14% in constant currency) to €788 million (Q1-3/20: €697 million) with an EBIT margin1 of 9.8% (Q1-3/20: 9.7%).
EBIT1 of Helios Germany increased by 5% to €140 million (Q3/20: €133 million) with an EBIT margin1 of 8.5% (Q3/20: 8.7%). In Q1-3/21, EBIT1 of Helios Germany decreased by 1% to €442 million (Q1-3/20: €445 million) with an EBIT margin1 of 8.9% (Q1-3/20: 9.5%).
EBIT of Helios Spain decreased by 17% (-17% in constant currency) to €79 million (Q3/20: €95 million) due to an exceptional Q3/20 driven by post-lock-down catch-up effects. In addition, higher costs for personnel, personal protective equipment and selected medical products, among others, had a negative impact. The EBIT margin was 8.4% (Q3/20: 10.9%). The hospital acquisitions in Colombia contributed nicely. In Q1-3/21, EBIT of Helios Spain increased by 35% (36% in constant currency) to €352 million (Q1-3/20: €261 million) with an EBIT margin of 12.0% (Q1-3/20: 10.5%).
Net income1,2 decreased by 5% (-4% in constant currency) to €135 million (Q3/20: €142 million). In Q1-3/21, net income1,2 increased by 14% (15% in constant currency) to €501 million (Q1-3/20: €441 million).
Operating cash flow decreased to €157 million (Q3/20: €275 million) with a margin of 6.0% (Q3/20: 11.5%) as the previous year was supported by the accelerated payment scheme under the German law to ease the financial burden on hospitals. In Q1-3/21, operating cash flow decreased to €595 million (Q1-3/20: €715 million) with a margin of 7.4% (Q1-3/20: 10.0%).
For FY/21, Fresenius Helios confirms its outlook. The company expects organic sales3 growth in a mid single-digit percentage range. EBIT4 is projected to grow in a high single-digit percentage range in constant currency. Both sales and EBIT outlook include expected COVID-19 effects.
1 Before special items
2 Net income attributable to shareholders of Fresenius SE & Co. KGaA
3 FY/20 base: €9,818 million
4 FY/20 base: €1,025 million; FY/21 before special items
For a detailed overview of special items please see the reconciliation tables in the PDF document.
Fresenius Vamed
Fresenius Vamed manages projects and provides services for hospitals and other health care facilities worldwide and is a leading post-acute care provider in Central Europe. The portfolio ranges along the entire value chain: from project development, planning, and turnkey construction, via maintenance and technical management to total operational management.
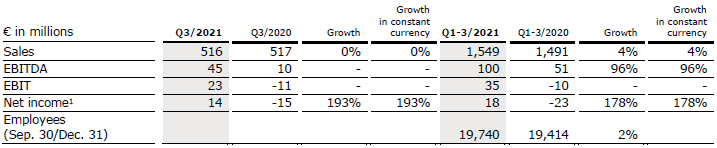
- Further acceleration of EBIT growth despite persistent COVID-19 impacts
- Project business still marked by COVID-19; order book remains at all-time high
- Good performance, particularly in the high-end service business; upward trend in elective treatments supports rehabilitation business
- FY/21 outlook confirmed
Sales remained stable (0% in constant currency and organic) at €516 million (Q3/20: €517 million). In Q1-3/21, sales increased by 4% (4% in constant currency) to €1,549 million (Q1-3/20: €1,491 million). Organic growth was 4%.
Sales in the service business increased by 9% (9% in constant currency) to €410 million (Q3/20: €377 million), driven by high-end services and growing case numbers in the rehabilitation business. Sales in the project business decreased by 24% (24% in constant currency) to €106 million (Q3/20: €140 million). In Q1-3/21, sales in the service business increased by 10% (10% in constant currency) to €1,165 million (Q1-3/20: €1,063 million). Sales in the project business decreased by 10% (-10% in constant currency) to €384 million (Q1-3/20: €428 million).
EBIT increased to €23 million (Q3/20: -€11 million) with an EBIT margin of 4.5% (Q3/20: -2.1%). In Q1-3/21, EBIT increased to €35 million (Q1-3/20: -€10 million) with an EBIT margin of 2.3% (Q1-3/20: -0.7%).
Net income1 increased to €14 million (Q3/20: -€15 million). In Q1-3/21, net income1 increased to €18 million (Q1-3/20: -€23 million).
1 Net income attributable to shareholders of VAMED AG
Order intake was €120 million in Q3/21 (Q3/20: €188 million) and €971 million in Q1-3/21 (Q1-3/20: €362 million), particularly driven by a turnkey project for a hospital in Wiener Neustadt, Austria. As of September 30, 2021, order backlog of €3,647 million (December 31, 2020: €3,055 million) remained at an all-time high.
Operating cash flow increased to €9 million (Q3/20: -€4 million) with a margin of 1.7% (Q3/20: -0.8%) mainly due to payments from the international project business. In Q1-3/21, operating cash flow increased to €23 million (Q1-3/20: €4 million) with a margin of 1.5% (Q1-3/20: 0.3%).
For FY/21, Fresenius Vamed confirms its outlook. The company expects organic sales1 growth in a mid-to-high single-digit percentage range and EBIT2 to grow to a high double-digit Euro million amount. Both sales and EBIT outlook include expected COVID-19 effects.
1 FY/20 base: €2,068 million
2 FY/20 base: €29 million; FY/21 before special items
Conference Call
As part of the publication of the results for Q3/21, a conference call will be held on November 2, 2021 at 1:30 p.m. CET (8:30 a.m. EDT). All investors are cordially invited to follow the conference call in a live broadcast over the Internet at www.fresenius.com/investors. Following the call, a replay will be available on our website.
For additional information on the performance indicators used please refer to our website www.fresenius.com/alternative-performance-measures.
This release contains forward-looking statements that are subject to various risks and uncertainties. Future results could differ materially from those described in these forward-looking statements due to certain factors, e.g. changes in business, economic and competitive conditions, regulatory reforms, results of clinical trials, foreign exchange rate fluctuations, uncertainties in litigation or investigative proceedings, and the availability of financing. Fresenius does not undertake any responsibility to update the forward-looking statements in this release.
Helios Germany has published its second sustainability report. The 60 pages report "Strong into the future" looks back on the complex challenges of the Corona year 2020 and shows in which areas the pandemic has driven developments for Germany’s largest private hospital operator. Helios Germany has defined four fields for its sustainability strategy: Patients, employees, the environment and compliance. Like the first report in 2019, it was drawn up based on the GRI standards of the Global Reporting Initiative and is now available in German on www.helios-gesundheit.de/nachhaltigkeit. An English version will be published soon.
- Fresenius Medical Care with expected continued COVID-19 impact; patient excess mortality rates significantly reduced
- Fresenius Kabi’s strong Emerging Markets business more than offsets persistent headwinds in North America
- Helios Germany with gradually increasing elective treatment volumes; Helios Spain delivers outstanding sales and earnings growth based on strong activity levels and a weak prior-year quarter
- Fresenius Vamed back to growth driven by good performance in the service business; growing order book in the project business
- First savings from initiatives to improve efficiency already expected in 2021
If no timeframe is specified, information refers to Q2/2021.

1 Before special items
2 Net income attributable to shareholders of Fresenius SE & Co. KGaA
For a detailed overview of special items please see the reconciliation table in the PDF document.
Stephan Sturm, CEO of Fresenius, said: “Overall, our interim result for the 2021 business year is very strong. We have achieved very healthy sales and earnings growth, despite the ongoing impact of the pandemic. Our businesses are developing well, and we are making good progress on our initiatives for profitable growth and increased efficiency. The increased vaccination rates in many of our important markets are encouraging, but of course the pandemic is not over yet. We must remain vigilant and will continue to monitor the infection situation very closely. Nevertheless, there are reasons for us to be optimistic: Our growth drivers are intact, good health is and will remain of paramount importance to everyone. We will continue the review of our structures, and to drive efficiency measures along with our growth initiatives. The resulting benefits will allow us to sustainably develop our healthcare group even more successfully.”
COVID-19 assumptions for guidance FY/21
Whilst the pandemic exhibited a quite differentiated regional development, negative COVID-effects have - consistent with expectations - generally receded during Q2/21.
Fresenius had projected that the burdens and constraints caused by the pandemic will recede in the second half of the year. Now, however, the currently rising number of COVID-19 cases, the further evolution of COVID-19 virus mutations as well as stalling vaccination progress could all pose a threat to this assumption, and the company remains vigilant.
Whilst the risk of renewed far-reaching containment measures in one or more of Fresenius’ major markets currently appears less likely, it cannot be excluded. Any resulting significant and direct impact on the health care sector without appropriate compensation is not reflected in the Group’s FY/21 guidance. These assumptions are subject to considerable uncertainty.
FY/21 Group earnings guidance raised
Based on the Group’s strong Q2/21 and the progress in the program to improve Group-wide efficiencies, where the company expects first savings already this year, Fresenius raises its 2021 earnings guidance. The Company now projects net income1,2 to grow in a low single-digit percentage range in constant currency. Previously, Fresenius expected an at least broadly stable net income1,2 development in constant currency. The Company continues to project sales growth3 in a low-to-mid single-digit percentage range in constant currency.
Implicitly, net income1 for the Group excluding Fresenius Medical Care is now expected to grow in a high single-digit percentage range in constant currency. Previously, Fresenius expected mid-to-high single-digit percentage growth in constant currency.
The guidance implies ongoing COVID-19 related headwinds in the second half of the year. It reflects negative pricing effects related to tender activity at Fresenius Kabi in China as well as increasingly noticeable cost inflation effects across selected markets.
Fresenius projects net debt/EBITDA4 to be around the top-end of the self-imposed target corridor of 3.0x to 3.5x by the end of FY/21.
1 Net income attributable to shareholders of Fresenius SE & Co. KGaA
2 FY/20 base: €1,796 million, before special items; FY/21: before special items
3 FY/20 base: €36,277 million
4 At LTM average exchange rates for both net debt and EBITDA; pro forma closed acquisitions/divestitures; excluding further potential acquisitions; before special items
For a detailed overview of special items please see the reconciliation table in the PDF document.
Progress on efficiency measures to sustainably improve profitability
To sustainably enhance profitability and operational excellence, Fresenius has launched group-wide efficiency initiatives. These measures are expected to gradually result in cost savings of more than €100 million p.a. after tax and minority interest in 2023, with some potential to increase thereafter.
While an update on the comprehensive operating model review at Fresenius Medical Care is expected to be provided in fall 2021, the three other Fresenius business segments have already identified and launched initiatives in defined areas.
At Fresenius Kabi, these initiatives comprise the optimization of its production network, reduction of product portfolio complexity, centralization of worldwide purchasing and review of organizational and cost structures.
Fresenius Helios will put a focus on its strategic review of the hospital portfolio and ambulatory care network as well as on the reduction of G&A costs.
Fresenius Vamed will implement some dedicated structural and organizational measures, comprising the optimization of its global subsidiary structure, the review of its assets and shareholdings portfolio and the optimization of procurement and G&A costs.
These activities specific to the business segments will be complemented and supported by initiatives on the Fresenius group level, for example, the implementation of new ways of working at the corporate headquarters as well as a group-wide review of the IT operating model.
Achieving these sustainable efficiencies will require significant up-front expenses. For the years 2021 to 2023, those expenses are expected to be more than €100 million p.a. after tax and minority interest on average, with the largest portion currently expected to materialize in 2022. They will be classified as special items, consistent with previous practice.
The company expects significant contributions from all four business segments and from the corporate center in the 2021 to 2023 period. Hence, it is expected that the savings contributed by Fresenius Medical Care will not be overproportional.
For FY/21, initial low double-digit million € savings after tax and minority interest from the Group’s above outlined cost and efficiency measures are expected to support the Group’s profitability. These savings and efficiency gains derive from activities in all four business segments.
Stephan Sturm, CEO of Fresenius, said: “We examine possible cost reductions with great care; and we implement them in a very targeted way, with a sense of proportion. We are saving because we have goals and want to realize them: We want to give ever more people access to ever better medicine. We want to contribute to keeping – or making – people healthy, to helping people enjoy their lives despite an illness. That is why we have a responsibility to use our valuable resources carefully. We will prioritize resources where they can have the biggest impact, remove duplication, and stop activities where results are not satisfying. This fitness program will benefit everyone: Our patients, the healthcare system, our employees and our shareholders.”
8% sales increase in constant currency
Group sales increased by 4% (8% in constant currency) to €9,246 million (Q2/20: €8,920 million). Organic growth was 6%. Acquisitions/divestitures contributed net 2% to growth. Currency translation reduced sales growth by 4%. Excluding estimated COVID-19 effects1, Group sales growth would have been 6% to 7% in constant currency. In H1/21, Group sales increased by 1% (6% in constant currency) to €18,230 million (H1/20: €18,055 million). Organic growth was 4%. Acquisitions/divestitures contributed net 2% to growth. Currency translation reduced sales growth by 5%. Excluding estimated COVID-19 effects1, Group sales growth would have been 5% to 6% in constant currency.
20% net income2,3 increase in constant currency
Group EBITDA before special items decreased by 5% (0% in constant currency) to €1,671 million (Q2/20: €1,762 million). Reported Group EBITDA was €1,662 million (Q2/20: €1,762 million).
In H1/21, Group EBITDA before special items decreased by 6% (-1% in constant currency) to €3,302 million (H1/20: €3,517 million). Reported Group EBITDA was €3,290 million (H1/20: €3,517 million).
Group EBIT before special items decreased by 8% (-4% in constant currency) to €1,030 million (Q2/20: €1,123 million). The constant currency decrease is primarily due to COVID-19 related headwinds at Fresenius Medical Care. The EBIT margin before special items was 11.1% (Q2/20: 12.6%). Reported Group EBIT was €1,021 million (Q2/20: €1,123 million).
In H1/21, Group EBIT before special items decreased by 9% (-5% in constant currency) to €2,039 million (H1/20: €2,248 million). The constant currency decrease is primarily due to COVID-19 related headwinds at Fresenius Medical Care. The EBIT margin before special items was 11.2% (Q1/20: 12.5%). Reported Group EBIT was €2,027 million (H1/20: €2,248 million).
1 For estimated COVID-19 effects please see table in the PDF document
2 Before special items
3 Net income attributable to shareholders of Fresenius SE & Co. KGaA
For a detailed overview of special items please see the reconciliation table in the PDF document.
Group net interest before special items and reported net interest improved to -€121 million (Q2/202: -€167 million) mainly due to successful refinancing activities, lower interest rates as well as currency translation effects. In H1/21, Group net interest before special items improved to -€258 million (H1/202: -€341 million). Reported Group net interest improved to -€258 million (H1/20: -€349 million).
Group tax rate before special items was 21.5% (Q2/202: 23.5%) while reported Group tax rate was 21.3% (Q2/20: 23.4%). In H1/21, Group tax rate before special items was 22.1% (H1/202: 23.1%) while reported Group tax rate was 22.0% (H1/20: 23.0%).
Noncontrolling interests before special items were -€240 million (Q2/20: -€321 million) of which 89% were attributable to the noncontrolling interests in Fresenius Medical Care. Reported noncontrolling interests were -€237 million (Q2/20: -€321 million). In H1/21, noncontrolling interests before special items were -€477 million (H1/20: -€592 million) of which 92% were attributable to the noncontrolling interests in Fresenius Medical Care. Reported noncontrolling interests were -€473 million (Q2/20: -€592 million).
Group net income1 before special items increased by 16% (20% in constant currency) to €474 million (Q2/202: €410 million) driven by Helios Spain, Kabi’s Emerging Markets business as well as the favorable net interest development. Excluding estimated COVID-19 effects3, Group net income1 before special items would have grown 10% to 14% in constant currency. Reported Group net income1 increased to €471 million (Q2/20: €411 million).
In H1/21, Group net income1 before special items increased by 4% (8% in constant currency) to €910 million (H1/202: €875 million). Excluding estimated COVID-19 effects3, Group net income1 before special items would have grown 4% to 8% in constant currency. Reported Group net income1 increased to €906 million (H1/20: €870 million).
1 Net income attributable to shareholders of Fresenius SE & Co. KGaA
2 Before special items
3 For estimated COVID-19 effects please see table in the PDF document.
For a detailed overview of special items please see the reconciliation table in the PDF document.
Earnings per share1 before special items increased by 15% (19% in constant currency) to €0.85 (Q2/202: €0.74). Reported earnings per share1 were €0.84 (Q2/20: €0.74). In H1/21, earnings per share1 before special items increased by 4% (8% in constant currency) to €1.63 (H1/202: €1.57). Reported earnings per share1 were €1.62 (H1/20: €1.56).
Continued investment in growth
Spending on property, plant and equipment was €509 million corresponding to 6% of sales (Q2/20: €474 million; 5% of sales). These investments served primarily for the modernization and expansion of dialysis clinics, production facilities as well as hospitals and day clinics. In H1/21, spending on property, plant and equipment was €893 million corresponding to 5% of sales (H1/20: €1,021 million; 6% of sales).
Total acquisition spending was €491 million (Q2/20: €97 million) mainly for the acquisition of Eugin Group at Fresenius Helios which has been consolidated since April 1, 2021, and the acquisition of dialysis clinics at Fresenius Medical Care. In H1/21, total acquisition spending was €640 million (H1/20: €509 million).
Cash flow development
Group operating cash flow decreased to €1,451 million (Q2/20: €3,082 million) with a margin of 15.7% (Q2/20: 34.6%). The decline was mainly due to the U.S. federal government’s payments in Q2/20 under the CARES Act, the start of recoupment of these advanced payments in Q2/21 as well as the timing of certain other expense payments in 2021 at Fresenius Medical Care. Free cash flow before acquisitions and dividends decreased correspondingly to €952 million (Q2/20: €2,606 million). Free cash flow after acquisitions and dividends decreased to -€359 million (Q2/20: €2,374 million).
In H1/21, Group operating cash flow decreased to €2,103 million (H1/20: €3,960 million) with a margin of 11.5% (H1/20: 21.9%). Free cash flow before acquisitions and dividends decreased to €1,193 million (H1/20: €2,911 million). Free cash flow after acquisitions and dividends decreased to -€242 million (H1/20: €2,334 million).
1 Net income attributable to shareholders of Fresenius SE & Co. KGaA
2 Before Special items
Solid balance sheet structure
Group total assets increased by 5% (3% in constant currency) to €69,655 million (Dec. 31, 2020: €66,646 million) given the expansion of business activities and currency effects. Current assets increased by 7% (6% in constant currency) to €16,901 million (Dec. 31, 2020: €15,772 million) mainly driven by the increase of trade accounts receivables, cash and cash equivalents and inventories. Non-current assets increased by 4% (2% in constant currency) to €52,754 million (Dec. 31, 2020: €50,874 million).
Total shareholders’ equity increased by 4% (2% in constant currency) to €27,131 million (Dec. 31, 2020: €26,023 million). The equity ratio was 39.0% (Dec. 31, 2020: 39.0%).
Group debt increased by 5% (4% in constant currency) to €27,289 million (Dec. 31, 2020: € 25,913 million). Group net debt increased by 4% (3% in constant currency) to € 25,039 million (Dec. 31, 2020: € 24,076 million).
As of June 30, 2021, the net debt/EBITDA ratio increased to 3.60x1,2 (Dec. 31, 2020: 3.44x1,2) driven by COVID-19 effects weighing on EBITDA as well as increased net debt.
1 At LTM average exchange rates for both net debt and EBITDA; pro forma closed acquisitions/divestitures
2 Before special items
For a detailed overview of special items please see the reconciliation table in the PDF document.
Business Segments
Fresenius Medical Care (Financial data according to Fresenius Medical Care press release)
Fresenius Medical Care is the world's largest provider of products and services for individuals with renal diseases. As of June 30, 2021, Fresenius Medical Care was treating approximately 346,000 patients in more than 4,100 dialysis clinics. Along with its core business, the Renal Care Continuum, the company focuses on expanding in complementary areas and in the field of critical care.

• As assumed, COVID-19 pandemic continued to impact organic growth in dialysis and downstream businesses; patient excess mortality rates significantly reduced
• Negative exchange rate effects continue
• Earnings development impacted by phasing and strong prior-year base, as indicated
• Financial targets for FY 2021 confirmed
Sales of Fresenius Medical Care decreased by 5% (increased by 2% in constant currency) to €4,320 million (Q2/20: €4,557 million). Thus, currency translation had a negative effect of 7%. Organic growth was 1%. In H1/21, sales of Fresenius Medical Care decreased by 6% (increased by 2% in constant currency) to €8,530 million (H1/20: €9,045 million). Thus, currency translation had a negative effect of 8%. Organic growth was 1%.
EBIT decreased by 35% (-30% in constant currency) to €424 million (Q2/20: €656 million) resulting in a margin of 9.8% (Q2/20: 14.4%). EBIT before special items declined by 34% to €430 million (-29% in constant currency; Q2/20: €656 million), resulting in a margin of 10.0% (Q2/20: 14.4%). The decrease was mainly due to the adverse impact of the COVID-19 pandemic, including a high prior-year base as a result of government relief funding, the expected phasing and increase in Sales, General and Administrative expense, negative exchange rate effects and higher direct costs. These effects were partially offset in particular by an improved Medicare Advantage payor mix in the U.S.
1 Before special items
2 Net income attributable to shareholders of Fresenius Medical Care AG & Co. KGaA
For a detailed overview of special items please see the reconciliation table in the PDF document.
In H1/21, EBIT decreased by 26% (-20% in constant currency) to €898 million (H1/20: €1,211 million) resulting in a margin of 10.5% (H1/20: 13.4%). EBIT before special items decreased by 25% (-19% in constant currency) to €907 million (Q2/20: €1,211 million) resulting in an EBIT margin excluding special items of 10.6% (H1/20: 13.4%).
Net income1 decreased by 38% (-33% in constant currency) to €219 million (Q2/20: €351 million). Net income1 before special items decreased by 37% (-31% in constant currency) to €223 million (Q2/20: €351 million).
In H1/21, net income1 decreased by 26% (-21% in constant currency) to €468 million (H1/20: €634 million). Net income1 before special items decreased by 25% (-20% in constant currency) to €474 million (H1/20: €634 million).
Operating cash flow was €921 million (Q2/20: €2,319 million) with a margin of 21.3% (Q2/20: 50.9%). The decline was mainly due to the U.S. federal government’s payments in Q2/20 under the CARES Act, the start of recoupment of these advanced payments in Q2/21 as well as the timing of certain other expense payments in 2021. In H1/21, operating cash flow was €1,129 million (H1/20: €2,903 million) with a margin of 13.2% (H1/20: 32.1%).
For FY/21, Fresenius Medical Care confirms its outlook as outlined in February 2021. The Company expects revenue2 to grow at a low-to-mid single-digit percentage range and net income1,3 to decline at a high-teens to mid-twenties percentage range against the 2020 base4. This outlook is based on the assumption of a return to normalized mortality rates in H2/21.
For further information, please see Fresenius Medical Care’s press release at www.freseniusmedicalcare.com.
1 Net income attributable to shareholders of Fresenius Medical Care AG & Co. KGaA
2 FY/20 base: €17,859 million
3 FY/20 base: €1,359 million, before special items; FY/21: before special items
4 These targets are based on the 2020 results excluding the impairment of goodwill and trade names in the Latin America Segment of €195 million. They are inclusive of anticipated COVID-19 effects, in constant currency and exclude special items. Special items include costs related to FME25 and other effects that are unusual in nature and have not been foreseeable or not foreseeable in size or impact at the time of giving guidance.
For a detailed overview of special items please see the reconciliation table in the PDF document.
Fresenius Kabi
Fresenius Kabi offers intravenously administered generic drugs, clinical nutrition and infusion therapies for seriously and chronically ill patients in the hospital and outpatient environments. The company is also a leading supplier of medical devices and transfusion technology products. In the biosimilars business, Fresenius Kabi develops products with a focus on oncology and autoimmune diseases.

• North America performance impacted by COVID-19 and competitive pressure; effects of temporary manufacturing issues receding
• Normalizing demand in Europe driving strong growth over a COVID-impacted base
• Very strong Emerging Markets growth; China with strong performance given more normalized elective treatment activity
• Outlook improved to low single-digit constant currency EBIT percentage growth
Sales increased by 5% (8% in constant currency) to €1,755 million (Q2/20: €1,678 million). Organic growth was 7%. In H1/21, sales increased by 1% (6% in constant currency) to €3,516 million (H1/20: €3,467 million). Organic growth was 5%. Negative currency translation effects of 3% in Q2 and 5% in H1 were mainly related to the weakness of the US dollar, the Argentinian peso and the Brazilian real.
Sales in North America decreased by 13% (organic growth: -6%) to €522 million (Q2/20: €600 million). The decrease was driven by reduced volume demand given fewer elective treatments, consequential competitive pressure and, albeit receding, temporary manufacturing issues. These negative effects outweighed extra demand for COVID-19 related products. In H1/21, sales in North America decreased by 15% (organic growth: -8%) to €1,080 million (H1/20: €1,269 million).
Sales in Europe increased by 12% (organic growth: 10%) to €634 million (Q2/20: €566 million) supported by a low prior-year basis meaningfully impacted by COVID-19. In H1/21, sales in Europe increased by 5% (organic growth: 4%) to €1,260 million (H1/20: €1,197 million).
1 Before special items
2 Net income attributable to shareholders of Fresenius SE & Co. KGaA
Sales in Asia-Pacific increased by 17% (organic growth: 17%) to €409 million (Q2/20: €351 million). The growth is mainly due to more normalized elective treatment activity in China as well as a recovery in other Asian markets. In H1/21, sales in Asia-Pacific increased by 20% (organic growth: 21%) to €801 million (H1/20: €670 million).
Sales in Latin America/Africa increased by 18% (organic growth: 24%) to €190 million (Q2/20: €161 million) due to ongoing COVID-19 related extra demand. In H1/21, sales in Latin America/Africa increased by 13% (organic growth: 26%) to €375 million (H1/20: €331 million).
EBIT1 increased by 2% (7% in constant currency) to €298 million (Q2/20: €292 million) with an EBIT margin of 17.0% (Q2/20: 17.4%). The increase in constant currency was tempered by underutilized production capacities in the US and competitive pressure coupled with selective supply constraints due to temporary, however receding, manufacturing issues. EBIT was supported by positive COVID-19 effects, lower corporate costs due to travel restrictions and phasing of projects. In H1/21, EBIT1 decreased by 1% (increased by 4% in constant currency) to €574 million (H1/20: €581 million) with an EBIT margin of 16.3% (H1/20: 16.8%).
Net income1,2 increased by 4% (9% in constant currency) to €204 million (Q2/201: €196 million). In H1/21, net income1,2 remained stable (increased by 6% in constant currency) at €394 million (H1/201: €393 million).
Operating cash flow decreased to €197 million (Q2/20: €437 million) with a margin of 11.2% (Q2/20: 26.0%) mainly due to the phasing of tax payments and payments for legal proceedings. In H1/21, operating cash flow decreased to €475 million (H1/20: €611 million) with a margin of 13.5% (H1/20: 17.6%).
For FY/21, Fresenius Kabi improves its EBIT outlook. The company now projects EBIT3 to grow in a low single-digit percentage range in constant currency. Previously, Fresenius Kabi expected a stable EBIT3 development up to low single-digit percentage growth. The company continues to expect organic sales growth4 in a low-to-mid single-digit percentage range. Both sales and EBIT outlook include expected COVID-19 effects.
1 Before special items
2 Net income attributable to shareholders of Fresenius SE & Co. KGaA
3 FY/20 base: €1,095 million, before special items; FY/21: before special items
4 FY/20 base: €6,976 million
Fresenius Helios
Fresenius Helios is Europe's leading private hospital operator. The company comprises Helios Germany and Helios Spain. Helios Germany operates 89 hospitals, ~130 outpatient centers and 6 prevention centers. Helios Spain operates 47 hospitals, 74 outpatient centers and around 300 occupational risk prevention centers. In addition, the company is active in Latin America with 6 hospitals and as a provider of medical diagnostics and reproduction medicine worldwide.

• Gradually recovering elective treatments at Helios Germany
• Excellent treatment activity at Helios Spain results in outstanding organic sales and earnings growth over a weak prior year quarter
• Growth additionally fueled by contributions from acquisitions in Germany and Latin America as well as from the acquired fertility business
• Outlook improved for organic sales and constant currency EBIT growth
Sales increased by 18% (19% in constant currency) to €2,738 million (Q2/20: €2,315 million). Organic growth was 14%. Acquisitions, including the fertility business Eugin, (consolidated as from 1 April 2021), contributed 5% to sales growth. In H1/21, sales increased by 13% (13% in constant currency) to €5,387 million (H1/20: €4,781 million). Organic growth was 9%. Acquisitions contributed 4% to sales growth.
Sales of Helios Germany increased by 7% (organic growth: 3%) to €1,675 million (Q2/20: €1,571 million) driven by a gradual recovery of elective treatments and positive case mix effects. The hospital acquisitions from the Order of Malta contributed 4% to sales growth. In H1/21, sales of Helios Germany increased by 5% (organic growth: 1%) to €3,348 million (H1/20: €3,174 million). COVID-19 effects were mostly mitigated by government compensation.
Sales of Helios Spain increased by 37% (38% in constant currency) to €1,020 million (Q2/20: €743 million) over a weak COVID-19 impacted prior-year quarter. Organic growth of 38% was driven by a consistently high level of treatments and ongoing demand for occupational risk prevention (ORP) services. The Latin American hospitals contributed 5% to sales growth. In H1/21, sales of Helios Spain increased by 24% (26% in constant currency) to €1,996 million (H1/20: €1,606 million). Organic growth was 24%.
1 Net income attributable to shareholders of Fresenius SE & Co. KGaA
EBIT of Fresenius Helios increased by 51% (51% in constant currency) to €298 million (Q2/20: €198 million) with an EBIT margin of 10.9% (Q2/20: 8.6%). In H1/21, EBIT of Fresenius Helios increased by 20% (20% in constant currency) to €566 million (H1/20: €472 million) with an EBIT margin of 10.5% (H1/20: 9.9%).
EBIT of Helios Germany increased by 3% to €152 million (Q2/20: €147 million) with an EBIT margin of 9.1% (Q2/20: 9.4%). In H1/21, EBIT of Helios Germany decreased by 3% to €302 million (H1/20: €312 million) with an EBIT margin of 9.0% (H1/20: 9.8%). Government compensation broadly mitigated COVID-19 effects.
EBIT of Helios Spain increased by 172% (174% in constant currency) to €147 million (Q2/20: €54 million) over a weak COVID-19 impacted prior-year quarter. EBIT margin improved to 14.4% (Q2/20: 7.3%). Healthy organic sales growth led to an improved coverage of the fixed cost base. The hospital acquisitions in Colombia contributed nicely. In H1/21, EBIT of Helios Spain increased by 64% (66% in constant currency) to €273 million (H1/20: €166 million) with an EBIT margin of 13.7% (H1/20: 10.3%).
Net income1 increased by 57% (59% in constant currency) to €193 million (Q2/20: €123 million). In H1/21, net income1 increased by 22% (23% in constant currency) to €366 million (H1/20: €299 million).
Operating cash flow decreased to €223 million (Q2/20: €295 million) with a margin of 8.1% (Q1/20: 12.7%) resulting from the strong cash collection in Q2/20 related to accelerated payments of treatment invoices under the German law to ease the financial burden on hospitals. In H1/21, operating cash flow was on prior year level at €438 million (H1/20: €440 million) with a margin of 8.1% (H1/20: 9.2%).
For FY/21, Fresenius Helios improves its outlook: The company now expects organic sales2 growth in a mid single-digit percentage range. Previously, organic sales2 were expected to grow in a low-to-mid single-digit percentage range. Moreover, Fresenius Helios now projects EBIT3 to grow in a high single-digit percentage range in constant currency. Previously, EBIT3 was expected to grow in a mid- to high single-digit percentage range in constant currency. Both sales and EBIT outlook include expected COVID-19 effects.
1 Net income attributable to shareholders of Fresenius SE & Co. KGaA
2 FY/20 base: €9,818 million
3 FY/20 base: €1,025 million; FY/21 before special items
Fresenius Vamed
Fresenius Vamed manages projects and provides services for hospitals and other health care facilities worldwide and is a leading post-acute care provider in Central Europe. The portfolio ranges along the entire value chain: from project development, planning, and turnkey construction, via maintenance and technical management to total operational management.

• Back to sales and earnings growth despite negative COVID-19 effects
• Project business still marked by COVID-19 but showing clear signs of recovery
• Good performance in the service business; rehabilitation business improving as number of elective surgeries increased
• Excellent order intake
Sales increased by 17% (17% in constant currency) to €556 million (Q2/20: €475 million). Organic growth was 17%. In H1/21, sales increased by 6% (6% in constant currency) to €1,033 million (H1/20: €974 million). Organic growth was 6%.
Sales in the service business improved by 19% (19% in constant currency) to €392 million (Q2/20: €329 million), in particular driven by growing case numbers in the rehabilitation business. Sales in the project business increased by 12% (12% in constant currency) to €164 million (Q2/20: €146 million). In H1/21, sales in the service business increased by 10% (10% in constant currency) to €755 million (H1/20: €686 million). Sales in the project business decreased by 3% (-3% in constant currency) to €278 million (H1/20: €288 million).
EBIT increased to €16 million (Q2/20: -€13 million) with an EBIT margin of 2.9% (Q2/20:
-2.7%). In H1/21, EBIT increased to €12 million (H1/20: €1 million) with an EBIT margin of 1.2% (H1/20: 0.1%).
Net income1 increased to €11 million (Q2/20: -€15 million). In H1/21, net income1 increased to €4 million (H1/20: -€8 million).
1 Net income attributable to shareholders of VAMED AG
Order intake was outstanding with €713 million (Q2/20: €50 million) and €851 million in H1/21 (H1/20: €174 million), particularly driven by a turnkey project for a hospital in Wiener Neustadt, Austria. As of June 30, 2021, order backlog was at €3,635 million (December 31, 2020: €3,055 million).
Operating cash flow increased to €58 million (Q2/20: €28 million) with a margin of 10.4% (Q1/20: 5.9%) mainly due to payments from the international project business. In H1/21, operating cash flow increased to €14 million (H1/20: €8 million) with a margin of 1.4% (H1/20: 0.8%).
For FY/21, Fresenius Vamed confirms its outlook and expects organic sales1 growth in a mid-to-high single-digit percentage range and EBIT2 to grow to a high double-digit Euro million amount. Both sales and EBIT outlook include expected COVID-19 effects.
1 FY/20 base: €2,068 million
2 FY/20 base: €29 million; FY/21 before special items
Conference Call
As part of the publication of the results for Q2/2021, a conference call will be held on July 30, 2021 at 1:30 p.m. CEDT (7:30 a.m. EDT). All investors are cordially invited to follow the conference call in a live broadcast over the Internet at www.fresenius.com/investors. Following the call, a replay will be available on our website.
For additional information on the performance indicators used please refer to our website https://www.fresenius.com/alternative-performance-measures.
This release contains forward-looking statements that are subject to various risks and uncertainties. Future results could differ materially from those described in these forward-looking statements due to certain factors, e.g. changes in business, economic and competitive conditions, regulatory reforms, results of clinical trials, foreign exchange rate fluctuations, uncertainties in litigation or investigative proceedings, and the availability of financing. Fresenius does not undertake any responsibility to update the forward-looking statements in this release.