
Financial Performance Indicators
The Management Board makes strategic and operational management decisions based on our Group-wide performance indicators for growth, profitability, liquidity, capital efficiency, and capital management. The most important financial performance indicators for us are explained below. As part of the new Fresenius Financial Framework, we have defined ambition levels (growth bands, amongst others EBIT margin) for the business segments. These serve as an ambition level for the internal management of our business sectors and are benchmarked against leading competitors. The key figures for the financial performance indicators for 2025 of the Group and the business segments can be found in the Outlook section.
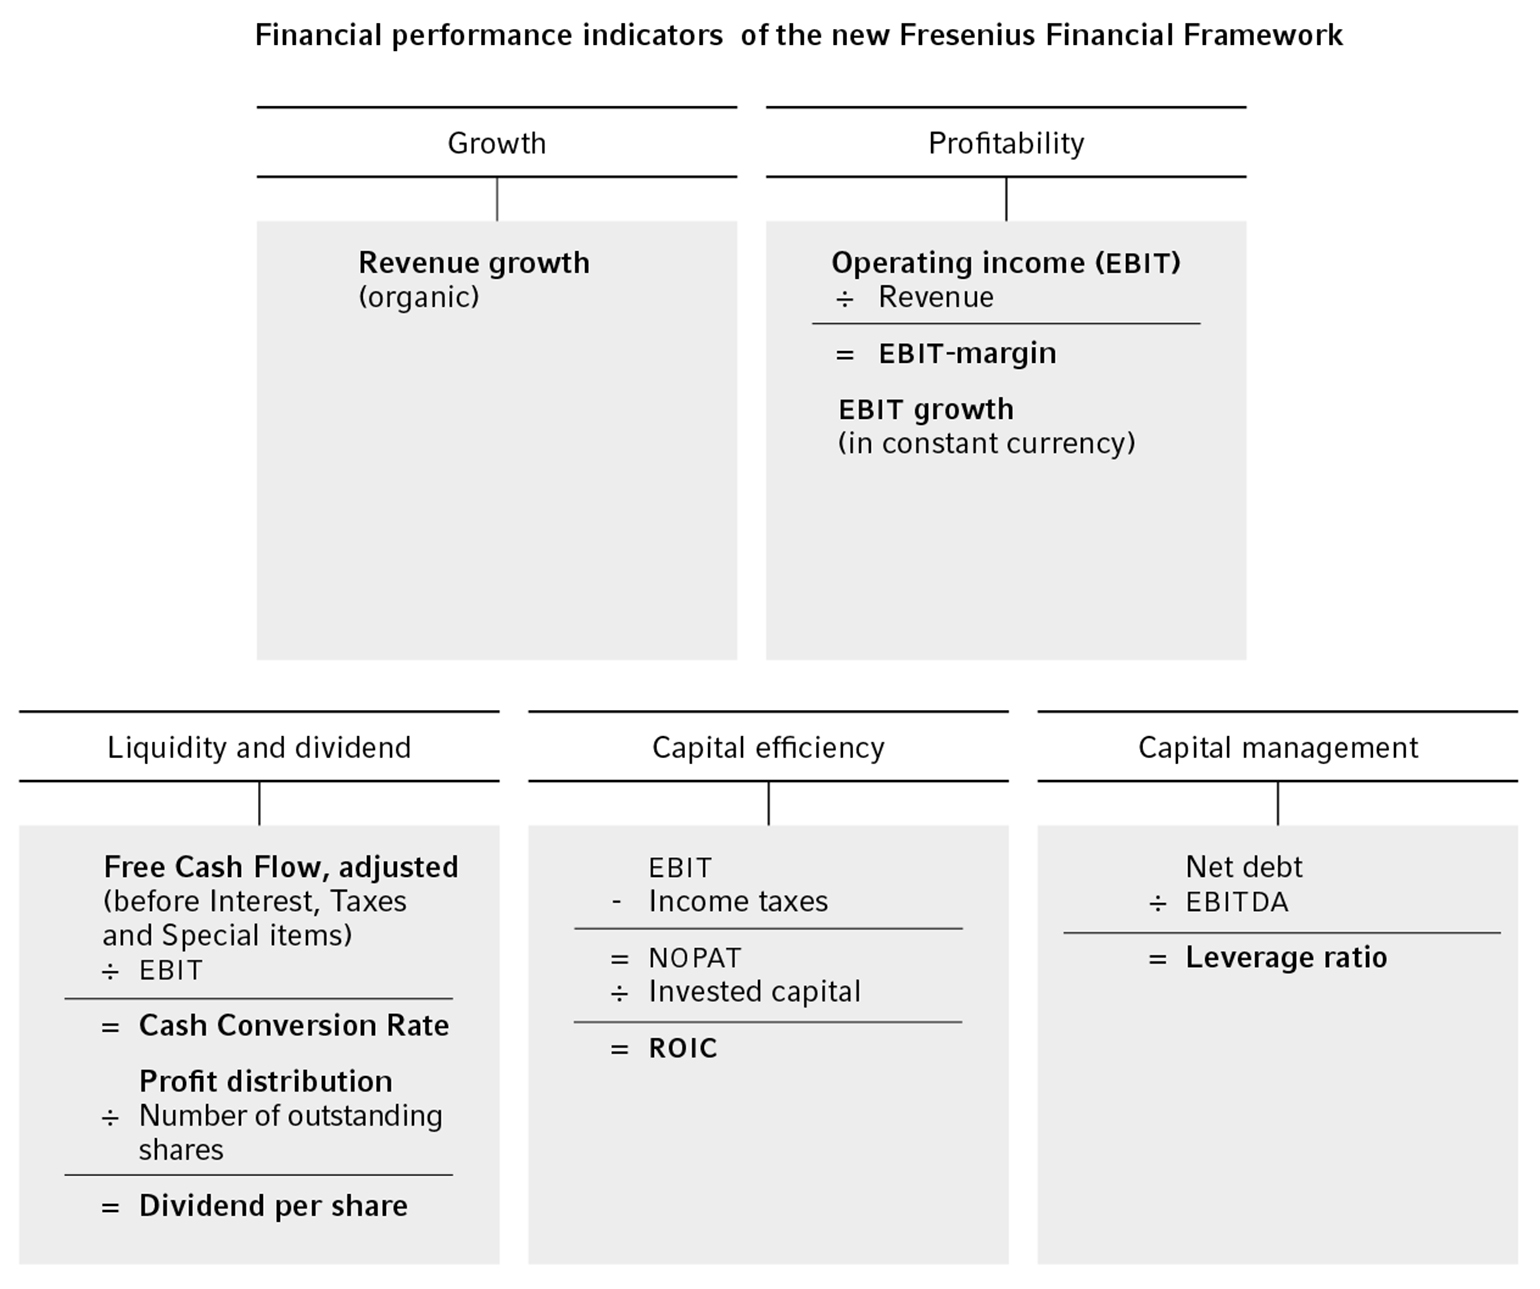
Growth
For Fresenius, currency-adjusted revenue growth, in particular organic revenue growth in the Group and in the business segments, is of central importance for managing revenue growth. It shows the growth of our business that comes from our own resources and not from acquisitions, divestitures, or currency translation and hyperinflation effects. Currency translation effects are the difference between revenue in the reporting period at the exchange rates of the reporting period, less revenues in the reporting period at the exchange rates of the comparative period.
A portfolio effect takes place in the case of an acquisition or divestment. Any portfolio effect is excluded for 12 months after the end of the relevant transaction in the reporting or comparative period, after which both current and prior periods fully reflect the portfolio change.
In the Fresenius Financial Framework, organic revenue growth represents the key performance indicator for the Group’s growth and that of the business segments. With the Fresenius Financial Framework, we have defined annual organic revenue growth ranges (ambition levels) for the Operating Companies.
Profitability
At Group level, we primarily use earnings before interest and taxes (EBIT) and EBIT growth in constant currency. As part of the Fresenius financial framework, we have defined annual margin bands (ambition levels) for the business segments. These serve as an ambition level for the internal management of our business sectors and are benchmarked against leading competitors. The annual EBIT margin is defined as earnings before interest and taxes divided by revenue. To improve comparability of operating performance over several periods, the earnings figure is adjusted for special items where necessary.
Liquidity and Dividend
Within the Group, Cash Conversion Rate (CCR) was used as the main liquidity indicator in fiscal year 2024. CCR is defined as the ratio of adjusted free cash flow (cash flow before acquisitions and dividends; before interest, tax, and special items) to operating income (EBIT) before special items. This allows us to assess our ability to generate cash and pay dividends, among other things. The ambition level for the CCR is around 1.0, considering the growth profile of the respective year.
Fresenius is committed to generating attractive and predictable dividend yields as set out in the Fresenius Financial Framework. As part of the full-year reporting in February 2025, Fresenius defined a new dividend policy. Our target is to distribute ~30-40% of core net income (net income excluding FMC, before special items). The new dividend policy reflects the capital allocation priorities in line with the #FutureFresenius strategy. It also underscores our intention to reinvest in growth, reduce leverage, maintain a solid investment-grade rating and provide attractive shareholder returns.
Capital efficiency
We work as profitably and efficiently as possible with the capital provided to us by shareholders and lenders.
Under the Fresenius Financial Framework, the Group's capital efficiency ismanaged on the basis of return on invested capital (ROIC). This serves as an ambition level for the internal management of our Group. We aim to achieve a ROIC (including goodwill) of between 6% and 8%.
Capital management
We use the ratio of net debt and EBITDA as the key parameter for managing the capital structure. This measure indicates the degree to which a company is able to meet its payment obligations. Our business segments usually hold leading positions in growing and mostly non-cyclical markets. Since the majority of our customers are of high credit quality, they generate mainly stable, predictable cash flows. According to the management assessment, the Group is therefore able to use debt to finance its growth to a greater extent than companies in other industries.
Due to the improved earnings situation and debt reduction in the 2024 financial year, the Management Board is revising the self-defined target range for the leverage ratio to 2.5 to 3.0x net debt/EBITDA (previously: 3.5 to 3.0x).
ESG targets in the compensation of Management Board
Sustainability is a material component of our business strategy. That is why Fresenius has defined ESG targets for the Management Board as part of their compensation system. In doing so, we aim to align the interests of our employees and patients as well as climate and environmental issues with our ambitions. Initially, all material aspects were considered and then prioritized. Subsequently, we have defined our ESG targets in the following areas:
- Employees: Employee Engagement Index (EEI) (Fresenius Group)
- Medical quality: Audit & Inspection Score (Fresenius Kabi) & Inpatient Quality Indicators (Fresenius Helios)
- Reduction of CO2 emissions: Total Scope 1 and Scope 2 CO2 emissions (market-based approach) in tons of CO2 equivalents (Fresenius Group)
The targets reflect identified material sustainability aspects from the materiality analysis. Further, in selecting the specific ESG targets, the company took into account the requirements of investors and society, as well as the current market practice of most DAX companies.
Within the framework of the short-term variable compensation (Short-Term Incentive - STI) with a measurement period of one year, the ESG objectives continue to be included with a weighting of 15%. The focus here is on the areas of medical quality and employees.
Medical quality topic is composed of equally weighted key figures that are defined at the business segment level. The indicators are based on the respective relevance for the business model:
Fresenius Kabi has set itself the goal of continuously achieving an Audit & Inspection Score of 2.3 or better. The Audit & Inspection Score at Fresenius Kabi is based on the number of critical and serious non-conformances from regulatory GMP inspections and the number of serious non-conformances from TUV ISO 9001 audits in relation to the total number of inspections and audits performed. The score shows how many deviations were identified on average during the inspections and audits considered. The Audit & Inspection Score is measured as a percentage (scale >0%).
Fresenius Helios sets relative company goals to measure the quality of treatment in its hospitals, using the España Inpatient Quality Indicator (E-IQI) methodology in Spain and the G-IQI methodology in Germany.
The Inpatient Quality Indicator at Fresenius Helios comprises the measurement of a set of standardized German inpatient quality indicators (G-IQI). These are based on routinely collected hospital billing data from hospital information systems. The number of indicators achieved compared to the total number of indicators is calculated to measure the overall success rate. There is individual target setting and measurement of target achievement in the two Helios segments Helios Germany and Helios Spain. Subsequently, target achievement is consolidated at Helios company level with equal weighting (50% each) for Executive Board compensation. The Inpatient Quality Indicator is measured on a scale of 0% to 100%.
Fresenius Helios sets the ongoing targets annually, reviews them internally at the end of the financial year and adjusts the target values for the following year. These indicators are collected as metrics and are a quantitative measure that can be used to assess and evaluate medical quality. The target is in each case to be better than the national average for the respective indication.
For 2025 following targets have been set:
- G-IQI: score of at least 88%
- E-IQI: score of at least 75%
In the area of employees, employee satisfaction is measured for the Group on the basis of the Employee Engagement Index (EEI). The EEI measures how positively employees identify with their employer, how committed they feel, and how engaged they are at work. The key figure can be reported in relation to a business segment or for the entire Group. The EEI of the Fresenius Group is weighted according to the number of employees in the business segments The EEI is measured on a scale between 1 and 6.
Fresenius is aiming for an EEI of 4.33 for fiscal year 2025.
In the long-term variable compensation of the Management Board (Long-Term Incentive - LTI), with a measurement period of four years, ESG criteria account for 25% of target achievement. ESG target achievement in the LTI is measured on the basis of CO2e reduction. The target range is aligned with the long-term targets of Fresenius: By 2030, we plan to reduce our own direct Scope 1 and indirect Scope 2 emissions by a total of 50% compared to the base year 2020 and to achieve climate neutrality by 2040. Emissions are calculated as CO2 equivalents and Scope 2 emissions on a market basis.
For further information please refer to our Annual Report 2024.
Investment and acquisition process
Against the backdrop of debt, Fresenius pursues a targeted capital allocation with a focus on deleveraging. Our investments and acquisitions are carried out using a detailed coordination and evaluation process. As a first step, the Management Board sets the Group’s investment targets and the budget based on investment proposals. In the next step, the respective business segments and the internal Acquisition & Investment Council (AIC) determine the proposed projects and measures, taking into account the overall strategy, the total investment budget, and the required and potential return on investment. We evaluate investment projects based on commonly used methods, such as internal rate of return (IRR) and net present value (NPV). Within the framework of the due diligence process, opportunities and risks associated with the potential acquisition target are analyzed and assessed. To this end, we review the business model, the key financial figures and tax issues, and the resulting company valuation. In addition, we comprehensively analyze the market and competitive environment, the regulatory framework and the legal aspects. The audit also covers various issues relating to compliance, production, research and development, quality, information technology, human resources, and the environment. Based on investment volume, a project is submitted for approval to the executive committees or respective managements of the business segments, to the Group Management Board of Fresenius Management SE, and / or, if applicable, also additionally the consent of its Supervisory Board.
You can also find more details on our key performance indicators in our interactive tool at www.fresenius.com/interactive-tool.
Contact

Senior Vice President Investor Relations
Head of Investor Relations
T: +49 (0) 6172 608-97033
nick.stone@fresenius.com
Related Links
Interactive Tool