Interactive Tool
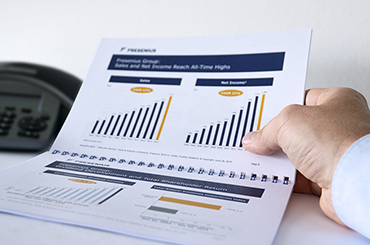
With our interactive tool you can analyze and graph a variety of key figures of the Fresenius Group and the business segments on an annual and quarterly basis.

Financial key figures
More information
Sustainability
More informationContact

Vice President Investor Relations
Deputy Head of Investor Relations
T: +49 (0) 6172 608-5167
florian.feick@fresenius.com
Download
Related Links
Alternative Performance Measures
