
• Guidance for 2021 confirmed
• Fresenius Medical Care delivers solid first quarter
• Fresenius Kabi shows strong performance in Emerging Markets whilst headwinds continue to impact North American business
• Helios Germany continues to be compensated by government for foregone elective treatments; Helios Spain delivers significant sales and earnings growth given recovery of treatment activity
• Fresenius Vamed continues to suffer from COVID-19 related project delays; technical high-end service business remains robust
• Preparation of Group-wide initiatives to improve efficiency and profitability progressing
If no timeframe is specified, information refers to Q1/2021. In Q1/2021 no special items incurred.

1 Before special items
2 Net income attributable to shareholders of Fresenius SE & Co. KGaA
For a detailed overview of special items please see the reconciliation table in the PDF document.
Stephan Sturm, CEO of Fresenius, said: “In view of the adversity and uncertainties that COVID-19 continues to bring, we are satisfied with our start in 2021. We achieved continued organic growth, although the pandemic had a lesser impact on the prior-year quarter. That makes me optimistic that we can reach our targets. The progress being made with vaccinations worldwide is another reason for confidence, even though it is too early to sound the all-clear. In the coming months, we will still be dealing with the pandemic’s many and wide-ranging effects. As before, we will do this with full responsibility for the patients entrusted to us. At the same time, we are moving ahead with our planning for cost and efficiency measures. These measures will create a strong foundation for accelerated and sustainable growth against the backdrop of long-term growth trends supporting our core businesses. Growth that contributes to ever better medicine for ever more people.”
COVID-19 assumptions for guidance FY/21
Q1/21 was characterized by a regionally varying development of the COVID-19 pandemic. Given continued high infection numbers as well as an increasing number of virus mutations, large-scale constraints of public and private life have been re-enacted in various countries. Vaccination programs are progressing worldwide at, however, varying pace.
COVID-19 will continue to impact Fresenius’ operations in 2021. Current burdens and constraints caused by COVID-19 are expected to recede only in H2/21. The expected improvement in the Group’s relevant business environment from H2/21 is heavily dependent on continuously increasing levels of vaccination coverage in Fresenius’ relevant markets. These assumptions are subject to considerable uncertainty.
A deterioration of the situation requiring further containment measures in one or more of Fresenius’ major markets, although becoming somewhat less likely does remain a risk. Any resulting significant and direct impact on the health care sector without any appropriate compensation is not reflected in the Group’s FY/21 guidance.
FY/21 Group guidance confirmed
For FY/21, Fresenius continues to project sales growth1 in a low-to-mid single-digit percentage range and at least broadly stable net income2,3 year-over-year, both in constant currency. Implicitly, net income2 for the Group excluding Fresenius Medical Care is expected to grow in a mid-to-high single-digit percentage range in constant currency.
Fresenius projects net debt/EBITDA4 to be around the top-end of the self-imposed target corridor of 3.0x to 3.5x by the end of FY/21.
To sustainably enhance profitability, Fresenius is preparing group-wide strategic efficiency initiatives. These initiatives are expected to consist of operational excellence and cost-saving measures, targeted strengthening of future growth areas and portfolio optimizations. They are targeted to result in cost savings of at least €100 million p.a. after tax and minority interest in 2023 with some further potential to increase thereafter. Achieving these sustainable efficiencies will require significant up-front expenses. On average for the years 2021 to 2023, those expenses are expected to be in the order of magnitude of €100 million p.a. after tax and minority interest. They will be classified as special items.
1 FY/20 base: €36,277 million
2 Net income attributable to shareholders of Fresenius SE & Co. KGaA
3 FY/20 base: €1,796 million, before special items; FY/21: before special items
4 At LTM average exchange rates for both net debt and EBITDA; pro forma closed acquisitions/divestitures; excluding further potential acquisitions; before special items
For a detailed overview of special items please see the reconciliation table in the PDF document.
3% sales increase in constant currency
Group sales decreased by 2% (increased by 3% in constant currency) to €8,984 million (Q1/20: €9,135 million). Organic growth was 2%. Acquisitions/divestitures contributed net 1% to growth. Currency translation reduced sales growth by 5%. Excluding estimated COVID-19 effects1, Group sales growth would have been 4% to 5% in constant currency (Q1/20: 7% to 8%).
2% net income2,3 decrease in constant currency
Group EBITDA before special items and reported Group EBITDA decreased by 7% (-2% in constant currency) to €1,628 million (Q1/20: €1,755 million).
Group EBIT before special items and reported Group EBIT decreased by 11% (-6% in constant currency) to €1,006 million (Q1/20: €1,125 million). The constant currency decrease is primarily due to COVID-19 related headwinds. Both the EBIT margin before special items and the reported EBIT margin were 11.2% (Q1/20: 12.3%).
Group net interest before special items improved to -€137 million (Q1/202: -€174 million) mainly due to successful refinancing activities, lower interest rates as well as currency translation effects. Reported Group net interest also improved to -€137 million (Q1/20: -€182 million).
Both the Group tax rate before special items and the reported tax rate were 22.8% (Q1/20: 22.6%).
Both Noncontrolling interests before special items and reported noncontrolling interests were -€236 million (Q1/20: -€271 million) of which 95% were attributable to the noncontrolling interests in Fresenius Medical Care.
1 For estimated COVID-19 effects in Q1/21 and Q1/20 please see table in the PDF document.
2 Before special items
3 Net income attributable to shareholders of Fresenius SE & Co. KGaA
For a detailed overview of special items please see the reconciliation table in the PDF document.
Group net income1 before special items decreased by 6% (-2% in constant currency) to €435 million (Q1/202: €465 million). The absolute negative COVID-19 effect was more pronounced in Q1/21 compared to the prior-year quarter. Excluding estimated COVID-19 effects3, Group net income1 before special items would have grown 0% to 4% in constant currency (Q1/20: 6% to 10%). Reported Group net income1 decreased to €435 million (Q1/20: €459 million).
Earnings per share1 before special items decreased by 6% (-2% in constant currency) to €0.78 (Q1/202: €0.83). Reported earnings per share1 were also €0.78 (Q1/20: €0.82).
Continued investment in growth
Spending on property, plant and equipment was €384 million corresponding to 4% of sales (Q1/20: €547 million; 6% of sales). These investments served primarily for the modernization and expansion of dialysis clinics, production facilities as well as hospitals and day clinics.
Total acquisition spending was €149 million (Q1/20: €412 million), mainly for the acquisition of dialysis clinics at Fresenius Medical Care.
Cash flow development
Group operating cash flow decreased to €652 million (Q1/20: €878 million) with a margin of 7.3% (Q1/20: 9.6%), driven by a seasonal fluctuation in Fresenius Medical Care's invoicing and working capital movements in North America. Free cash flow before acquisitions and dividends decreased to €241 million (Q1/20: €305 million). Free cash flow after acquisitions and dividends increased to €117 million (Q1/20: -€40 million).
1 Net income attributable to shareholders of Fresenius SE & Co. KGaA
2 Before special items
3 For estimated COVID-19 effects in Q1/21 and Q1/20 please see table in the PDF document.
For a detailed overview of special items please see the reconciliation table in the PDF document.
Solid balance sheet structure
Group total assets increased by 3% (1% in constant currency) to €68,966 million (Dec. 31, 2020: €66,646 million) given currency translation effects and the expansion of business activities. Current assets increased by 6% (4% in constant currency) to €16,693 million (Dec. 31, 2020: €15,772 million), mainly driven by the increase of trade accounts receivables. Non-current assets increased by 3% (0% in constant currency) to €52,273 million (Dec. 31, 2020: €50,874 million).
Total shareholders’ equity increased by 6% (3% in constant currency) to €27,514 million (Dec. 31, 2020: €26,023 million). The equity ratio was 39.9% (Dec. 31, 2020: 39.0%).
Group debt increased by 2% (1% in constant currency) to €26,508 million (Dec. 31, 2020: € 25,913 million). Group net debt increased by 2% (1% in constant currency) to € 24,631 million (Dec. 31, 2020: € 24,076 million).
As of March 31, 2021, the net debt/EBITDA ratio increased to 3.52x1,2 (Dec. 31, 2020: 3.44x1,2) driven by COVID-19 effects weighing on EBITDA as well as increased net debt.
1 At LTM average exchange rates for both net debt and EBITDA; pro forma closed acquisitions/divestitures
2 Before special items
For a detailed overview of special items please see the reconciliation table in the PDF document.
Business Segments
Fresenius Medical Care (Financial data according to Fresenius Medical Care press release)
Fresenius Medical Care is the world's largest provider of products and services for individuals with renal diseases. As of March 31, 2021, Fresenius Medical Care was treating 344,476 patients in 4,110 dialysis clinics. Along with its core business, the Renal Care Continuum, the company focuses on expanding in complementary areas and in the field of critical care.

• Organic treatment growth impacted by COVID-19 pandemic as expected
• Reported revenue and earnings continued to be adversely affected by exchange rate effects
• Earnings development supported by phasing and expected lower SG&A expense anticipated to reverse throughout the year
• Financial targets for FY 2021 confirmed
Sales of Fresenius Medical Care decreased by 6% (increased by 1% in constant currency) to €4,210 million (Q1/20: €4,488 million). Thus, currency translation had a negative effect of 7%. Organic growth was 1%.
EBIT decreased by 15% (-8% in constant currency) to €474 million (Q1/20: €555 million) resulting in a margin of 11.3% (Q1/20: 12.4%). The decrease was mainly driven by effects from COVID-19 across all regions, higher personnel expenses and a significant negative exchange rate effect. Additionally, EBIT was negatively affected by a positive prior-year effect from the divestiture of cardiovascular clinics and a prior-year partial reversal of a revenue recognition adjustment. These negative effects were partially offset by an improved payor mix mainly driven by Medicare Advantage and expected lower SG&A expenses, which are anticipated to reverse in the remainder of the year.
1 Net income attributable to shareholders of Fresenius Medical Care AG & Co. KGaA
Net income1 decreased by 12% (-6% in constant currency) to €249 million (Q1/20: €283 million). Besides the above-mentioned operating earnings effects, net income was supported by a 27% decrease of net interest expense to €76 million (Q1/20: €104 million).
The first quarter 2020 included negative COVID-19 effects that reversed in Q2 2020, including the compensation received under the CARES Act, and therewith increase the base for the second quarter 2021. These base effects impact the phasing of net income growth in 2021.
Operating cash flow was €208 million (Q1/20: €584 million) with a margin of 4.9% (Q1/20: 13.0%). The decline was driven by the seasonality in invoicing and periodic delays in payment of public health care organizations.
For FY/21, Fresenius Medical Care confirms its outlook as outlined on February 23, 2021. The Company expects revenue2 to grow at a low-to-mid single-digit percentage range and net income1,3 to decline at a high-teens to mid-twenties percentage range against the 2020 base4.
For further information, please see Fresenius Medical Care’s press release at www.freseniusmedicalcare.com.
1 Net income attributable to shareholders of Fresenius Medical Care AG & Co. KGaA
2 FY/20 base: €17,859 million
3 FY/20 base: €1,359 million, before special items; FY/21: before special items
4 These targets are based on the 2020 results excluding the impairment of goodwill and trade names in the Latin America Segment of €195 million. They are inclusive of anticipated COVID-19 effects, in constant currency and exclude special items. Special items include costs related to FME25 and other effects that are unusual in nature and have not been foreseeable or not foreseeable in size or impact at the time of giving guidance.
Fresenius Kabi
Fresenius Kabi offers intravenously administered generic drugs, clinical nutrition and infusion therapies for seriously and chronically ill patients in the hospital and outpatient environments. The company is also a leading supplier of medical devices and transfusion technology products. In the biosimilars business, Fresenius Kabi develops products with a focus on oncology and autoimmune diseases.

• North America performance impacted by COVID-19 and temporary manufacturing issues
• Solid performance in Europe masked by prior-year COVID-19 related demand spike
• Emerging Markets showed strong sales and earnings growth; China with excellent performance given dynamic recovery of elective treatment activity
Sales decreased by 2% (increased by 4% in constant currency) to €1,761 million (Q1/20: €1,789 million). Organic growth was 3%. Negative currency translation effects of 6% were mainly related to weakness of the US dollar, the Brazilian real and the Argentinian peso.
Sales in North America decreased by 17% (organic growth: -9%) to €558 million (Q1/20: €669 million). The decrease was driven by fewer elective treatments, competitive pressure, missing sales from a customer in Chapter 11 as well as temporary manufacturing issues which outweighed extra demand for COVID-19 related products.
Sales in Europe decreased by 1% (organic growth: -1%) to €626 million (Q1/20: €631 million) mainly related to the strong demand for COVID-19 related drugs in the prior year quarter.
Sales in Asia-Pacific increased by 23% (organic growth: 26%) to €392 million (Q1/20: €319 million). The growth is mainly due to a dynamic recovery of elective procedures and a meaningful COVID-19 impact lowering the prior year basis in China as well as a growing recovery in other Asian markets.
1 Before special items
2 Net income attributable to shareholders of Fresenius SE & Co. KGaA
Sales in Latin America/Africa increased by 9% (organic growth: 28%) to €185 million (Q1/20: €170 million) due to ongoing COVID-19 related extra demand.
EBIT1 decreased by 4% (increased by 2% in constant currency) to €276 million (Q1/20: €289 million) with an EBIT margin of 15.7% (Q1/20:16.2%). The increase in constant currency was tempered by underutilized production capacities in the US, competitive pressure coupled with selective supply constraints due to temporary manufacturing issues and the missing contribution from sales to a customer now in Chapter 11. EBIT was supported by positive COVID-19 effects, lower corporate costs due to travel restrictions and phasing of projects.
Net income1,2 decreased by 4% (increased by 3% in constant currency) to €190 million (Q1/201: €197 million).
Operating cash flow increased to €278 million (Q1/20: €174 million) with a margin of 15.8% (Q1/20: 9.7%) mainly due to working capital improvements driven by cash collections.
For FY/21, Fresenius Kabi confirms its outlook and expects organic sales3 growth in a low-to-mid single-digit percentage range. Constant currency EBIT4 is expected to show a stable development up to low single-digit percentage growth. Both sales and EBIT outlook include expected COVID-19 effects.
1 Before special items
2 Net income attributable to shareholders of Fresenius SE & Co. KGaA
3 FY/20 base: €6,976 million
4 FY/20 base: €1,095 million, before special items; FY/21: before special items
Fresenius Helios
Fresenius Helios is Europe's leading private hospital operator. The company comprises Helios Germany and Helios Spain. Helios Germany operates 89 hospitals, ~130 outpatient centers and 6 prevention centers. Helios Spain operates 47 hospitals, 74 outpatient centers and around 300 occupational risk prevention centers. In addition, the company is active in Latin America with 6 hospitals and as a provider of medical diagnostics.

• Helios Spain delivers significant organic sales and earnings growth given recovery of treatment activity
• Helios Germany continues to be compensated by government for foregone elective treatments
• Growth additionally fueled by contributions from acquisitions in Germany and Latin America
Sales increased by 7% (8% in constant currency) to €2,649 million (Q1/20: €2,466 million). Organic growth was 4%. Acquisitions contributed 4% to sales growth.
Sales of Helios Germany increased by 4% (organic growth: 0%) to €1,673 million (Q1/20: €1,603 million). COVID-19 effects were mitigated by government compensation in regions with high COVID-19 incidences. The hospital acquisitions from the Order of Malta contributed 4% to sales growth.
Sales of Helios Spain increased by 13% (14% in constant currency) to €976 million (Q1/20: €863 million). Organic growth of 11% was driven by a strong recovery of elective procedures, a consistently high level of outpatient treatments and strong demand for occupational risk prevention (ORP) services. In addition, the hospitals in Latin America showed a strong performance. The hospital acquisitions in Colombia contributed 3% to sales growth.
EBIT of Fresenius Helios decreased by 2% (-1% in constant currency) to €268 million (Q1/20: €274 million) with an EBIT margin of 10.1% (Q1/20: 11.1%).
1 Net income attributable to shareholders of Fresenius SE & Co. KGaA
EBIT of Helios Germany decreased by 9% to €150 million (Q1/20: €165 million) with an EBIT margin of 9.0% (Q1/20: 10.3%). Government compensation broadly mitigated COVID-19 effects. The decrease was primarily caused by the impact of the carve-out of nursing expenses from the overall DRGs and the positive development of January and February last year.
EBIT of Helios Spain increased by 13% (14% in constant currency) to €126 million (Q1/20: €112 million) with an EBIT margin of 12.9% (Q1/20: 13.0%). Healthy organic sales growth led to a meaningfully improved coverage of the fixed cost base. The hospital acquisitions in Colombia made an additional contribution.
Net income1 decreased by 2% (-1% in constant currency) to €173 million (Q1/20: €176 million).
Operating cash flow increased to €215 million (Q1/20: €145 million) with a margin of 8.1% (Q1/20: 5.9%), mainly due to working capital improvements driven by cash collections.
For FY/21, Fresenius Helios confirms its outlook and expects organic sales2 growth in a low-to-mid single-digit percentage range and constant currency EBIT3 growth in a mid-to-high single-digit percentage range. Both sales and EBIT outlook include expected COVID-19 effects.
1 Net income attributable to shareholders of Fresenius SE & Co. KGaA
2 FY/20 base: €9,818 million
3 FY/20 base: €1,025 million; FY/21 before special items
Fresenius Vamed
Fresenius Vamed manages projects and provides services for hospitals and other health care facilities worldwide and is a leading post-acute care provider in Central Europe. The portfolio ranges along the entire value chain: from project development, planning, and turnkey construction, via maintenance and technical management to total operational management.

• Continued significant negative COVID-19 impact
• Project business marked by COVID-19 related delays, cancellations and global supply chain restraints
• Rehabilitation business remains impacted by fewer elective surgeries
• Technical high-end service business remains robust
Sales decreased by 4% (-4% in constant currency) to €477 million (Q1/20: €499 million). Organic growth was -4%.
Sales in the service business increased by 2% (2% in constant currency) to €363 million (Q1/20: €357 million). Sales in the project business decreased by 20% (-20% in constant currency) to €114 million (Q1/20: €142 million), driven by postponements and cancellations of projects.
EBIT decreased by 129% (-129% in constant currency) to -€4 million (Q1/20: €14 million) with an EBIT margin of -0.8% (Q1/20: 2.8%). Large parts of the post-acute care clinic capacities were left partially empty given a generally lower intake of elective surgery patients from acute-care hospitals. Health-authority-induced restrictions or even closures of facilities also had a negative effect. In the project business, project delays and global supply chain restraints triggered incremental expenses.
1 Net income attributable to shareholders of VAMED AG
Net income1 decreased to -€7 million (Q1/20: €7 million).
Order intake was €138 million (Q1/20: €124 million). As of March 31, 2021, order backlog was at €3,082 million (December 31, 2020: €3,055 million). Order intake continued to be marked by COVID-19 related cancellations and project delays.
Operating cash flow decreased to -€44 million (Q1/20: -€20 million) with a margin of -9.2% (Q1/20: -4.0%), mainly related to the lower net income contribution.
For FY/21, Fresenius Vamed confirms its outlook and expects organic sales2 growth in a mid-to-high single-digit percentage range and EBIT3 to grow to a high double-digit Euro million amount. Both sales and EBIT outlook include expected negative COVID-19 effects.
1 Net income attributable to shareholders of VAMED AG
2 FY/20 base: €2,068 million
3 FY/20 base: €29 million; FY/21 before special items
Conference Call
As part of the publication of the results for Q1/2021, a conference call will be held on May 6, 2021 at 1:30 p.m. CEDT (7:30 a.m. EDT). All investors are cordially invited to follow the conference call in a live broadcast over the Internet at www.fresenius.com/investors. Following the call, a replay will be available on our website.
For additional information on the performance indicators used please refer to our website https://www.fresenius.com/alternative-performance-measures.
This release contains forward-looking statements that are subject to various risks and uncertainties. Future results could differ materially from those described in these forward-looking statements due to certain factors, e.g. changes in business, economic and competitive conditions, regulatory reforms, results of clinical trials, foreign exchange rate fluctuations, uncertainties in litigation or investigative proceedings, and the availability of financing. Fresenius does not undertake any responsibility to update the forward-looking statements in this release.
- Preliminary guidance for 2021 confirmed
- Strategic roadmap for accelerated growth through 2023 and beyond
- Group-wide initiatives to improve efficiency and profitability in preparation
- Medium-term growth targets confirmed
- 28th consecutive dividend increase proposed
If no timeframe is specified, information refers to Q4/2020 2020 and 2019 according to IFRS 16

1 Before special items
2 Net income attributable to shareholders of Fresenius SE & Co. KGaA
For a detailed overview of special items please see the reconciliation tables in the PDF document.
Stephan Sturm, CEO of Fresenius, said:” The pandemic year 2020 showed emphatically the importance of forward-thinking, effective and efficient healthcare. Fresenius is making a vital contribution here, in many different areas of medicine. This year, the pandemic will again present us with a number of challenges, making it even more important that we increase efficiency in order to improve our cost base. Beyond our established businesses, we will also expand in important growth areas including biosimilars, digital healthcare, home dialysis and fertility medicine. By doing so, we are laying the foundations for more dynamic growth in the coming years. Even though the pandemic and its consequences are keeping us busy right now, we are already looking ahead and setting the course for the medicine of the future. In this way, we are also securing our company’s sustainable economic success.”
FY/21 Group guidance
For FY/21, Fresenius projects sales growth1 in a low to mid-single-digit percentage range and at least broadly stable net income2,3 year-over-year, both in constant currency. Implicitly, net income2 for the Group excluding Fresenius Medical Care is expected to grow in a mid-to high single digit percentage range in constant currency. Fresenius projects net debt/EBITDA4 to be around the top-end of the self-imposed target corridor of 3.0x to 3.5x by the end of FY/21.
COVID-19 assumptions for guidance FY/21
COVID-19 will continue to impact Fresenius’ operations in 2021. Current burdens and constraints caused by COVID-19 are expected to recede only in H2/21. The expected improvement in the Group’s relevant business environment from H2/21 is heavily dependent on continuously increasing levels of vaccination coverage in Fresenius’ relevant markets. These assumptions are subject to considerable uncertainty.
Fresenius closely monitors the development of COVID-19 case numbers, and the associated various containment measures being enacted in many of the Company’s relevant markets. A possible significant deterioration of the situation associated with further containment measures that could have a significant and direct impact on the health care sector without any appropriate compensation is not reflected in the Group’s FY/21 guidance.
1 FY/20 base: €36,277 million
2 Net income attributable to shareholders of Fresenius SE & Co. KGaA
3 FY/20 base: €1,796 million; before special items; FY/21: before special items
4 At LTM average exchange rates for both net debt and EBITDA; pro forma closed acquisitions/divestitures; excluding further potential acquisitions; before special items
For a detailed overview of special items please see the reconciliation tables in the PDF document.
Efficiency and cost saving programs
COVID-19 has led and will lead to a shortfall relative to our original expectations in FY/20 and FY/21 as well as to ongoing incremental uncertainty. Fresenius is hence planning to launch group-wide strategic efficiency initiatives to further safeguard the confirmed medium-term targets and sustainably enhance profitability. These initiatives are expected to consist of operational excellence and cost-saving measures, targeted strengthening of future growth areas and portfolio optimizations. The operational excellence and cost-saving measures are targeted to result in cost savings of at least €100 million p.a. after tax and minority interest in 2023 with some further potential to increase thereafter. We anticipate that achieving these sustainable efficiencies will require significant up-front expenses. On average for the years 2021 to 2023, those expenses are expected to be in the order of magnitude of €100 million p.a. after tax and minority interest. They will be classified as special items. Further information will be provided during our Q1 earnings call on May 6, 2021.
Growth targets for 2020 – 2023 confirmed
Fresenius continues to expect Group sales to grow organically with a compounded annual growth rate (CAGR) of 4% to 7% during 2020 to 2023. Group net income1,2 is projected to increase organically with a CAGR of 5% to 9% during 2020 to 2023. Fresenius expects its sales growth and efficiency improvement initiatives as well as Fresenius Kabi’s biosimilars business to drive an acceleration of Group earnings growth over that period. Small and medium-sized acquisitions are expected to contribute an incremental CAGR of approx. 1%-point to both sales and net income growth.
28th consecutive dividend increase proposed
The Management Board of Fresenius will propose to the Supervisory Board a dividend increase of 5% to €0.88 per share for FY/20 (FY/19: €0.84). Provided the proposal is approved by the Supervisory Board and the Annual General Meeting, this will be the 28th consecutive dividend increase.
1 Net income attributable to shareholders of Fresenius SE & Co. KGaA
2 Before special items
For a detailed overview of special items please see the reconciliation tables in the PDF document.
5% sales growth in constant currency
Group sales remained on prior year’s level (increased by 5% in constant currency) at €9,304 million (Q4/19: €9,311 million). Organic growth was 2%. Acquisitions/ divestitures contributed net 3% to growth. Currency translation reduced sales growth by 5%. Excluding estimated COVID-19 effects1, Group sales growth would have been 7% to 8% in constant currency.
In FY/20, Group sales increased by 2% (5% in constant currency) to €36,277 million (FY/19: €35,409 million). Organic growth was 3%. Acquisitions/divestitures contributed net 2% to sales growth. Currency translation reduced sales growth by 3%. Excluding estimated COVID-19 effects1, Group sales growth would have been 7% to 8% in constant currency.
2% net income2,3 growth in constant currency
Group EBITDA before special items decreased by 3% (increased by 3% in constant currency) to €1,886 million (Q4/192: €1,937 million). Reported Group EBITDA was €1,854 million (Q4/19: €1,937 million).
In FY/20, Group EBITDA before special items remained on prior year’s level (increased by 2% in constant currency) at €7,132 million (FY/192: €7,104 million). Reported Group EBITDA was €7,100 million (FY/19: €7,083 million).
Group EBIT before special items decreased by 3% (increased by 2% in constant currency) to €1,251 million (Q4/192: €1,287 million). The constant currency increase is due to the positive development at Fresenius Medical Care and Fresenius Helios. Missing contributions from elective procedures, volume headwinds leading to underutilized production capacities, headwinds at Fresenius Kabi North America, COVID-19 related project delays at Fresenius Vamed as well as Group-wide incremental COVID-19 related expenses weighed on EBIT. The EBIT margin before special items was 13.4% (Q4/192: 13.8%). Reported Group EBIT was €1,024 million (Q4/19: €1,269 million). In FY/20, Group EBIT before special items decreased by 2% (0% in constant currency) to €4,612 million (FY/192: €4,688 million). The EBIT margin before special items was 12.7% (FY/192: 13.2%). Higher levels of investments in recent years triggered incremental depreciation charges. Reported Group EBIT was €4,385 million (FY/19: €4,631 million).
Group net interest before special items improved to -€159 million (Q4/192: -€182 million) mainly due to successful refinancing activities, lower interest rates as well as currency translation effects. Reported Group net interest improved to -€156 million (Q4/19: -€184 million).
1 For estimated COVID-19 effects in Q4/20 and FY/20 please see table on page 18 in the PDF document.
2 Before special items
3 Net income attributable to shareholders of Fresenius SE & Co. KGaA
For a detailed overview of special items please see the reconciliation tables in the PDF document.
In FY/20, Group net interest before special items improved to -€654 million (FY/191: - €714 million) while reported Group net interest improved to -€659 million (FY/19: -€719 million).
The Group tax rate before special items was 24.1% (Q4/191: 23.8%) and the reported Group tax rate was 29.4% (Q4/19: 23.0%). The increase is due to a not tax deductible €195 million impairment of goodwill and tradenames in the Latin America segment at Fresenius Medical Care. In FY/20, the Group tax rate before special items was 23.1% (FY/191: 23.3%) and the reported Group tax rate was 24.2% (FY/19: 22.6%).
Noncontrolling interests before special items were €335 million (Q4/191: €336 million) of which 93% were attributable to the noncontrolling interests in Fresenius Medical Care. Reported noncontrolling interests were €203 million (Q4/19 reported: €320 million). In FY/20, noncontrolling interests before special items were €1,248 million (FY/191: €1,170 million) of which 96% were attributable to the noncontrolling interests in Fresenius Medical Care. Reported noncontrolling interests were €1,116 million (FY/19 reported: €1,146 million).
Group net income2 before special items decreased by 2% (increased by 2% in constant currency) to €494 million (Q4/19: €506 million). Excluding estimated COVID-19 effects3, Group net income2 before special items would have grown 3% to 7% in constant currency. Reported Group net income2 decreased to €410 million (Q4/19: €515 million). The decrease is mainly due to an impairment of goodwill and tradenames in the Latin America segment at Fresenius Medical Care and the increased valuation of the biosimilars contingent purchase price liabilities at Fresenius Kabi. In FY/20, Group net income2 before special items decreased by 4% (-3% in constant currency) to €1,796 million (FY/191: €1,879 million). Excluding estimated COVID-19 effects3, Group net income2 before special items would have grown 2% to 6% in constant currency. Reported Group net income2 decreased to €1,707 million (FY/19: €1,883 million).
Earnings per share2 before special items decreased by 2% (increased by 2% in constant currency) to €0.88 (Q4/191: €0.90). Reported earnings per share2 were €0.73 (Q4/19: €0.92). In FY/20, earnings per share2 before special items decreased by 4% (-3% in constant currency) to €3.22 (FY/191: €3.37). Reported earnings per share2 were €3.06 (FY/191: €3.38).
1 Before special items
2 Net income attributable to shareholders of Fresenius SE & Co. KGaA
3 For estimated COVID-19 effects in Q4/20 and FY/20 please see table on page 18 in the PDF document.
For a detailed overview of special items please see the reconciliation tables in the PDF document.
Continued investment in growth
Spending on property, plant and equipment was €856 million corresponding to 9% of sales (Q4/19: €871 million; 9% of sales). These investments served primarily for the modernization and expansion of dialysis clinics, production facilities as well as hospitals and day clinics. Despite the COVID-19 pandemic, Fresenius has been largely able to continue its investment programs. In FY/20, spending on property, plant and equipment was €2,398 million corresponding to 7% of sales (FY/19: €2,463 million; 7% of sales).
Total acquisition spending was €251 million (Q4/19: €331 million). In FY/20, total acquisition spending was €902 million, mainly for the purchase of hospitals by Fresenius Helios in Germany and Colombia (FY/19: €2,623 million, mainly for the acquisition of NxStage by Fresenius Medical Care).
Good cash flow development
Group operating cash flow increased to €1,390 million (Q4/19: €1,286 million) with a margin of 14.9% (Q4/19: 13.8%). Free cash flow before acquisitions and dividends increased to €590 million (Q4/19: €442 million). Free cash flow after acquisitions and dividends increased to €329 million (Q4/19: €89 million).
In FY/20, Group operating cash flow increased to €6,549 million (FY/19: €4,263 million) with a margin of 18.1% (FY/19: 12.0%). The increase was largely driven by Fresenius Medical Care due to the U.S. federal relief funding and advanced payments under the Coronavirus Aid, Relief and Economic Security Act (CARES Act) as well as by the shorter payment periods of the COVID-19 governmental compensation and reimbursement scheme for Helios Germany. Also excluding these COVID-19 effects, Group operating cash flow would have grown year-over-year. Free cash flow before acquisitions and dividends increased to €4,183 million (FY/19: €1,830 million). Free cash flow after acquisitions and dividends increased to €2,478 million (FY/19: -€1,545 million, driven by Fresenius Medical Care’s acquisition of NxStage).
Solid balance sheet structure
Group total assets decreased by 1% (increased by 5% in constant currency) to €66,646 million (Dec. 31, 2019: €67,006 million). The decrease is mainly due to currency translation effects outweighing the expansion of business activities. Current assets increased by 3% (10% in constant currency) to €15,772 million (Dec. 31, 2019: €15,264 million), mainly driven by the increase of cash and cash equivalents. Non-current assets decreased by 2% (increased by 3% in constant currency) to €50,874 million (Dec. 31, 2019: €51,742 million).
Total shareholders’ equity decreased by 2% (increased by 6% in constant currency) to €26,023 million (Dec. 31, 2019: €26,580 million). The equity ratio was 39.0% (Dec. 31, 2019: 39.7%).
Group debt decreased by 5% (-2% in constant currency) to €25,913 million (Dec. 31, 2019: € 27,258 million). Group net debt decreased by 6% (-4% in constant currency) to € 24,076 million (Dec. 31, 2019: € 25,604 million), driven by the exceptional cash flow development.
As of December 31, 2020, the net debt/EBITDA ratio improved to 3.44x1,2 (Dec. 31, 2019: 3.61x1,2) driven by the exceptional cash flow development, despite COVID-19 effects weighing on EBITDA.
1 At LTM average exchange rates for both net debt and EBITDA; pro forma closed acquisitions/divestitures
2 Before special items
For a detailed overview of special items please see the reconciliation tables on pages 20-22 in the PDF document.
Business Segments
Fresenius Medical Care (Financial data according to Fresenius Medical Care press release)
Fresenius Medical Care is the world's largest provider of products and services for individuals with renal diseases. As of December 31, 2020, Fresenius Medical Care was treating 346,553 patients in 4,092 dialysis clinics. Along with its core business, the Renal Care Continuum, the company focuses on expanding in complementary areas and in the field of critical care.

- 2020 financial targets achieved: 5% revenue and 12% net income growth
- Reported earnings in Q4 negatively impacted by impairment in the Latin America region and accelerated excess mortality due to COVID-19
- Growth in home dialysis on track
Sales of Fresenius Medical Care decreased by 4% (increased by 4% in constant currency) to €4,400 million (Q4/19: €4,580 million). Thus, currency translation had a negative effect of 8%. Organic growth was 1%. Acquisitions/divestitures contributed net 3% to growth. In FY/20, Fresenius Medical Care increased sales by 2% (5% in constant currency) to €17,859 million (FY/19: €17,477 million). Thus, currency translation had a negative effect of 3%. Organic growth was 3%. Acquisitions/divestitures contributed net 2% to growth.
Reported EBIT decreased by 25% (-18% in constant currency) to €462 million (Q4/19: €616 million). The decrease was mainly due to a macro-economic driven impairment of goodwill and tradenames in the Latin America segment, unfavorable COVID-19 effects and a lower reimbursement for calcimimetics. The reported EBIT margin was 10.5% (Q4/19: 13.5%). EBIT on an adjusted basis decreased by 1% (increased by 5% in constant currency) to €657 million (Q4/19: €663 million). The EBIT margin on an adjusted basis was 14.9% (Q4/19: 14.5%).
In FY/20, reported EBIT increased by 2% (4% in constant currency) to €2,304 million (FY/19: €2,270 million). The reported EBIT margin was 12.9% (FY/19: 13.0%). EBIT on an adjusted basis increased by 6% (8% in constant currency) to €2,499 million (FY/19: €2,356 million). The EBIT margin on an adjusted basis was 14.0% (FY/19: 13.5%).
1 Before special items
2 Net income attributable to shareholders of Fresenius Medical Care AG & Co. KGaA
For a detailed overview of special items please see the reconciliation tables on pages 20-22 in the PDF document.
Reported net income1 decreased by 48% (-43% in constant currency) to €177 million (Q4/19: €343 million) and increased on an adjusted basis by 1% (6% in constant currency) to €372 million (Q4/19: €368 million). In FY/20, reported net income1 decreased by 3% (-1% in constant currency) to €1,164 million (FY/19: €1,200 million) and increased on an adjusted basis by 10% (12% in constant currency) to €1,359 million (FY/19: €1,236 million).
Operating cash flow was €584 million (Q4/19: €771 million) with a margin of 13.3% (Q4/19: 16.8%). In FY/20, operating cash flow was €4,233 million (FY/19: €2,567 million) with a margin of 23.7% (FY/19: 14.7%). The increase was largely driven by the U.S. federal relief funding and advanced payments under the CARES Act and other COVID-19 relief, as well as working capital improvements driven by cash collections.
For FY/21, Fresenius Medical Care expects revenue2 to grow at a low- to mid-single digit percentage range and net income1,3 to decline at a high-teens to mid-twenties percentage range against the higher than expected 2020 base4.
For further information, also on the FME25 program, please see Fresenius Medical Care’s press release at www.freseniusmedicalcare.com.
1 Net income attributable to shareholders of Fresenius Medical Care AG & Co. KGaA
2 FY/20 base: €17,859 million
3 FY/20 base: €1,359 million, before special items; FY/21: before special items
4 These targets are based on the 2020 results excluding the impairment of goodwill and trade names in the Latin America Segment of €195 million. They are inclusive of anticipated COVID-19 effects, in constant currency and exclude special items. Special items include costs related to FME25 and other effects that are unusual in nature and have not been foreseeable or not foreseeable in size or impact at the time of giving guidance.
For a detailed overview of special items please see the reconciliation tables on pages 20-22 in the PDF document.
Fresenius Kabi
Fresenius Kabi offers intravenously administered generic drugs, clinical nutrition and infusion therapies for seriously and chronically ill patients in the hospital and outpatient environments. The company is also a leading supplier of medical devices and transfusion technology products. In the biosimilars business, Fresenius Kabi develops products with a focus on oncology and autoimmune diseases.

- In North America fewer elective treatments, competitive pressure and temporary manufacturing issues outweighed extra demand for COVID-19 related products
- Europe showed strong organic sales growth in Q4 primarily based on extra demand for COVID-19 related products; China with healthy organic growth
- Strong EBIT growth in Emerging Markets with positive development in China only partially compensates EBIT decrease in North America
Sales increased by 3% (8% in constant currency) to €1,815 million (Q4/19: €1,766 million). Organic growth was 7%. Negative currency translation effects of 5% were mainly related to weakness of the US dollar, the Brazilian real and the Argentinian peso. Estimated COVID-19 effects made a slight positive contribution to sales growth. In FY/20, sales increased by 1% (4% in constant currency) to €6,976 million (FY/19: €6,919 million). Organic growth was 4%. Negative currency translation effects of 3% were mainly related to the weakness of the US dollar, the Brazilian real and the Argentinian peso. Estimated COVID-19 effects slightly reduced sales growth.
Sales in North America decreased by 10% (organic growth: -3%) to €549 million (Q4/19: €609 million). The decrease was driven by fewer elective treatments, supply constraints for certain products due to temporary manufacturing issues and competitive pressure, which outweighed extra demand for COVID-19 related products. In FY/20, sales in North America decreased by 2% (organic growth: 0%) to €2,376 million (FY/19: €2,424 million). Sales in Europe increased by 13% (organic growth: 9%) to €680 million (Q4/19: €604 million) mainly due to increased demand for COVID-19 related products. In FY/20, sales in Europe increased by 6% (organic growth: 6%) to €2,458 million (FY/19: €2,313 million). Sales in Asia-Pacific increased by 11% (organic growth: 14%) to €428 million (Q4/19: €385 million). While China saw a solid recovery based on increasing elective procedures, other Asian markets were lagging behind. In FY/20, sales in Asia-Pacific decreased by 1% (organic growth: 1%) to €1,497 million (FY/19: €1,506 million). Sales in Latin America/Africa decreased by 6% (organic growth: 16%) to €158 million (Q4/19: €168 million). In FY/20, sales in Latin America/Africa decreased by 5% (organic growth: 17%) to €645 million (FY/19: €676 million).
1 Before special items
2 Net income attributable to shareholders of Fresenius SE & Co. KGaA
For a detailed overview of special items please see the reconciliation tables on pages 20-22 in the PDF document.
EBIT before special items decreased by 17% (-10% in constant currency) to €236 million (Q4/191: €285 million) with an EBIT margin before special items of 13.0% (Q4/191:16.1%). The decline is driven by headwinds leading to some underutilized production capacities in the US, coupled with selective supply constraints due to temporary manufacturing issues, incremental COVID-19 related expenses, competitive pressure, a negative effect due to the bankruptcy of a customer as well as planned SG&A spending ahead of the launch of the company’s first US biosimilar. Lower corporate costs due to travel restrictions and phasing of projects partially offset the decline. Estimated COVID-19 effects had a moderate negative impact on EBIT growth in Q4/20. In FY/20, EBIT before special items decreased by 9% (-6% in constant currency) to €1,095 million (FY/191: €1,205 million) with an EBIT margin before special items of 15.7% (FY/191: 17.4%). Estimated COVID-19 effects had an insignificant impact on EBIT growth in FY/20.
Net income1,2 decreased by 19% (-11% in constant currency) to €148 million (Q4/191: €183 million). In FY/20, net income1,2 decreased by 8% (-5% in constant currency) to €730 million (FY/191: €797 million).
Operating cash flow increased to €307 million (Q4/19: €291 million) with a margin of 16.9% (Q4/19: 16.5%). In FY/20, operating cash flow increased by 11% to €1,143 million (FY/19: €1,028 million) with a margin of 16.4% (FY/19: 14.9%) due to the favorable working capital development.
For FY/21, Fresenius Kabi expects organic sales3 growth in a low to mid-single digit percentage range. Constant currency EBIT4 is expected to show a stable development up to low single digit percentage growth. Both sales and EBIT outlook include expected COVID-19 effects.
1 Before special items
2 Net income attributable to shareholders of Fresenius SE & Co. KGaA
3 FY/20 base: €6,976 million
4 FY/20 base: €1,095 million, before special items, FY/21: before special items
For a detailed overview of special items please see the reconciliation tables on pages 20-22 in the PDF document.
Fresenius Helios
Fresenius Helios is Europe's leading private hospital operator. The company comprises Helios Germany and Helios Spain (Quirónsalud). Helios Germany operates 89 hospitals, ~130 outpatient centers and 6 prevention centers. Quirónsalud operates 46 hospitals, 70 outpatient centers and around 300 occupational risk prevention centers. In addition, the company is active in Latin America with 6 hospitals and as a provider of medical diagnostics.

- Recovery of elective procedures in Spain in Q4
- Continued financial support provided by German government throughout Q4
- Helios Spain with strong organic sales and EBIT growth based on catch-up effects additionally fueled by contributions from acquisitions in Latin America
Sales increased by 13% (13% in constant currency) to €2,637 million (Q4/19: €2,344 million). Organic growth was 9%. Acquisitions contributed 4% to sales growth. COVID-19 effects had an insignificant effect on organic growth. In FY/20, sales increased by 6% (7% in constant currency) to €9,818 million (FY/19: €9,234 million). Organic growth was 4%. Acquisitions contributed 3% to sales growth. COVID-19 effects had a slight negative impact on organic growth.
Sales of Helios Germany increased by 11% (organic growth: 8%) to €1,637 million (Q4/19: €1,475 million). In FY/20, sales of Helios Germany increased by 7% (organic growth: 6%) to €6,340 million (FY/19: €5,940 million). COVID-19 effects were mitigated by government financial support and hence had only a slight negative impact on organic growth in both Q4/20 and FY/20.
Sales of Helios Spain increased by 15% (17% in constant currency) to €999 million (Q4/19: €867 million). Organic growth of 11% was driven by a strong recovery of elective procedures and a consistently high level of outpatient treatments. Thus, COVID-19 effects had a moderate positive impact on organic growth in Q4. The hospital acquisitions in Colombia contributed 6% to sales growth. In FY/20, sales of Helios Spain increased by 6% (7% in constant currency) to €3,475 million (FY/19: €3,292 million). Organic growth was 2%. Acquisitions contributed 5% to sales growth. COVID-19 effects had a significant negative impact on organic sales growth.
1 Net income attributable to shareholders of Fresenius SE & Co. KGaA
EBIT of Fresenius Helios increased by 12% (13% in constant currency) to €328 million (Q4/19: €294 million) with an EBIT margin of 12.4% (Q4/19: 12.5%). COVID-19 effects, in particular due to the strong recovery of elective procedures in Spain, had a significant positive effect on EBIT growth in Q4. In FY/20, EBIT of Fresenius Helios remained on prior year’s level (0% in constant currency) at €1,025 million (FY/19: €1,025 million) with an EBIT margin of 10.4% (FY/19: 11.1%). COVID-19 effects had a moderate negative impact on EBIT growth.
EBIT of Helios Germany increased by 10% to €157 million (Q4/19: €143 million) with an EBIT margin of 9.6% (Q4/19: 9.7%). Financial support provided by the German government under revised regulations focusing on regions with high COVID incidences broadly offset additional headwinds as Helios Germany continued to play a crucial role in treating COVID-19 patients. In FY/20, EBIT of Helios Germany increased by 4% to €602 million (FY/19: €577 million) with an EBIT margin of 9.5% (FY/19: 9.7%). Due to the comprehensive financial support provided by the German government, COVID-19 effects had an overall insignificant impact on the EBIT development.
EBIT of Helios Spain increased by 17% (19% in constant currency) to €159 million (Q4/19: €136 million) with an EBIT margin of 15.9% (Q4/19: 15.7%). The growth is driven by a recovery of elective procedures following the government-ordered postponement of planned surgical procedures in Q2, where medically justifiable. Thus, COVID-19 effects had a significant positive effect on EBIT growth in Q4. In FY/20, EBIT of Helios Spain decreased by 5% (-5% in constant currency) to €420 million (FY/19: €443 million) with an EBIT margin of 12.1% (FY/19: 13.5%). COVID-19 effects had a very significant negative impact on EBIT growth with missing or delayed elective procedures and higher expenses amid the comprehensive efforts to combat the pandemic.
Net income1 increased by 14% to €225 million (Q4/19: €197 million). In FY/20, net income1 remained on prior year’s level at €666 million (FY/19: €664 million).
Operating cash flow increased to €434 million (Q4/19: €226 million) with a margin of 16.5% (Q4/19: 9.6%), driven by phasing of payments under the German law to ease the financial burden on hospitals. In FY/20, operating cash flow increased to €1,149 million (FY/19: €733 million) with a margin of 11.7% (FY/19: 7.9%).
1 Net income attributable to shareholders of Fresenius SE & Co. KGaA
For FY/21, Fresenius Helios expects organic sales1 growth in a low to mid-single digit percentage range and constant currency EBIT2 growth in a mid to high single digit percentage range. Both sales and EBIT outlook include expected COVID-19 effects.
1 FY/20 base: €9,818 million
2 FY/20 base: €1,025 million; FY/21 before special items
Fresenius Vamed
Fresenius Vamed manages projects and provides services for hospitals and other health care facilities worldwide and is a leading post-acute care provider in Central Europe. The portfolio ranges along the entire value chain: from project development, planning, and turnkey construction, via maintenance and technical management to total operational management.

- Significant COVID-19 impact in the project business related to delays, cancellations and global supply chain restraints continued
- Good order intake in Q4 indicates first signs of recovery in project business
- Rehabilitation business continued to be impacted by less demand for rehabilitation treatments and postponements of elective surgeries; technical service business remained robust
Sales decreased by 22% (-22% in constant currency) to €577 million (Q4/19: €737 million). Organic growth was -22%. Acquisitions did not contribute to growth. Estimated COVID-19 effects had a very significant negative impact on growth. In FY/20, sales decreased by 6% (-6% in constant currency) to €2,068 million (FY/19: €2,206 million). Organic growth was -8%. Acquisitions contributed 2% to growth. Estimated COVID-19 effects had a very significant negative impact on growth.
Sales in the service business decreased by 1% to €372 million (Q4/19: €374 million).
Sales in the project business decreased by 44% to €205 million (Q4/19: €363 million), driven by postponements and cancellations of projects. In FY/20, sales in the service business grew by 3% to €1,435 million (FY/19: €1,399 million). Sales in the project business decreased by 22% to €633 million (FY/19: €807 million).
1 Net income attributable to shareholders of VAMED AG
EBIT decreased by 42% (-42% in constant currency) to €39 million (Q4/19: €67 million) with an EBIT margin of 6.8% (Q4/19: 9.1%). Estimated COVID-19 effects had a very significant negative impact on EBIT. Capacities in the post-acute care clinics were left partially empty given a generally lower intake of elective surgery patients from acute-care hospitals. Authority-instigated restrictions or even closures of individual facilities also had a negative effect. In the project business, project delays and global supply chain restraints triggered incremental expenses. In FY/20, EBIT decreased by 78% (-79% in constant currency) to €29 million (FY/19: €134 million) with an EBIT margin of 1.4% (FY/19: 6.1%). Estimated COVID-19 effects had a very significant negative impact on EBIT.
Net income1 decreased to €25 million (Q4/19: €44 million). In FY/20, net income1 decreased to €2 million (FY/19: €83 million).
Order intake was €648 million in Q4/20 (Q4/19: €576 million) and €1,010 million in FY/20 (FY/19: €1,314 million). As of December 31, 2020, order backlog was at €3,055 million (December 31, 2019: €2,865 million). Order intake and order backlog were marked by COVID-19 related cancellations and project delays.
Operating cash flow increased to €74 million (Q4/19: €0 million) with a margin of 12.8% (Q4/19: 0%), driven by a favorable working capital development mainly related to pre-payments. In FY/20, operating cash flow increased to €78 million (FY/19: -€17 million) with a margin of 3.8% (FY/19: -0.8%).
For FY/21, Fresenius Vamed expects organic sales2 growth in a mid to high single digit percentage range and EBIT3 to grow to a high double-digit euro million amount. Both sales and EBIT outlook include expected negative COVID-19 effects.
1 Net income attributable to shareholders of VAMED AG
2 FY/20 base: €2,068 million
3 FY/20 base: €29 million; FY/21 before special items
Conference Call
As part of the publication of the results for FY 2020, a conference call will be held on February 23, 2021 at 1:30 p.m. CET (7:30 a.m. EST). All investors are cordially invited to follow the conference call in a live broadcast over the Internet at www.fresenius.com/investors. Following the call, a replay will be available on our website.
For additional information on the performance indicators used please refer to our website https://www.fresenius.com/alternative-performance-measures.
This release contains forward-looking statements that are subject to various risks and uncertainties. Future results could differ materially from those described in these forward-looking statements due to certain factors, e.g. changes in business, economic and competitive conditions, regulatory reforms, results of clinical trials, foreign exchange rate fluctuations, uncertainties in litigation or investigative proceedings, and the availability of financing. Fresenius does not undertake any responsibility to update the forward-looking statements in this release.
Fresenius has proven the resilience of its business model in a challenging environment in FY/20. Based on preliminary and unaudited results, Fresenius achieved its sales and net income1 guidance including COVID-19 effects. Fresenius expected sales growth2 of 3% to 6% and a net income1,3 development at the lower end of a range of -4% to +1%, both in constant currency.
Excluding estimated COVID-19 effects, the Group performed very well against its original guidance ranges of 4% to 7% sales growth and 1% to 5% net income1,3 growth, both in constant currency.
The previously flagged risk of an impairment of goodwill and tradenames at Fresenius Medical Care Latin America, as a consequence of the macro-economic downturn and increasing risk adjustment rates for certain countries in Latin America, has materialized and impacts reported FY/20 Group net income1.
Fresenius firmly intends to extend its track record of 27 consecutive dividend increases.
1 Net income attributable to shareholders of Fresenius SE & Co. KGaA
2 FY/19 base: €35,409 million
3 FY/19 base: €1,879 million; before special items (transaction-related expenses, revaluations of biosimilars contingent purchase price liabilities, gain related to divestitures of Care Coordination activities at FMC, expenses associated with the cost optimization program at FMC); FY/20: before special items
Current expectations for FY/21
Based on the current status of the Group’s financial planning process and assuming that the current burdens and constraints caused by the COVID-19 pandemic only begin to recede in the second half of the year, Fresenius targets healthy sales growth1 and at least broadly stable net income2 year over year in FY/21.
The FY/21 earnings are, hence, expected to be very meaningfully impacted by COVID-19 effects. In particular, the significant acceleration of mortality among dialysis patients due to COVID-19 is expected to have a material impact on Fresenius Medical Care’s results and hence on Fresenius Group’s net income2 growth.
Fresenius continues to monitor and analyse the COVID-19 pandemic and associated implications, including the availability of government support, as well as pace, adoption and effectiveness of vaccinations, and will comment further as part of its FY/20 earnings call.
Stephan Sturm, CEO of Fresenius, said: “In 2020, we coped well with the burdens and restrictions caused by the pandemic. For 2021, I am confident that our Company will continue to perform solidly - despite the COVID-related impact on earnings anticipated at Fresenius Medical Care. Our underlying growth prospects remain robust. Fresenius continues to make a significant contribution to overcoming this global health crisis as swiftly as possible. Since the beginning of the pandemic, we have made an enormous effort to ensure that our patients continue to receive excellent medical care and that they – as well as our employees – are protected from infection. For this to succeed, close cooperation between all partners in the healthcare sector is needed more than ever, backed by political support. For instance, the conditions must be created to vaccinate the particularly vulnerable group of dialysis patients with high priority. We must not forget: Behind the numbers are people’s fates. Every single patient, every life counts.”
1 In constant currency
2 Net income attributable to shareholders of Fresenius SE & Co. KGaA; in constant currency; before any special items and any one-time expenses related to likely efficiency and cost saving programs
Efficiency and cost saving programs
To counter the current challenging business environment, Fresenius will launch additional initiatives across the Group to further improve profitability. More details will be announced with the publication of FY/20 results.
Group medium-term targets
The current information and assumptions do not trigger a revision of Fresenius’ medium-term growth targets, which were set before the COVID-19 pandemic emerged. As usual, the company will give an update on its medium-term expectations with the publication of its FY/20 results.
Next steps
Fresenius will announce more detailed FY/21 financial guidance with the release of its FY/20 results on February 23, 2021.
For additional information on the performance indicators used please refer to our website at https://www.fresenius.com/alternative-performance-measures.
This release contains forward-looking statements that are subject to various risks and uncertainties. Future results could differ materially from those described in these forward-looking statements due to certain factors, e.g. changes in business, economic and competitive conditions, regulatory reforms, results of clinical trials, foreign exchange rate fluctuations, uncertainties in litigation or investigative proceedings, and the availability of financing. Fresenius does not undertake any responsibility to update the forward-looking statements in this release.
- Fresenius Medical Care with continued strong earnings growth in constant currency
- Fresenius Kabi showed a recovery in Europe and return to growth in China whilst headwinds weigh on North American business
- Helios Germany with sales growth in Q3 due to recovery of elective procedures; Helios Spain with significant growth based on catch-up effects
- Fresenius Vamed continues to be heavily impacted by COVID-19 related project delays, high-end technical service remained robust
If no timeframe is specified, information refers to Q3/2020; 2020 and 2019 according to IFRS 16

1 Before special items
2 Net income attributable to shareholders of Fresenius SE & Co. KGaA
For a detailed overview of special items please see the reconciliation tables on pages 17-19 in the PDF document.
Stephan Sturm, CEO of Fresenius, said: "Fresenius remains stable and resilient, and was able to show it once again in the third quarter. Despite the ongoing and in some cases drastic restrictions caused by COVID-19, our patients could continue to rely on and benefit from our care. Fresenius is also reliable, in terms of business development: We forecasted that after a second quarter impacted by the lockdowns our sales and earnings would resume their positive trajectory – and they did just that. Despite the coronavirus, we were even able to achieve a strong increase in sales over last year’s third quarter. Our quarterly earnings of €427 million are also robust. We are well prepared for the challenges that the pandemic will pose to us over the coming months. As a result, I remain confident that we will reach our 2020 targets and continue our healthy growth in the coming years."
FY/20 Group guidance
Based on the Group’s solid business development in Q1-3/20, Fresenius confirms its sales and net income guidance for 2020 including estimated COVID-19 effects. Fresenius projects sales growth1 of 3% to 6% in constant currency. Net income2,3 is expected to develop in a range of - 4% to +1%.
Fresenius projects net debt/EBITDA4 to be around the top-end of the self-imposed target corridor of 3.0x to 3.5x by the end of FY/20 including estimated COVID-19 effects.
COVID-19 will continue to impact Fresenius’ operations in Q4/20. Fresenius recognizes the increasing COVID-19 case numbers, and the associated various containment measures being enacted in many of the Company’s relevant markets. Thus, the Group’s FY/20 guidance assumes no containment measures that have a significant and direct impact on the health care sector that are not appropriately compensated.
1 FY/19 base: €35,409 million
2 Net income attributable to shareholders of Fresenius SE & Co. KGaA
3 FY/19 base: €1,879 million; before special items (transaction-related expenses, revaluations of biosimilars contingent purchase price liabilities, gain related to divestitures of Care Coordination activities at FMC, expenses associated with the cost optimization program at FMC); FY/20: before special items
4 At LTM average exchange rates for both net debt and EBITDA; pro forma closed acquisitions/divestitures; excluding further potential acquisitions; before special items
For a detailed overview of special items please see the reconciliation tables on pages 17-19 in the PDF document.
5% sales growth in constant currency
Group sales increased by 1% (5% in constant currency) to €8,918 million (Q3/19: €8,842 million). Organic sales growth was 3%. Acquisitions/divestitures contributed net 2% to growth. Currency translation had a negative impact on sales growth of 4%. Excluding estimated COVID-19 effects1, Group sales growth would have been 6% to 7%, in constant currency. In Q1-3/20, Group sales increased by 3% (5% in constant currency) to €26,973 million (Q1-3/19: €26,098 million). Organic sales growth was 3%. Acquisitions/divestitures contributed net 2% to growth. Currency translation had a negative impact on sales growth of 2%. Excluding estimated COVID-19 effects1, Group sales growth would have been 7% to 8% in constant currency.
1% net income2,3 growth in constant currency
Group EBITDA decreased by 2% (increased by 2% in constant currency) to €1,729 million (Q3/192: €1,763 million). In Q1-3/20, Group EBITDA increased by 2% (2% in constant currency) to €5,246 million (Q1-3/192: €5,167 million).
Group EBIT decreased by 3% (increased by 1% in constant currency) to €1,113 million (Q3/192: €1,153 million). The missing contribution from elective procedures, volume headwinds leading to underutilized production capacities, COVID-19 related project delays at Fresenius Vamed as well as Group-wide COVID-19 related expenses weighed on EBIT. The EBIT margin was 12.5% (Q3/192: 13.0%). In Q1-3/20, Group EBIT decreased by 1% (0% in constant currency) to €3,361 million (Q1-3/192: €3,401 million). The EBIT margin was 12.5% (Q1-3/192: 13.0%). Following higher levels of investments in recent years, Fresenius sees higher levels of depreciation and amortization in 2020.
Group net interest before special items improved to -€154 million (Q3/19: -€171 million) mainly due to successful refinancing activities, lower interest rates as well as currency translation effects. Reported Group net interest improved to -€154 million (Q3/19: -€172 million). In Q1-3/20, Group net interest before special items improved to -€495 million (Q1-3/19: -€532 million) while reported Group net interest improved to -€503 million (Q1-3/19: -€535 million).
1 For estimated COVID-19 effects in Q3/20 and Q1-3/20 please see table on page 15 in the PDF document.
2 Before special items
3 Net income attributable to shareholders of Fresenius SE & Co. KGaA
For a detailed overview of special items please see the reconciliation tables on pages 17-19 in the PDF document.
The Group tax rate before special items (Q3/19: 23.1%) and the reported Group tax rate (Q3/19: 21.2%) were 22.0%. In Q1-3/20, the Group tax rate before special items (Q1-3/19: 23.1%) and the reported Group tax rate (Q1-3/19: 22.4%) were 22.7%.
Noncontrolling interests before special items and reported noncontrolling interests were €321 million (Q3/19: both €310 million), of which 97% were attributable to the noncontrolling interests in Fresenius Medical Care. In Q1-3/20, noncontrolling interests before special items and reported were €913 million (Q1-3/19 before special items: €834 million; reported €826 million).
Group net income1 before special items decreased by 4% (increased by 1% in constant currency) to €427 million (Q3/19: €445 million). Excluding estimated COVID-19 effects2, net income before special items and in constant currency would have grown 1% to 5%. Reported Group net income1 was €427 million (Q3/19: €444 million). In Q1-3/20, Group net income1 before special items decreased by 5% (-4% in constant currency) to €1,302 million (Q1-3/19: €1,373 million). Excluding estimated COVID-19 effects2, net income before special items and in constant currency would have grown 2% to 6%. Reported Group net income1 was €1,297 million (Q1-3/19: €1,368 million).
Earnings per share1 before special items decreased by 4% (0% in constant currency) to €0.77 (Q3/19: €0.80). Reported earnings per share1 were €0.77 (Q3/19: €0.80). In Q1-3/20, earnings per share1 before special items decreased by 5% (-4% in constant currency) to €2.34 (Q1-3/19: €2.47). Reported earnings per share1 were €2.33 (Q1-3/19: €2.46).
Continued investment in growth
Spending on property, plant and equipment was €521 million corresponding to 6% of sales (Q3/19: €586 million; 7% of sales). These investments served primarily for the modernization and expansion of dialysis clinics, production facilities as well as hospitals, and day clinics. Despite the COVID-19 pandemic, Fresenius has been largely able to continue its investment programs, although there remains some uncertainty on the timing of projects for the remainder of the year. In Q1-3/20, spending on property, plant and equipment was €1,542 million corresponding to 6% of sales (Q1-3/19: €1,592 million; 6% of sales).
Total acquisition spending was €142 million (Q3/19: €135 million). In Q1-3/20, total acquisition spending was €651 million, mainly for the acquisition of three hospitals in Colombia by Fresenius Helios (Q1-3/19: €2,292 million, mainly for the acquisition of NxStage by Fresenius Medical Care).
1 Net income attributable to shareholders of Fresenius SE & Co. KGaA
2 For estimated COVID-19 effects in Q3/20 and Q1-3/20 please see table on page 15 in the PDF document.
For a detailed overview of special items please see the reconciliation tables on pages 17-19 in the PDF document.
Good cash flow development
Group operating cash flow was €1,199 million (Q3/19: €1,483 million) with a margin of 13.4% (Q3/19: 16.8%). Free cash flow before acquisitions and dividends was €682 million (Q3/19: €907 million). Given dividend payment in Q3/20 versus Q2/19, Free cash flow after acquisitions and dividends was -€185 million (Q3/19: €732 million).
In Q1-3/20, Group operating cash flow increased to €5,159 million (Q1-3/19: €2,977 million) with a margin of 19.1% (Q1-3/19: 11.4%). The increase was largely driven by Fresenius Medical Care due to the U.S. federal relief funding and advanced payments under the Coronavirus Aid, Relief and Economic Security Act (CARES Act) as well as by the shorter payment periods of the COVID-19 governmental compensation and reimbursement scheme for Helios Germany. Free cash flow before acquisitions and dividends was €3,593 million (Q1-3/19: €1,388 million). Free cash flow after acquisitions and dividends was €2,149 million (Q1-3/19: -€1,634 million, driven by the acquisition of NxStage by Fresenius Medical Care).
Solid balance sheet structure
Group total assets increased by 2% (5% in constant currency) to €68,321 million (Dec. 31, 2019: €67,006 million). Current assets increased by 10% (15% in constant currency) to €16,833 million (Dec. 31, 2019: €15,264 million), mainly driven by the increase of cash and cash equivalents. Non-current assets remained nearly unchanged (2% in constant currency) at €51,488 million (Dec. 31, 2019: €51,742 million).
Total shareholders’ equity decreased by 1% (increased by 4% in constant currency) to €26,201 million (Dec. 31, 2019: €26,580 million). The equity ratio was 38.3% (Dec. 31, 2019: 39.7%).
Group debt remained nearly unchanged (increased by 1% in constant currency) at €27,171 million (Dec. 31, 2019: € 27,258 million). Group net debt decreased by 4% (-3% in constant currency) to € 24,513 million (Dec. 31, 2019: € 25,604 million), driven by the exceptional cash flow development.
As of September 30, 2020, the net debt/EBITDA ratio improved to 3.45x1,2 (Dec. 31, 2019: 3.61x1,2) driven by the exceptional cash flow development, despite COVID-19 effects weighing on EBITDA.
1 At LTM average exchange rates for both net debt and EBITDA; pro forma closed acquisitions/divestitures
2 Before special items
For a detailed overview of special items please see the reconciliation tables on pages 17-19 in the PDF document.
Business Segments
Fresenius Medical Care (Financial data according to Fresenius Medical Care press release)
Fresenius Medical Care is the world's largest provider of products and services for individuals with renal diseases. As of September 30, 2020, Fresenius Medical Care was treating 349,167 patients in 4,073 dialysis clinics. Along with its core business, the company provides related medical services in the field of Care Coordination.

- Solid sales and strong earnings growth at constant currency continues in Q3
- Q3 development impacted by currency headwinds and expected lower reimbursement from calcimimetics
- Guidance for FY/20 confirmed
Sales of Fresenius Medical Care remained on prior year’s level (increased by 6% in constant currency) at €4,414 million (Q3/19: €4,419 million). Organic sales growth was 3%. Acquisitions/divestitures contributed net 3% to growth. In Q1-3/20, Fresenius Medical Care increased sales by 4% (6% in constant currency) to €13,459 million (Q1-3/19: €12,897 million). Organic sales growth was 4%.
There were no adjustments to reported EBIT in Q3/20 and Q1-3/20. Reported EBIT increased by 6% (11% in constant currency) to €632 million (Q3/19: €595 million). The reported EBIT margin was 14.3% (Q3/19: 13.5%). The increase in margin was driven by negative prior year earnings effects, an increase in commercial revenue and favorable cost management of pharmaceuticals, offsetting the lower reimbursement for calcimimetics, all in the North America region. EBIT on an adjusted basis increased by 2% (7% in constant currency) to €632 million (Q3/19: €620 million). The EBIT margin on an adjusted basis was 14.3% (Q3/19: 14.0%).
1 Before special items
2 Net income attributable to shareholders of Fresenius Medical Care AG & Co. KGaA
For a detailed overview of special items please see the reconciliation tables on pages 17-19 in the PDF document.
In Q1-3/20, reported EBIT increased by 11% (12% in constant currency) to €1,843 million (Q1-3/19: €1,653 million). The reported EBIT margin was 13.7% (Q1-3/19: 12.8%). EBIT on an adjusted basis increased by 9% (9% in constant currency) to €1,843 million (Q1-3/19: €1,693 million). The EBIT margin on an adjusted basis was 13.7% (Q1-3/19: 13.1%).
There were no adjustments to reported net income in Q3/20 and Q1-3/20. Reported net income1 grew by 6% (11% in constant currency) to €354 million (Q3/19: €333 million) and increased on an adjusted basis by 7% (11% in constant currency) to €354 million (Q3/19: €332 million). In Q1-3/20, reported net income1 grew by 15% (15% in constant currency) to €987 million (Q1-3/19: €857 million) and increased on an adjusted basis by 14% (14% in constant currency) to €987 million (Q1-3/19: €868 million).
Operating cash flow was €746 million (Q3/19: €868 million) with a margin of 16.9% (Q3/19: 19.7%). In Q1-3/20, operating cash flow was €3,649 million (Q1-3/19: €1,796 million) with a margin of 27.1% (Q1-3/19: 13.9%). The increase was largely driven by the U.S. federal relief funding and advanced payments under the CARES Act and other COVID-19 relief, as well as working capital improvements driven by cash collections.
Fresenius Medical Care continues to expect both revenue2 and net income1,3 to grow at a mid to high single digit rate in 2020. These targets are inclusive of anticipated COVID-19 effects, in constant currency and exclude special items4. They are based on the adjusted results 2019, including the effects of the operations of the NxStage acquisition and the IFRS 16 implementation.
For further information, please see Fresenius Medical Care’s press release at www.freseniusmedicalcare.com.
1 Net income attributable to shareholders of Fresenius Medical Care AG & Co. KGaA
2 FY/19 base: €17,477 million
3 FY/19 base: €1,236 million (FY/20: before special items)
4 Special items are effects that are unusual in nature and have not been foreseeable or not foreseeable in size or impact at the time of giving guidance.
For a detailed overview of special items please see the reconciliation tables on pages 17-19 in the PDF document.
Fresenius Kabi
Fresenius Kabi offers intravenously administered generic drugs, clinical nutrition and infusion therapies for seriously and chronically ill patients in the hospital and outpatient environments. The company is also a leading supplier of medical devices and transfusion technology products. In the biosimilars business, Fresenius Kabi develops products with a focus on oncology and autoimmune diseases.

- In North America decreased demand given fewer elective treatments and some supply constraints due to temporary manufacturing issues outweighed extra demand for COVID-19 related products
- China recovery accelerates with elective treatments rebounding nearly to pre-pandemic levels
- Strong EBIT growth in Europe and positive development in China only partially compensates EBIT decrease in North America
- FY/20 guidance confirmed
Sales decreased by 4% (increased by 2% in constant currency) to €1,694 million (Q3/19: €1,761 million). Organic sales growth was 2%. Negative currency translation effects of 6% were mainly related to weakness of the US dollar, the Brazilian real and the Argentinian peso. Estimated COVID-19 effects had a slight negative impact on sales growth. In Q1-3/20, sales remained on prior year’s level (increased by 3% in constant currency) at €5,161 million (Q1-3/19: €5,153 million). Organic sales growth was 3%. Negative currency translation effects of 3% were mainly related to weakness of the Brazilian real and the Argentinian peso. Estimated COVID-19 effects had a slight negative impact on sales growth in Q1-3/20.
Sales in North America decreased by 10% (organic growth: -5%) to €558 million (Q3/19: €619 million). The decrease was driven by fewer elective treatments and supply constraints for certain products due to temporary manufacturing issues, which outweighed extra demand for COVID-19 related products. In Q1-3/20, sales in North America increased by 1% (organic growth: 1%) to €1,827 million (Q1-3/19: €1,815 million). Sales in Europe increased by 3% (organic growth: 5%) to €581 million (Q3/19: €564 million). In Q1-3/20, sales in Europe increased by 4% (organic growth: 5%) to €1,778 million (Q1-3/19: €1,709 million). Sales in Asia-Pacific decreased by 2% (organic growth: increased by 1%) to €399 million (Q3/19: €406 million). While China saw a solid recovery based on increasing elective procedures, other Asian markets are lagging behind. In Q1-3/20, sales in Asia-Pacific decreased by 5% (organic growth: -3%) to €1,069 million (Q1-3/19: €1,121 million).
Sales in Latin America/Africa decreased by 9% (organic growth increased by 17%) to €156 million (Q3/19: €172 million). In Q1-3/20, sales in Latin America/Africa decreased by 4% (organic growth increased by 17%) to €487 million (Q1-3/19: €508 million).
EBIT before special items decreased by 9% (-4% in constant currency) to €278 million (Q3/191: €307 million) with an EBIT margin of 16.4% (Q3/191:17.4%). The decline is driven by headwinds leading to some underutilized production capacities in the US, coupled with selective supply constraints due to temporary manufacturing issues, incremental COVID-19 related expenses as well as a negative effect related to a write down of a receivable. Estimated COVID-19 effects, primarily lower share based remuneration costs given the capital markets situation, but also lower corporate costs due to travel restrictions and phasing of projects, had a moderate positive impact on EBIT growth. In Q1-3/20, EBIT before special items decreased by 7% (-5% in constant currency) to €859 million (Q1-3/191: €920 million) with an EBIT margin of 16.6% (Q1-3/191: 17.9%). Estimated COVID-19 effects had a slight positive impact on EBIT growth in Q1-3/20.
Net income1,2 decreased by 7% (-1% in constant currency) to €189 million (Q3/19: €203 million). In Q1-3/20, net income1,2 decreased by 5% (-3% in constant currency) to €582 million (Q1-3/19: €614 million).
Operating cash flow decreased to €225 million (Q3/19: €377 million) with a margin of 13.3% (Q3/19: 21.4%). After an excellent operating cash flow in Q2/20 that was marked by early cash receipts and tax payment holidays, Fresenius Kabi saw the respective reversal in Q3/20. In Q1-3/20, operating cash flow increased by 13% to €836 million (Q1-3/19: €737 million) with a margin of 16.2% (Q1-3/19: 14.3%).
Fresenius Kabi confirms its outlook including estimated COVID-19 effects and projects organic sales3 growth of 2% to 5% and an EBIT4 development of -6% to -3% in constant currency.
1 Before special items
2 Net income attributable to shareholders of Fresenius SE & Co. KGaA
3 FY/19 base: €6,919 million
4 FY/19 base: €1,205 million, before special items, FY/20: before special items
For a detailed overview of special items please see the reconciliation tables on pages 17-19 in the PDF document.
Fresenius Helios
Fresenius Helios is Europe's leading private hospital operator. The company comprises Helios Germany and Helios Spain (Quirónsalud). Helios Germany operates 86 hospitals, ~125 outpatient centers and 6 prevention centers. Quirónsalud operates 46 hospitals, 70 outpatient centers and around 300 occupational risk prevention centers. In addition, the company is active in Latin America with 7 hospitals and as a provider of medical diagnostics.

- Recovery of elective procedures in Germany and Spain
- Helios Spain with significant growth based on catch-up effects; momentum accelerated by dynamic growth of outpatient treatments
- FY/20 guidance confirmed
Sales increased by 8% (8% in constant currency) to €2,400 million (Q3/19: €2,230 million). Organic growth was 6%. Acquisitions contributed 2% to sales growth. COVID-19 effects had an insignificant effect on organic sales growth. In Q1-3/20, Fresenius Helios increased sales by 4% (5% in constant currency) to €7,181 million (Q1-3/19: €6,890 million). Organic growth was 3%. Acquisitions contributed 2% to sales growth. COVID-19 effects had a moderate negative impact on organic sales growth in Q1-3/20. Fresenius sees a gradual recovery of elective procedures in Germany and Spain since May.
Sales of Helios Germany increased by 4% (organic growth: 4%) to €1,529 million (Q3/19: €1,474 million). In Q1-3/20, Sales of Helios Germany increased by 5% (organic growth: 5%) to €4,703 million (Q1-3/19: €4,465 million). Due to the law to ease the financial burden on hospitals, COVID-19 effects had only a slight negative impact on organic sales growth in both, Q3/20 and in Q1-3/20.
Sales of Helios Spain increased by 15% (17% in constant currency) to €870 million (Q3/19: €757 million). Organic growth of 10% was driven by a strong recovery of elective procedures and additionally fueled by increased outpatient treatments. Thus COVID-19 effects had a slight positive impact on organic sales growth. The hospital acquisitions in Colombia contributed 7% to sales growth. In Q1-3/20, sales of Helios Spain increased by 2% (3% in constant currency) to €2,476 million (Q1-3/19: €2,425 million). Organic growth was -2%. Acquisitions contributed 5% to sales growth. COVID-19 effects had a significant negative impact on organic sales growth in Q1-3/20.
EBIT of Fresenius Helios increased by 20% (20% in constant currency) to €225 million (Q3/19: €187 million) with an EBIT margin of 9.4% (Q3/19: 8.4%). COVID-19 effects had a significant positive effect on EBIT growth. In Q1-3/20, EBIT of Fresenius Helios decreased by 5% (-5% in constant currency) to €697 million (Q1-3/19: €731 million) with an EBIT margin of 9.7% (Q1-3/19: 10.6%). COVID-19 effects had a significant negative impact on EBIT growth in Q1-3/20.
EBIT of Helios Germany increased by 2% to €133 million (Q3/19: €131 million) with an EBIT margin of 8.7% (Q3/19: 8.9%). In Q1-3/20, EBIT of Helios Germany increased by 3% to €445 million (Q1-3/19: €434 million) with an EBIT margin of 9.5% (Q1-3/19: 9.7%). Due to the law to ease the financial burden on hospitals, COVID-19 effects had only a slight negative impact on EBIT growth in both Q3/20 and Q1-3/20.
EBIT of Helios Spain increased by 61% (63% in constant currency) to €95 million (Q3/19: €59 million) with an EBIT margin of 10.9% (Q3/19: 7.8%). The growth is driven by a recovery of elective procedures following the government-ordered postponement of planned surgical procedures in Q2, where medically justifiable. Thus, COVID-19 effects had a very significant positive effect on EBIT growth in Q3/20. In Q1-3/20, EBIT of Helios Spain decreased by 15% (-15% in constant currency) to €261 million (Q1-3/19: €307 million) with an EBIT margin of 10.5% (Q1-3/19: 12.7%). COVID-19 effects had a significant negative impact on EBIT growth in Q1-3/20 with missing or delayed elective procedures and higher expenses amidst the comprehensive efforts to combat the pandemic.
Net income1 increased by 27% to €142 million (Q3/19: €112 million). In Q1-3/20, net income1 decreased by 6% to €441 million (Q1-3/19: €467 million).
Operating cash flow increased to €275 million (Q3/19: €196 million) with a margin of 11.5% (Q3/19: 8.8%), driven by phasing of payments under the German law to ease the financial burden on hospitals. In Q1-3/20, operating cash flow increased to €715 million (Q1-3/19: €507 million) with a margin of 10.0% (Q1-3/19: 7.4%).
Fresenius Helios confirms its outlook including estimated COVID-19 effects and expects organic sales2 growth of 1% to 4% and EBIT3 broadly stable over FY/19 in constant currency.
1 Net income attributable to shareholders of Fresenius SE & Co. KGaA
2 FY/19 base: €9,234 million
3 FY/19 base: €1,025 million
Fresenius Vamed
Fresenius Vamed manages projects and provides services for hospitals and other health care facilities worldwide and is a leading post-acute care provider in Central Europe. The portfolio ranges along the entire value chain: from project development, planning, and turnkey construction, via maintenance and technical management to total operational management.

- Significant negative COVID-19 impact continued through Q3
- Projects and project order intake continued to be marked by delays, cancellations and global supply chain restraints due to COVID-19
- Lower capacities in the post-acute-care business due to health authority induced capacity restrictions and postponements of elective surgeries; less demand for rehabilitation treatments; high-end technical service remained robust
- FY/20 EBIT guidance revised
Sales of Fresenius Vamed decreased by 8% (-8% in constant currency) to €517 million (Q3/19: €562 million). Organic sales growth was -10%. Acquisitions contributed 2% to growth. Estimated COVID-19 effects had a significant negative impact on growth in Q3/20. In Q1-3/20, Fresenius Vamed increased sales by 1% (1% in constant currency) to €1,491 million (Q1-3/19: €1,469 million). Organic sales growth was -1%. Acquisitions contributed 2% to growth. Estimated COVID-19 effects had a significant negative impact on sales growth in Q1-3/20.
Sales in the service business increased by 8% to €377 million (Q3/19: €349 million).
Sales in the project business decreased by 34% to €140 million (Q3/19: €213 million), driven by postponements and cancellations of projects. In Q1-3/20, sales in the service business grew by 4% to €1,063 million (Q1-3/19: €1,025 million). Sales in the project business decreased by 4% to €428 million (Q1-3/19: €444 million).
EBIT decreased by 133% (-133% in constant currency) to -€11 million (Q3/19: €33 million) with an EBIT margin of -2.1% (Q3/19: 5.9%). Estimated COVID-19 effects had a very significant negative impact on EBIT. Capacities in the post-acute care clinics were left empty given a generally lower intake of elective surgery patients from acute-care hospitals as well as authority-instigated restrictions or even closures of individual facilities. In the project business, project delays triggered incremental expenses. In Q1-3/20, EBIT decreased by 115% (-115% in constant currency) to -€10 million (Q1-3/19: €67 million) with an EBIT margin of -0.7% (Q1-3/19: 4.6%). Estimated COVID-19 effects had a very significant negative impact on EBIT in Q1-3/20.
Net income1 decreased to -€15 million (Q3/19: €21 million). In Q1-3/20, net income1 decreased to -€23 million (Q1-3/19: €39 million).
Order intake was €188 million in Q3/20 (Q3/19: €240 million) and €362 million in Q1-3/20 (Q1-3/19: €738 million). As of September 30, 2020, order backlog was at €2,786 million (December 31, 2019: €2,865 million). Order intake and order backlog were marked by COVID-19 related cancellations and project delays.
Operating cash flow decreased to -€4 million (Q3/19: €33 million) with a margin of -0.8% (Q3/19: 5.9%), driven by delayed payments in the project business, partially offset by minor compensation payments from governmental authorities related to the post-acute care business. In Q1-3/20, operating cash flow increased to €4 million (Q1-3/19: -€17 million) with a margin of 0.3% (Q1-3/19: -1.2%).
Fresenius Vamed confirms its sales outlook for FY/20 and expects an organic sales2 decline of ~10%. Ongoing significant negative Covid-19 effects are expected to weigh on EBIT in Q4/20. While Fresenius Vamed continues to project a positive EBIT3 amount for FY/20, the constant currency decline versus FY/19 is now expected to exceed the former outlook of ~50%. Both sales and EBIT outlook include estimated COVID-19 effects.
1 Net income attributable to shareholders of VAMED AG
2 FY/19 base: €2,206 million
3 FY/19 base: €134 million
Conference Call
As part of the publication of the results for Q3/2020, a conference call will be held on October 29, 2020 at 1:30 p.m. CET (8:30 a.m. EDT). All investors are cordially invited to follow the conference call in a live broadcast over the Internet at www.fresenius.com/investors. Following the call, a replay will be available on our website.
For additional information on the performance indicators used please refer to our website www.fresenius.com/alternative-performance-measures.
This release contains forward-looking statements that are subject to various risks and uncertainties. Future results could differ materially from those described in these forward-looking statements due to certain factors, e.g. changes in business, economic and competitive conditions, regulatory reforms, results of clinical trials, foreign exchange rate fluctuations, uncertainties in litigation or investigative proceedings, and the availability of financing. Fresenius does not undertake any responsibility to update the forward-looking statements in this release.
- Fresenius Medical Care with very strong earnings growth and exceptional cash flow development in Q2
- Fresenius Kabi impacted by fewer elective procedures and easing extra demand for COVID 19 related products in Europe and the U.S.; only gradual recovery in China
- Fresenius Helios seeing gradual return of elective procedures; Helios Germany supported by law to ease financial burden on hospitals; COVID-19 related reimbursement at Helios Spain with remaining uncertainties
- Fresenius Vamed heavily impacted by COVID-19 related project delays and lack of post-acute care treatments
If no timeframe is specified, information refers to Q2/2020; 2020 and 2019 according to IFRS 16

1 Before special items
2 Net income attributable to shareholders of Fresenius SE & Co. KGaA
For a detailed overview of special items please see the reconciliation tables on pages 17-19 of the PDF document.
Stephan Sturm, CEO of Fresenius, said:”Particularly during the COVID-19 pandemic, Fresenius continues to make many important contributions to the provision of high-quality, affordable healthcare. In this way, we are standing with our patients around the world – and fulfilling our social responsibility. Despite the extra effort and restrictions – in particular in our hospital business – we achieved a very solid second quarter. Special credit for this should go to the tremendous dedication of our more than 300,000 employees. Fresenius stands on a broad, strong foundation, whose resilience is being proved more than ever right now. Even with all the current uncertainties, we expect increasingly dynamic earnings development in the coming quarters. I therefore remain confident that 2020 will be another successful year for Fresenius.”
New FY/20 Group guidance incorporating estimated COVID-19 impact
Fresenius’ business model has proven resilient amid the pandemic, although COVID-19 effects have impacted the Company’s operations and will continue to do so in H2/20.
Against this backdrop and based on the Group’s solid underlying business development in H1/20 and the Company’s expectation of improved profitability and hence accelerated earnings growth in H2, Fresenius now expects for FY/20, including estimated COVID-19 effects, constant currency sales growth1 of 3% to 6% and constant currency net income growth2,3 of - 4% to +1%. This replaces the original guidance, excluding COVID-19 effects, projecting constant currency sales growth1 of 4% to 7% and constant currency net income growth of 1% to 5%2,3.
The new guidance assumes only regional or local COVID-19 outbreaks rather than a widespread second COVID-19 wave triggering lock-downs in the Group’s relevant markets.
Fresenius now, including estimated COVID-19 effects, projects net debt/EBITDA4 to be around the top-end of the self-imposed target corridor of 3.0x to 3.5x by the end of FY/20.
Virtual Annual General Meeting
Fresenius has postponed its Annual General Meeting to August 28, 2020. The Group’s dividend proposal remains unchanged at €0.84 per share.
1 FY/19 base: €35,409 million
2 Net income attributable to shareholders of Fresenius SE & Co. KGaA
3 FY/19 base: €1,879 million; before special items (transaction-related expenses, revaluations of biosimilars contingent purchase price liabilities, gain related to divestitures of Care Coordination activities at FMC, expenses associated with the cost optimization program at FMC); FY/20: before special items
4 At LTM average exchange rates for both net debt and EBITDA; pro forma closed acquisitions/divestitures; excluding further potential acquisitions; before special items
For a detailed overview of special items please see the reconciliation tables on pages 17-19 of the PDF document.
2% sales growth in constant currency
Group sales increased by 2% (2% in constant currency) to €8,920 million in Q2/20 (Q2/19: €8,761 million). Organic sales growth was 2%. Acquisitions/divestitures contributed net 0% to growth. Currency translation had no significant effect. Excluding estimated COVID-19 effects1, Group sales growth would have been 6% to 7%. In H1/20, Group sales increased by 5% (5% in constant currency) to €18,055 million (H1/19: €17,256 million). Organic sales growth was 3%. Acquisitions/divestitures contributed net 2% to growth. Currency translation had no significant effect. Excluding estimated COVID-19 effects1, Group sales growth would have been 7% to 8% in H1/20.
13% net income2,3 decline in constant currency
Group EBITDA increased by 3% (3% in constant currency) to €1,762 million (Q2/192: €1,703 million). In H1/20, Group EBITDA increased by 3% (2% in constant currency) to €3,517 million (H1/192: €3,404 million).
Group EBIT remained on prior year’s level (0% in constant currency) at €1,123 million (Q2/192: €1,118 million). Missing sales, COVID-19 related expenses as well as negative operating leverage in Helios Spain and Fresenius Vamed facilities weighed on EBIT. The anticipated EBIT decreases at Helios Spain and Fresenius Kabi were partially compensated by Fresenius Medical Care’s strong EBIT growth. The EBIT margin was 12.6% (Q2/192: 12.8%).
In H1/20, EBIT remained on prior year’s level (-1% in constant currency) at €2,248 million (H1/192: €2,248 million). The EBIT margin was 12.5% (H1/192: 13.0%). Following higher levels of investments, Fresenius sees higher levels of depreciation and amortization in 2020.
Group net interest before special items improved to -€167 million (Q2/19: - €180 million) mainly due to successful refinancing activities as well as lower interest rates. Reported Group net interest improved to -€167 million (Q2/19: -€179 million). In H1/20, Group net interest before special items improved to -€341 million (H1/19: -€361 million) while reported Group net interest improved to -€349 million (H1/19: -€363 million).
The Group tax rate before special items was 23.5% (Q2/19: 22.8%) while the reported Group tax rate was 23.4% (Q2/19: 22.7%). In H1/20, the Group tax rate before special items was 23.1% (H1/19: 23.1%) while the reported Group tax rate was 23.0% (H1/19: 23.0%).
1 For estimated COVID-19 effects in Q2/20 and H1/20 please see table on page 15.
2 Before special items
3 Net income attributable to shareholders of Fresenius SE & Co. KGaA
For a detailed overview of special items please see the reconciliation tables on pages 17-19 of the PDF document.
Noncontrolling interests before special items were €321 million (Q2/19: €253 million), of which 97% was attributable to the noncontrolling interests in Fresenius Medical Care. Reported Group noncontrolling interests were €321 million (Q2/19: €255 million). In H1/20, noncontrolling interests before special items were €592 million (H1/19: €524 million). Reported Group noncontrolling interests were €592 million (H1/19: €516 million).
Group net income1 before special items decreased by 13% (-13% in constant currency) to €410 million (Q2/19: €471 million). Excluding estimated COVID-19 effects2, net income growth before special items would have been 0% to 4%. Reported Group net income1 was €411 million (Q2/19: €471 million). COVID-19 effects meaningfully increased from Q1 as the entire second quarter was affected in virtually all geographies. In H1/20, Group net income1 before special items decreased by 6% (-6% in constant currency) to €875 million (H1/19: €928 million). Excluding estimated COVID-19 effects2, net income growth before special items would have been 3% to 7%. Reported Group net income1 was €870 million (H1/19: €924 million).
Earnings per share1 before special items decreased by 13% (-14% in constant currency) to €0.74 (Q2/19: €0.85). Reported earnings per share1 were €0.74 (Q2/19: €0.85). In H1/20, earnings per share1 before special items decreased by 6% (-7% in constant currency) to €1.57 (H1/19: €1.67). Reported earnings per share1 were €1.56 (H1/19: €1.66).
Continued investment in growth
Spending on property, plant and equipment was €474 million corresponding to 5% of sales (Q2/19: €565 million; 6% of sales). The investments in Q2/20 served primarily for the modernization and expansion of dialysis clinics, production facilities as well as hospitals, and day clinics. Despite the COVID-19 pandemic, Fresenius has been largely able to continue its investment programs, although there remains some uncertainty on the timing of projects for the remainder of the year. In H1/20, spending on property, plant and equipment was €1,021 million corresponding to 6% of sales (H1/19: €1,006 million; 6% of sales).
Total acquisition spending was €97 million (Q2/19: €234 million). In H1/20, total acquisition spending was €509 million, mainly for the acquisition of two hospitals in Colombia by Fresenius Helios in Q1/20 (H1/19: €2,157 million, mainly for the acquisition of NxStage by Fresenius Medical Care).
1 Net income attributable to shareholders of Fresenius SE & Co. KGaA
2 For estimated COVID-19 effects in Q2/20 and H1/20 please see table on page 15.
For a detailed overview of special items please see the reconciliation tables on pages 17-19 of the PDF document.
Cash flow development
Group operating cash flow increased to an exceptional €3,082 million (Q2/19: €1,205 million) with a margin of 34.6% (Q2/19: 13.8%). The increase was largely driven by Fresenius Medical Care due to U.S. federal government advance payments under the Coronavirus Aid, Relief and Economic Security Act (CARES Act), as well as positive contributions from Fresenius Kabi and Helios Germany. Free cash flow before acquisitions and dividends was €2,606 million (Q2/19: €649 million). Free cash flow after acquisitions and dividends was €2,374 million (Q2/19: -€255 million).
In H1/20, Group operating cash flow increased to €3,960 million (H1/19: €1,494 million) with a margin of 21.9% (H1/19: 8.7%). Free cash flow before acquisitions and dividends was €2,911 million (H1/19: €481 million). Free cash flow after acquisitions and dividends was €2,334 million (H1/19: -€2,366 million, driven by the acquisition of NxStage by Fresenius Medical Care).
Solid balance sheet structure
Group total assets increased by 4% (4% in constant currency) to €69,554 million (Dec. 31, 2019: €67,006 million). Current assets increased by 12% (14% in constant currency) to €17,153 million (Dec. 31, 2019: €15,264 million), mainly driven by the increase of cash and cash equivalents. Non-current assets increased by 1% (2% in constant currency) to €52,401 million (Dec. 31, 2019: €51,742 million).
Total shareholders’ equity increased by 3% (4% in constant currency) to €27,252 million (Dec. 31, 2019: €26,580 million). The equity ratio was 39.2%.
Group debt increased by 1% (1% in constant currency) to €27,487 million (Dec. 31, 2019: € 27,258 million). Group net debt decreased by 5% (-5% in constant currency) to € 24,414 million (Dec. 31, 2019: € 25,604 million), mainly driven by the exceptional cash flow development.
As of June 30, 2020, the net debt/EBITDA ratio decreased to 3.39x1,2 (Dec. 31, 2019: 3.61x1,2) mainly due to the exceptional free cash flow development, despite COVID-19 effects weighing on EBITDA.
1 At LTM average exchange rates for both net debt and EBITDA; pro forma closed acquisitions/divestitures
2 Before special items
For a detailed overview of special items please see the reconciliation tables on pages 17-19 of the PDF document.
Business Segments
Fresenius Medical Care (Financial data according to Fresenius Medical Care press release)
Fresenius Medical Care is the world's largest provider of products and services for individuals with renal diseases. As of June 30, 2020, Fresenius Medical Care was treating 347,683 patients in 4,036 dialysis clinics. Along with its core business, the company provides related medical services in the field of Care Coordination.

- Solid sales growth continued and significant net income growth
- Exceptional cash flow development
- Guidance for FY/20 confirmed inclusive of anticipated COVID-19 effects
Fresenius Medical Care increased sales by 5% (5% in constant currency) to €4,557 million (Q2/19: €4,345 million). Organic sales growth was 4%. Acquisitions/divestitures contributed 1% in total. In H1/20, Fresenius Medical Care increased sales by 7% (6% in constant currency) to €9,045 million (H1/19: €8,478 million). Organic sales growth was 4%.
Reported EBIT increased by 26% (24% in constant currency) to €656 million (Q2/19: €521 million). The reported EBIT margin was 14.4% (Q2/19: 12.0%). Based on a strong, underlying business performance, the increase in margin was largely due to the recovery of COVID-19 related negative effects experienced in Q1 as well as ongoing cost saving measures. EBIT on an adjusted basis increased by 27% (increased by 25% in constant currency) to €656 million (Q2/19: €517 million). The EBIT margin on an adjusted basis was 14.4% (Q2/19: 11.9%).
1 Before special items
2 Net income attributable to shareholders of Fresenius Medical Care AG & Co. KGaA
For a detailed overview of special items please see the reconciliation tables on pages 17-19 of the PDF document.
In H1/20, Reported EBIT increased by 14% (12% in constant currency) to €1,211 million (H1/19: €1,058 million). The reported EBIT margin was 13.4% (H1/19: 12.5%). EBIT on an adjusted basis increased by 13% (increased by 11% in constant currency) to €1,211 million (H1/19: €1,074 million). The EBIT margin on an adjusted basis was 13.4% (H1/19: 12.7%).
Reported net income1 grew by 38% (36% in constant currency) to €351 million (Q2/19: 254 million) and increased on an adjusted basis by 40% (38% in constant currency) to €351 million (Q2/19: €250 million). In H1/20, reported net income1 grew by 21% (18% in constant currency) to €634 million (H1/19: 525 million) and increased on an adjusted basis by 18% (16% in constant currency) to €634 million (H1/19: €536 million).
Operating cash flow was €2,319 million (Q2/19: €852 million) with a margin of 50.9% (Q2/19: 19.6%). The increase was largely driven by the U.S. federal government advance payments under the Coronavirus Aid, Relief and Economic Security Act (CARES Act). In H1/20, operating cash flow was €2,903 million (H1/19: €928 million) with a margin of 32.1% (H1/19: 10.9%).
On the basis of the neutral net impact of COVID-19 in the first six months, Fresenius Medical Care continues to expect both revenue2 and net income1,3 to grow at a mid to high single digit rate in 2020. These targets are inclusive of anticipated COVID-19 effects, in constant currency, exclude special items4 and are based on the adjusted results 2019 including the effects of the operations of the NxStage acquisition and the IFRS 16 implementation.
For further information, please see Fresenius Medical Care’s press release at www.freseniusmedicalcare.com.
1 Net income attributable to shareholders of Fresenius Medical Care AG & Co. KGaA
2 FY/19 base: €17,477 million
3 FY/19 base: €1,236 million (FY/20: before special items)
4 Special items are effects that are unusual in nature and have not been foreseeable or not foreseeable in size or impact at the time of giving guidance.
For a detailed overview of special items please see the reconciliation tables on pages 17-19 of the PDF document.
Fresenius Kabi
Fresenius Kabi offers intravenously administered generic drugs, clinical nutrition and infusion therapies for seriously and chronically ill patients in the hospital and outpatient environments. The company is also a leading supplier of medical devices and transfusion technology products. In the biosimilars business, Fresenius Kabi develops products with a focus on oncology and autoimmune diseases.

- U.S. and European sales impacted by fewer elective procedures, only partially offset by extra demand for COVID-19 related products in April
- Only gradual recovery of elective procedures in China; solid organic growth in all other Emerging Markets
- EBIT decline despite positive COVID-19 effect given tough 2019 base
- Strong operating cash flow in Q2
- New FY/20 guidance incorporates estimated COVID-19 effects
Sales decreased by 1% (increased by 2% in constant currency) to €1,678 million (Q2/19: €1,691 million). Organic sales growth was 2%. Negative currency translation effects of 3% were mainly related to weakness of the Argentinian peso and the Brazilian real. Estimated COVID-19 effects had a moderate negative impact on sales growth. In H1/20, sales increased by 2% (4% in constant currency) to €3,467 million (H1/19: €3,392 million). Organic sales growth was 4%. Negative currency translation effects of 2% were mainly related to weakness of the Argentinian peso and the Brazilian real. Estimated COVID-19 effects had a slight negative impact on sales growth in H1/20.
Sales in North America increased by 5% (organic growth: 3%) to €600 million (Q2/19: €573 million). In H1/20, sales in North America increased by 6% (organic growth: 4%) to €1,269 million (H1/19: €1,196 million). Sales in Europe decreased by 1% (organic growth: 1%) to €566 million (Q2/19: €572 million). In H1/20, sales in Europe increased by 5% (organic growth: 5%) to €1,197 million (H1/19: €1,145 million). In both regions, extra demand for COVID-19 related drugs and devices eased in April already and hence could not fully offset the effect of fewer elective procedures throughout Q2.
Sales in Asia-Pacific decreased by 6% (organic growth: -5%) to €351 million (Q2/19: €374 million). China saw only a slow recovery of elective procedures while other Asian markets showed a stable development. In H1/20, sales in Asia-Pacific decreased by 6% (organic growth: -6%) to €670 million (H1/19: €715 million).
Sales in Latin America/Africa decreased by 6% (organic growth increased by 17%) to €161 million (Q2/19: €172 million). In H1/20, sales in Latin America/Africa decreased by 1% (organic growth: 17%) to €331 million (H1/19: €336 million).
EBIT before special items decreased by 6% (-5% in constant currency) to €292 million (Q2/191: €309 million) with an EBIT margin of 17.4% (Q2/191:18.3%). Given product mix and cost savings, estimated COVID-19 effects had a moderate positive impact on EBIT growth. The decline is driven by a positive one-time effect in Q2/19 as Idacio development expenses had to be revalued when that biosimilar was launched in Europe. In H1/20, EBIT before special items decreased by 5% (-5% in constant currency) to €581 million (H1/191: €613 million) with an EBIT margin of 16.8% (H1/191: 18.1%). Estimated COVID-19 effects had an insignificant impact on EBIT growth in H1/20.
Net income1,2 decreased by 6% (-5% in constant currency) to €196 million (Q2/19: €209 million). In H1/20, net income1,2 decreased by 4% (-4% in constant currency) to €393 million (H1/19: €411 million).
Operating cash flow increased to €437 million (Q2/19: €215 million) with a margin of 26.0% (Q2/19: 12.7%), mainly driven by strong cash inflows and temporarily delayed tax payments. In H1/20, operating cash flow was €611 million (H1/19: €360 million) with a margin of 17.6% (H1/19: 10.6%).
Now including estimated COVID-19 effects, Fresenius Kabi projects for FY/20 organic sales3 growth of 2% to 5% and an EBIT4 development of -6% to -3% in constant currency. This replaces the original 2020 outlook, excluding COVID-19 effects, projecting organic sales3 growth of 3% to 6% and an EBIT4 development of -4% to 0% in constant currency.
1 Before special items
2 Net income attributable to shareholders of Fresenius SE & Co. KGaA
3 FY/19 base: €6,919 million
4 FY/19 base: €1,205 million, before special items, FY/20: before special items
For a detailed overview of special items please see the reconciliation tables on pages 17-19 of the PDF document.
Fresenius Helios
Fresenius Helios is Europe's leading private hospital operator. The company comprises Helios Germany and Helios Spain (Quirónsalud). Helios Germany operates 86 hospitals, ~125 outpatient centers and 6 prevention centers. Quirónsalud operates 46 hospitals, 70 outpatient centers and around 300 occupational risk prevention centers. In addition, the company is active in Latin America with 6 hospitals and as a provider of medical diagnostics.

- Law to ease financial burden on hospitals continues to mitigate COVID-19 related sales losses and cost increases in Germany
- COVID-19 impact on Helios Spain significant, but less pronounced than feared; COVID-19 related reimbursement and compensation with remaining uncertainties
- Gradual recovery of elective procedures in Germany and Spain since May
- New FY/20 guidance incorporates COVID-19 effects
Sales decreased by 1% (-1% in constant currency) to €2,315 million (Q2/19: €2,349 million). Organic growth was -2%. In H1/20, Fresenius Helios increased sales by 3% (3% in constant currency) to €4,781 million (H1/19: €4,660 million). Organic growth was 1%. COVID-19 effects had a significant negative impact on organic sales growth in both, Q2/20 and H1/20. Fresenius sees a gradual recovery of elective procedures in Germany and Spain since May. All Helios hospitals established comprehensive hygiene and distance control concepts.
Sales of Helios Germany increased by 4% (organic growth: 4%) to €1,571 million (Q2/19: €1,506 million). In H1/20, Sales of Helios Germany increased by 6% (organic growth: 6%) to €3,174 million (H1/19: €2,991 million). Due to the law to ease the financial burden on hospitals, COVID-19 effects had a slight negative impact on organic sales growth in both, Q2/20 and H1/20.
Sales of Helios Spain decreased by 12% (-11% in constant currency) to €743 million (Q2/19: €842 million). Organic growth was -14%. In H1/20, sales of Helios Spain decreased by 4% (-3% in constant currency) to €1,606 million (H1/19: €1,668 million). Organic growth was -7%. COVID-19 effects had a significant negative impact on organic sales growth in both, Q2/20 and H1/20.
EBIT of Fresenius Helios decreased by 28% (-29% in constant currency) to €198 million (Q2/19: €276 million) with an EBIT margin of 8.6% (Q2/19: 11.7%). In H1/20, EBIT of Fresenius Helios decreased by 13% (-14% in constant currency) to €472 million (H1/19: €544 million) with an EBIT margin of 9.9% (H1/19: 11.7%). COVID-19 effects had a significant negative impact on EBIT growth in both, Q2/20 and H1/20.
EBIT of Helios Germany decreased by 5% to €147 million (Q2/19: €154 million) with an EBIT margin of 9.4% (Q2/19: 10.2%). The decline was mainly caused by higher costs to protect our patients and employees as well as missing sales not fully compensated under the law to ease the financial burden on hospitals. COVID-19 effects had a moderate negative impact on EBIT growth in Q2/20. In H1/20, EBIT of Helios Germany increased by 3% to €312 million (H1/19: €303 million) with an EBIT margin of 9.8% (H1/19: 10.1%). COVID-19 effects had a slight negative impact on EBIT growth in H1/20.
EBIT of Helios Spain decreased by 57% (-58% in constant currency) to €54 million (Q2/19: €127 million) with an EBIT margin of 7.3% (Q2/19: 15.1%). In H1/20, EBIT of Helios Spain decreased by 33% (-34% in constant currency) to €166 million (H1/19: €248 million) with an EBIT margin of 10.3% (H1/19: 14.9%). COVID-19 effects had a very significant negative impact on EBIT growth in both Q2/20 and H1/20 with uncompensated foregone elective procedures so far, and higher expenses amidst the comprehensive efforts to combat the pandemic. Despite remaining uncertainties with regard to COVID-19 related reimbursement and compensation, Q2/20 is likely to have marked the EBIT trough.
Net income1 decreased by 32% to €123 million (Q2/19: €181 million). In H1/20, net income decreased by 16% to €299 million (H1/19: €355 million).
Operating cash flow increased to €295 million (Q2/19: €208 million) with a margin of 12.7% (Q2/19: 8.9%), driven by phasing of payments under the German law to ease the financial burden on hospitals. In H1/20, operating cash flow increased to €440 million (H1/19: €311 million) with a margin of 9.2% (H1/19: 6.7%).
Now including COVID-19 effects, Fresenius Helios expects for FY/20 organic sales2 growth of 1% to 4% and EBIT3 broadly stable over FY/19 in constant currency. This replaces the original 2020 outlook, excluding COVID-19 effects, projecting organic sales2 growth of 3% to 6% and EBIT3 growth of 3% to 7% in constant currency.
1 Net income attributable to shareholders of Fresenius SE & Co. KGaA
2 FY/19 base: €9,234 million
3 FY/19 base: €1,025 million
Fresenius Vamed
Fresenius Vamed manages projects and provides services for hospitals and other health care facilities worldwide and is a leading post-acute care provider in Central Europe. The portfolio ranges along the entire value chain: from project development, planning, and turnkey construction, via maintenance and technical management to total operational management.

- Very significant negative COVID-19 impact in line with expectations
- COVID-19 related delays and cancellations of project orders and execution
- Lack of post-acute care patients given COVID-19 related postponements of elective procedures and health authority issued closures of rehabilitation clinics
- New FY/20 guidance incorporates estimated COVID-19 effects
Fresenius Vamed increased sales by 2% (1% in constant currency) to €475 million (Q2/19: €467 million). Organic sales growth was -1%. Acquisitions contributed 2% to growth. Estimated COVID-19 effects had a significant negative impact on organic growth in Q2/20. In H1/20, Fresenius Vamed increased sales by 7% (7% in constant currency) to €974 million (H1/19: €907 million). Organic sales growth was 5%. Acquisitions contributed 2% to growth. Estimated COVID-19 effects had a moderate negative impact on organic sales growth in H1/20.
Sales in the service business decreased by 4% to €329 million (Q2/19: €344 million).
Sales in the project business increased by 19% to €146 million (Q2/19: €123 million), mainly driven by revenue recognition from existing projects, primarily in Germany and Austria, and intercompany projects with Fresenius Helios. In H1/20, sales in the service business grew by 1% to €686 million (H1/19: €676 million). Sales in the project business increased by 25% to €288 million (H1/19: €231 million).
EBIT decreased to -€13 million (Q2/19: €22 million) with an EBIT margin of -2.7% (Q2/19: 4.7%). Estimated COVID-19 effects had a very significant negative impact on EBIT. Capacities in the post-acute care clinics were left empty given a generally lower intake of elective surgery patients from acute-care hospitals as well as authority-instigated restrictions or even closures of individual facilities. In H1/20, EBIT decreased by 97% (-97% in constant currency) to €1 million (H1/19: €34 million) with an EBIT margin of 0.1% (H1/19: 3.7%). Estimated COVID-19 effects had a very significant negative impact on EBIT in H1/20.
Net income1 decreased to -€15 million (Q2/19: €12 million). In H1/20, net income1 decreased to -€8 million (H1/19: €18 million).
Order intake was €50 million in Q2/20 (Q2/19: €115 million) and €174 million in H1/20 (H1/19: €498 million). As of June 30, 2020, order backlog was at €2,745 million (December 31, 2019: €2,865 million). Order intake and order backlog were marked by COVID-19 related cancellations and project delays.
Operating cash flow increased to €28 million (Q2/19: -€35 million) with a margin of 5.9% (Q2/19: -7.5%), driven by timing of payments in the project business as well as some compensations payments from governmental authorities in the post-acute care business. In H1/20, operating cash flow increased to €8 million (H1/19: -€50 million) with a margin of 0.8% (H1/19: -5.5%).
Now including estimated COVID-19 effects, Fresenius Vamed expects for FY/20 an organic sales2 decline of ~10% and an EBIT3 decline of ~50% in constant currency. This replaces the original 2020 outlook, excluding COVID-19 effects, projecting organic sales2 growth of 4% to 7% and EBIT3 growth of 5% to 9% in constant currency.
1 Net income attributable to shareholders of VAMED AG
2 FY/19 base: €2,206 million
3 FY/19 base: €134 million
Conference Call
As part of the publication of the results for Q2/2020, a conference call will be held on July 30, 2020 at 1:30 p.m. CEDT (7:30 a.m. EDT). All investors are cordially invited to follow the conference call in a live broadcast over the Internet at www.fresenius.com/investors. Following the call, a replay will be available on our website.
For additional information on the performance indicators used please refer to our website www.fresenius.com/alternative-performance-measures.
This release contains forward-looking statements that are subject to various risks and uncertainties. Future results could differ materially from those described in these forward-looking statements due to certain factors, e.g. changes in business, economic and competitive conditions, regulatory reforms, results of clinical trials, foreign exchange rate fluctuations, uncertainties in litigation or investigative proceedings, and the availability of financing. Fresenius does not undertake any responsibility to update the forward-looking statements in this release.
- Fresenius Medical Care with strong sales growth in Q1
- Fresenius Kabi with expected dip in China partially offset by spike in demand for drugs and devices for COVID-19 patients in Europe and the US
- Helios Germany supported by law to ease financial burden on hospitals
- Helios Spain’s significant contribution to combat COVID-19 faces reimbursement uncertainties
- Fresenius Vamed with solid Q1, however already marked by COVID-19 related post-acute patient losses and project delays
- Original guidance for 2020 excluding any effects of the COVID-19 pandemic maintained; Guidance update to include COVID-19 effects expected with Q2/20 financial results
- Group financial position remains strong
If no timeframe is specified, information refers to Q1/2020
2020 and 2019 according to IFRS 16
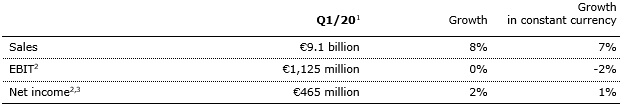
1 Not comparable to FY/20 guidance as inclusive of COVID-19 effects
2 Before special items
3 Net income attributable to shareholders of Fresenius SE & Co. KGaA
For a detailed overview of special items please see the reconciliation tables on pages 17-18 of the PDF document.
Stephan Sturm, CEO of Fresenius, said: “The COVID-19 pandemic has created unprecedented challenges for Fresenius. We are doing everything we can to continue providing the best possible care for our patients around the world. The last few weeks have shown that we have a crucial role to play in the health care systems around the world, and never more so than at a time of crisis. Our success to date is due, above all, to the tremendous dedication and commitment of our employees. Our solid first-quarter business results demonstrate the resilience of our operations and business models. It is, however, too early to say with any certainty what impact COVID-19 will have on the company’s full business year. What can be said with certainty is that we will keep working hard for our patients, and will continue to make an important contribution to overcoming this pandemic.”
Group guidance for FY/20 – Impact of COVID-19 on outlook cannot be reliably assessed at this time
Fresenius’ FY guidance published on February 20, 2020 did not take into account effects of the COVID-19 pandemic. It projected sales growth1 of 4% to 7% in constant currency and net income growth2,3 of 1% to 5% in constant currency. Fresenius anticipates that, following the solid start to the year, COVID-19 will continue to impact its business; at this time, however, a reliable assessment and quantification of the positive and negative effects is not possible. The Group hence maintains its original guidance, excluding any COVID-19 effects. Fresenius will revisit this guidance when communicating its Q2/20 results with the aim to incorporate a reliable assessment of COVID-19 effects.
This approach also applies for the Group’s net debt/EBITDA target. The original guidance, excluding effects of the COVID-19 pandemic, projects net debt/EBITDA4 to be towards the top-end of the self-imposed target corridor of 3.0x to 3.5x at the end of 2020.
Fresenius expects to see a more pronounced negative COVID-19 effect on its financial results in the second quarter than in the first quarter of 2020.
7% sales growth in constant currency
Group sales increased by 8% (7% in constant currency) to €9,135 million in Q1/20 (Q1/19: €8,495 million) driven by all business segments. COVID-19 had only a slight negative effect on sales growth. Organic sales growth was 5%. Acquisitions/divestitures contributed net 2% to growth. Positive currency translation effects of 1% were mainly driven by the U.S. dollar strengthening against the euro.
1 FY/19 base: €35,409 million
2 Net income attributable to shareholders of Fresenius SE & Co. KGaA
3 FY/19 base: €1,879 million; before special items (transaction-related expenses, revaluations of biosimilars contingent purchase price liabilities, gain related to divestitures of Care Coordination activities at FMC, expenses associated with the cost optimization program at FMC); FY/20: before special items
4 Both net debt and EBITDA calculated at expected annual average exchange rates; excluding further potential acquisitions
For a detailed overview of special items please see the reconciliation tables on pages 17-18 of the PDF document.
1% net income1,2 growth in constant currency
Group EBITDA increased by 3% (2% in constant currency) to €1,755 million (Q1/191: €1,701 million).
Group EBIT remained on prior year’s level (-2% in constant currency) at €1,125 million (Q1/191: €1,130 million), impacted by negative COVID-19 effects. At Fresenius Kabi additional demand for drugs and devices to treat COVID-19 patients late in the quarter only partially offset the anticipated headwinds in China during most of the quarter. Helios Spain also faced very significant negative COVID-19 effects in March, mainly at its private hospital and ORP businesses. The EBIT margin was 12.3% (Q1/191: 13.3%).
Group net interest before special items improved to -€174 million in Q1/20 (Q1/19: -€181 million) mainly due to successful refinancing activities. Reported Group net interest improved to -€182 million (Q1/19: -€184 million).
The Group tax rate before special items was 22.6% (Q1/19: 23.3%). The reported Group tax rate was 22.6% (Q1/19: 23.3%).
Noncontrolling interest before special items was -€271 million (Q1/19: -€271 million), of which 96% was attributable to the noncontrolling interest in Fresenius Medical Care. Reported Group noncontrolling interest was -€271 million (Q1/19: -€261 million).
1 Before special items
2 Net income attributable to shareholders of Fresenius SE & Co. KGaA
For a detailed overview of special items please see the reconciliation tables on pages 17-18 of the PDF document.
Group net income1 before special items increased by 2% (1% in constant currency) to €465 million (Q1/19: €457 million). Reported Group net income1 was €459 million (Q1/19: €453 million). COVID-19 had a significant negative effect on net income growth.
Earnings per share1 before special items increased by 1% (1% in constant currency) to €0.83 (Q1/19: €0.82). Reported earnings per share1 were €0.82 (Q1/19: €0.81).
Continued investment in growth
Spending on property, plant and equipment was €547 million corresponding to 6% of sales (Q1/19: €441 million; 5% of sales). The investments in Q1/20 served primarily for the modernization and expansion of dialysis clinics, production facilities as well as hospitals, and day clinics. Subject to duration and magnitude of the COVID-19 pandemic, Fresenius may face delays of investment projects planned for 2020.
Total acquisition spending was €412 million (Q1/19: €1,923 million), mainly for the acquisition of two hospitals in Colombia by Fresenius Helios.
Cash flow development
Group operating cash flow increased to €878 million (Q1/19: €289 million) with a margin of 9.6% (Q1/19: 3.4%). Growth was driven by a favorable working capital development at both Fresenius Medical Care and Fresenius Kabi. Free cash flow before acquisitions and dividends was €305 million (Q1/19: -€168 million). Free cash flow after acquisitions and dividends was -€40 million (Q1/19: -€2,111 million, driven by the acquisition of NxStage by Fresenius Medical Care).
1 Net income attributable to shareholders of Fresenius SE & Co. KGaA
For a detailed overview of special items please see the reconciliation tables on pages 17-18 of the PDF document.
Solid balance sheet structure
Group total assets increased by 3% (3% in constant currency) to €68,972 million (Dec. 31, 2019: €67,006 million). Current assets increased by 7% (8% in constant currency) to €16,341 million (Dec. 31, 2019: €15,264 million). Non-current assets increased by 2% (1% in constant currency) to €52,631 million (Dec. 31, 2019: €51,742 million).
Total shareholders’ equity increased by 1% (1% in constant currency) to €26,956 million (Dec. 31, 2019: €26,580 million). The equity ratio was 39.1%.
Group debt increased by 5% (4% in constant currency) to €28,557 million (Dec. 31, 2019: € 27,258 million). Group net debt increased by 4% (3% in constant currency) to € 26,529 million (Dec. 31, 2019: € 25,604 million) driven by the closing of two hospital acquisitions in Colombia by Fresenius Helios and execution of the share buy-back program at Fresenius Medical Care as well as currency translation effects.
As of March 31, 2020, the net debt/EBITDA ratio increased to 3.68x1,2 (Dec. 31, 2019: 3.61x1,2) mainly due to the acquisitions made by Fresenius Helios, the share-buy back program at Fresenius Medical Care and negative COVID-19 effects on EBITDA.
1 At LTM average exchange rates for both net debt and EBITDA; pro forma closed acquisitions/divestitures
2 Before special items
For a detailed overview of special items please see the reconciliation tables on pages 17-18 of the PDF document.
Business Segments
Fresenius Medical Care (Financial data according to Fresenius Medical Care press release)
Fresenius Medical Care is the world's largest provider of products and services for individuals with renal diseases. As of March 31, 2020, Fresenius Medical Care was treating 348,703 patients in 4,002 dialysis clinics. Along with its core business, the company provides related medical services in the field of Care Coordination.
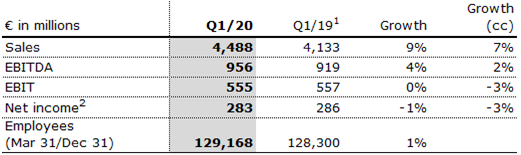
- 9% revenue increase supported by growth in all regions
- Solid cash-flow development
- Financial targets confirmed
Fresenius Medical Care increased sales by 9% (7% in constant currency) to €4,488 million (Q1/19: €4,133 million). Organic sales growth was 4%. Positive currency translation effects of 2% were mainly related to the U.S. dollar strengthening against the euro.
Reported EBIT increased by 3% (1% in constant currency) to €555 million (Q1/19: €537 million) mainly driven by a favorable impact from higher treatment volume and lower costs for pharmaceuticals. The reported EBIT margin was 12.4% (Q1/19: 13.0%). The decrease in margin was largely due to the unfavorable COVID-19 pandemic effect and the prior year reduction of a contingent consideration liability related to Xenios. EBIT on an adjusted basis was flat (decreased by 3% in constant currency) at €555 million (Q1/19: €557 million). The EBIT margin on an adjusted basis was 12.4% (Q1/19: 13.5%).
Reported net income2 grew by 4% (2% in constant currency) to €283 million (Q1/19: 271 million) and decreased on an adjusted basis by 1% (-3% in constant currency) to €283 million (Q1/19: €286 million).
Operating cash flow was €584 million (Q1/19: €76 million) with a margin of 13.0% (Q1/19: 1.8%). The increase was largely driven by working capital improvement, including a positive effect from cash collections, timing of payments and change in year over year inventory levels.
Fresenius Medical Care’s FY guidance published on February 20, 2020 did not take into account COVID-19 effects. Since it is too early to reliably assess and quantify the positive and negative effects of the COVID-19 pandemic, the Company confirms its 2020 outlook of expected sales3 and net income2,4 growth both within a mid to high single digit percentage range in constant currency. These targets are based on the adjusted results 2019 including the effects of the operations of the NxStage acquisition and the IFRS 16 implementation.
For further information, please see Fresenius Medical Care’s press release at www.freseniusmedicalcare.com.
1 Q1/19 before special
2 Net income attributable to shareholders of Fresenius Medical Care AG & Co. KGaA
3 FY/19 base: €17,477 million
4 FY/19 base: €1,236 million (FY/20: before special items)
For a detailed overview of special items please see the reconciliation tables on pages 17-18 of the PDF document.
Fresenius Kabi
Fresenius Kabi offers intravenously administered generic drugs, clinical nutrition and infusion therapies for seriously and chronically ill patients in the hospital and outpatient environments. The company is also a leading supplier of medical devices and transfusion technology products. In the biosimilars business, Fresenius Kabi develops products with a focus on oncology and autoimmune diseases.
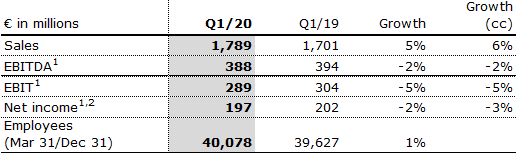
- Insignificant COVID-19 effect on sales growth, moderate negative effect on EBIT growth
- Anticipated softer demand in China during most of Q1/20 due to fewer elective surgeries followed by gradual resumption towards normal operations late in the quarter
- Increased demand for essential drugs and devices for the treatment of COVID-19 patients in North America and Europe late in Q1/20
- No major interruption at any production site
Fresenius Kabi increased sales by 5% (6% in constant currency) to €1,789 million (Q1/19: €1,701 million). Organic sales growth was 6%. Negative currency translation effects of 1% were mainly related to weakness of the Argentinian peso and the Brazilian real.
Sales in North America increased by 7% (organic growth: 5%) to €669 million (Q1/19: €623 million). Sales in Europe grew by 10% (organic growth: 10%) to €631 million (Q1/19: €573 million). In both regions, sales were driven by a spike of demand for sedation drugs, pain killers and infusion pumps starting late in Q1/20.
Sales in Asia-Pacific decreased by 6% (organic growth: -6%) to €319 million (Q1/19: €341 million). As anticipated, softer demand for clinical nutrition products and IV drugs in China was driven by the COVID-19 related postponement of elective treatments.
Sales in Latin America/Africa increased by 4% (organic growth: 16%) to €170 million (Q1/19: €164 million).
EBIT before special items decreased by 5% (-5% in constant currency) to €289 million (Q1/191: €304 million) with an EBIT margin of 16.2% (Q1/191: 17.9%). The COVID-19 pandemic had a moderate net negative effect on EBIT.
Net income1,2 decreased by 2% (-3% in constant currency) to €197 million (Q1/19: €202 million).
Operating cash flow was €174 million (Q1/19: €145 million) with a margin of 9.7% (Q1/19: 8.5%), driven by an improved working capital position.
Since it is too early to reliably assess and quantify the positive and negative effects of the COVID-19 pandemic, Fresenius Kabi maintains its 2020 outlook of expected organic sales3 growth of 3% to 6% and an EBIT4 development of -4% to 0% in constant currency, excluding any effects from COVID-19.
1 Before special items
2 Net income attributable to shareholders of Fresenius SE & Co. KGaA
3 FY/19 base: €6,919 million
4 FY/19 base: €1,205 million, before special items, FY/20: before special items
For a detailed overview of special items please see the reconciliation tables on pages 17-18 of the PDF document.
Fresenius Helios
Fresenius Helios is Europe's leading private hospital operator. The company comprises Helios Germany and Helios Spain (Quirónsalud). Helios Germany operates 86 hospitals, ~125 outpatient centers and 7 prevention centers. Quirónsalud operates 46 hospitals, 72 outpatient centers and around 300 occupational risk prevention centers. In addition, the company is active in Latin America with 6 hospitals and as a provider of medical diagnostics.
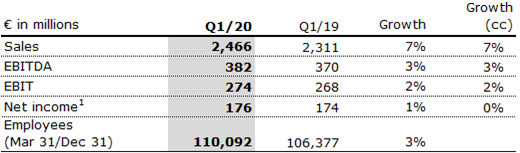
- Strong business development in January and February; from March, postponement and cancellation of elective treatments
- Excluding slight negative COVID-19 effect, Q1/20 sales growth moderately above outlook range; significant negative COVID-19 effect on EBIT
- Law to ease financial burden on hospitals to offset large part of COVID-19 related sales losses and cost increases in Germany
- Some remaining uncertainties regarding the compensation of Spanish hospitals for their efforts to combat the COVID-19 pandemic
Fresenius Helios increased sales by 7% (organic growth: 5%) to €2,466 million (Q1/19: €2,311 million).
Sales of Helios Germany increased by 8% (organic growth: 8%) to €1,603 million (Q1/19: €1,485 million). Organic sales growth was positively influenced by pricing effects and admissions growth in January and February. From March, COVID-19 had an insignificant net effect as foregone sales from elective admissions were largely offset by the law to ease the financial burden on hospitals.
Sales of Helios Spain increased by 4% (organic growth: 1%) to €863 million (Q1/19: €826 million) driven by the recent hospital acquisitions in Colombia. COVID-19 related foregone elective surgeries significantly weighed on organic sales growth from March.
EBIT of Fresenius Helios increased by 2% to €274 million (Q1/19: €268 million) with an EBIT margin of 11.1% (Q1/19: 11.6%).
EBIT of Helios Germany increased by 11% to €165 million (Q1/19: €149 million) with an EBIT margin of 10.3% (Q1/19: 10.0%). EBIT was positively influenced by pricing effects and admissions growth in January and February. From March, COVID-19 had an insignificant net effect as foregone EBIT from elective admissions was largely offset by the law to ease the financial burden on hospitals.
EBIT of Helios Spain decreased by 7% to €112 million (Q1/19: €121 million) with an EBIT margin of 13.0% (Q1/19: 14.6%). January and February showed positive admission growth. From March, COVID-19 had a very significant negative effect on EBIT as foregone elective treatments met higher costs amidst the comprehensive efforts to combat the pandemic.
Net income1 increased by 1% to €176 million (Q1/19: €174 million).
Operating cash flow increased to €145 million (Q1/19: €103 million) with a margin of 5.9% (Q1/19: 4.5%), driven by a good operating performance in both regions.
Since it is too early to reliably assess and quantify the positive and negative effects of the COVID-19 pandemic, Fresenius Helios maintains its 2020 outlook of expected organic sales2 growth of 3% to 6% and EBIT3 growth of 3% to 7% in constant currency, excluding any effects from COVID-19.
1 Net income attributable to shareholders of Fresenius SE & Co. KGaA
2 FY/19 base: €9,234 million
3 FY/19 base: €1,025 million
Fresenius Vamed
Fresenius Vamed manages projects and provides services for hospitals and other health care facilities worldwide and is a leading post-acute care provider in Central Europe. The portfolio ranges along the entire value chain: from project development, planning, and turnkey construction, via maintenance and technical management to total operational management.
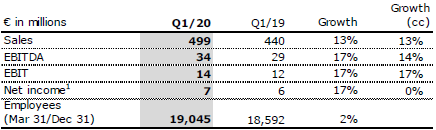
- Both project and service business contributing to organic sales growth of 10%
- Slight negative COVID-19 effect on sales, very significant negative effect on EBIT growth
- Post-acute care services impacted by COVID-19 related postponements of elective surgeries and health authority enforced closures of rehabilitation clinics; technical services insignificantly impacted by COVID-19
- Further COVID-19 related delays of project business orders and execution expected throughout 2020
Fresenius Vamed increased sales by 13% to €499 million (Q1/19: €440 million). Organic sales growth was 10%. Acquisitions contributed 3% to growth. Both service and project business showed strong growth momentum. COVID-19 had only a slight negative effect on sales.
Sales in the service business grew by 8% to €357 million (Q1/19: €332 million). Sales of the project business increased by 31% to €142 million (Q1/19: €108 million).
EBIT increased by 17% to €14 million (Q1/19: €12 million) with an EBIT margin of 2.8% (Q1/19: 2.7%). COVID-19 had a very significant negative effect on EBIT growth. Capacities in the post-acute care clinics were left idle given a generally lower intake of elective surgery patients from acute-care hospitals as well as authority-instigated restrictions or even closures of individual facilities.
Net income1 increased by 17% to €7 million (Q1/19: €6 million).
Order intake was €124 million (Q1/19: €383 million). Order intake in the prior year was exceptionally strong. As of March 31, 2020, order backlog was at €2,846 million (December 31, 2019: €2,865 million) and already marked by COVID-19 related project delays.
Operating cash flow decreased to -€20 million (Q1/19: -€15 million) with a margin of
-4.0% (Q1/19: -3.4%), given continuing phasing effects, some delays in the international project business as well as working capital build-ups.
Since it is too early to reliably assess and quantify the positive and negative effects of the COVID-19 pandemic, Fresenius Vamed maintains its 2020 outlook of expected organic sales2 growth of 4% to 7% and EBIT3 growth of 5% to 9% in constant currency, excluding any effects from COVID-19.
1 Net income attributable to shareholders of VAMED AG
2 FY/19 base: €2,206 million
3 FY/19 base: €134 million
Conference Call
As part of the publication of the results for Q1 2020, a conference call will be held on May 6, 2020 at 1:30 p.m. CEDT (7:30 a.m. EDT). All investors are cordially invited to follow the conference call in a live broadcast over the Internet at www.fresenius.com/investors. Following the call, a replay will be available on our website.
For additional information on the performance indicators used please refer to our website https://www.fresenius.com/alternative-performance-measures.
This release contains forward-looking statements that are subject to various risks and uncertainties. Future results could differ materially from those described in these forward-looking statements due to certain factors, e.g. changes in business, economic and competitive conditions, regulatory reforms, results of clinical trials, foreign exchange rate fluctuations, uncertainties in litigation or investigative proceedings, and the availability of financing. Fresenius does not undertake any responsibility to update the forward-looking statements in this release.
Our Annual Report 2019 is now available as a full-content PDF download and as an online short-version with the highlights. Annual Report (PDF) Online short-version
• Good organic sales growth across all business segments
• Fresenius Kabi’s excellent Emerging Markets growth partially offsets softer development in North America
• Fresenius Helios shows continued stabilization in Germany and strong growth in Spain
• Fresenius Medical Care expects to show strong growth in 2020
• 27th consecutive dividend increase proposed
If no timeframe is specified, information refers to Q4/2019

1 Adjusted for IFRS 16
2 Q4/18 and FY/18 before special items and adjusted for divestitures of Care Coordination activities at Fresenius Medical Care (FMC)
3 Net income attributable to shareholders of Fresenius SE & Co. KGaA
For a detailed overview of special items and adjustments please see the reconciliation tables on pages 20-28 of the PDF document.
Group guidance for FY/20
For FY/20, Fresenius projects sales growth1 of 4% to 7% in constant currency. Net income2,3 growth is expected to be in a 1% to 5% range in constant currency. Contributions from signed, but not yet closed acquisitions are included in this guidance.
The FY/20 guidance does not include any effects from the coronavirus (Covid-19) outbreak, since it is too early to quantify those. From the current perspective Fresenius does not expect a significant negative financial impact4.
Fresenius expects net debt/EBITDA5 to be towards the top-end of the self-imposed target corridor of 3.0x to 3.5x at the end of 2020.
Growth targets for 2020 – 2023 confirmed
Fresenius continues to expect Group sales to grow organically with a compounded annual growth rate (CAGR) of 4% to 7% during 2020 to 2023. Group net income2 is projected to increase organically with a CAGR of 5% to 9% during 2020 to 2023. Fresenius expects its sales growth and efficiency improvement initiatives as well as Fresenius Kabi’s biosimilars business to drive an acceleration of Group earnings growth over that period. Small and medium-sized acquisitions are expected to contribute an incremental CAGR of approx. 1%-point to both sales and net income growth.
27th consecutive dividend increase proposed
The Management Board of Fresenius will propose to the Supervisory Board a dividend increase of 5% to €0.84 per share for FY/19 (FY/18: €0.80). The proposed total dividend payout to Fresenius SE & Co. KGaA shareholders amounts to €468 million (FY/18: €445 million).
1 FY/19 base: €35,409 million, including IFRS 16 effect
2 Net income attributable to shareholders of Fresenius SE & Co. KGaA
3 FY/19 base: €1,879 million, including IFRS 16 effect; FY/19 before special items (transaction-related expenses, revaluations of biosimilars contingent purchase price liabilities, gain related to divestitures of Care Coordination activities at FMC, expenses associated with the cost optimization program at FMC); FY/20: before special items
4 Taking into account minority interest structures across the Group
5 Both net debt and EBITDA including IFRS 16 effect and calculated at expected annual average exchange rates; excluding further potential acquisitions
For a detailed overview of special items and adjustments please see the reconciliation tables on pages 20-28 of the PDF document.
5% sales growth1 in constant currency
In Q4/19, Group sales were €9,311 million including an IFRS 16 effect of -€40 million. Group sales1 on a comparable basis increased by 6% (5% in constant currency) to €9,351 million in Q4/19 (Q4/18: €8,830 million). Organic sales growth was 4%. Acquisitions/divestitures contributed net 1% to growth. In FY/19, Group sales were €35,409 million including an IFRS 16 effect of -€115 million. On a comparable basis, Group sales1 increased by 8% (6% in constant currency) to €35,524 million (FY/18: €33,009 million). Organic sales growth was 5%. Acquisitions/divestitures contributed net 1% to growth. Positive currency translation effects of 2% were mainly driven by the U.S. dollar strengthening against the euro.
2% net income2,3 growth in constant currency
In Q4/19, Group EBITDA before special items was €1,937 million including an IFRS 16 effect of €235 million. On a comparable basis, Group EBITDA2 increased by 1% (0% in constant currency) to €1,702 million (Q4/18: €1,680 million). Reported Group EBITDA4 was €1,937 million. In FY/19, Group EBITDA before special items was €7,104 million including an IFRS 16 effect of €934 million. On a comparable basis, Group EBITDA2 increased by 2% (0% in constant currency) to €6,170 million (FY/18: €6,032 million). Reported Group EBITDA4 was €7,083 million.
In Q4/19, Group EBIT before special items was €1,287 million including an IFRS 16 effect of €10 million. On a comparable basis, Group EBIT2 increased by 2% (0% in constant currency) to €1,277 million (Q4/18: €1,250 million). The EBIT margin2 on a comparable basis was 13.7% (Q4/18: 14.2%). Reported Group EBIT4 was €1,269 million.
In FY/19, Group EBIT before special items was €4,688 million including an IFRS 16 effect of €89 million. On a comparable basis, Group EBIT2 increased by 1% (-2% in constant currency) to €4,599 million (FY/18: €4,547 million). The EBIT margin2 on a comparable basis was 12.9% (FY/18: 13.8%). Reported Group EBIT4 was €4,631 million. Adjustments on accounts receivable in legal dispute paired with reduced patient attribution and a decreasing savings rate for ESCOs at Fresenius Medical Care weighed on earnings. In addition, the missing tailwinds from drug shortages in North America triggered a softer development at Fresenius Kabi. Moreover, investments to counter the regulatory headwinds at Helios Germany continued to weigh on Group EBIT. These effects were partially offset by the remeasurement effect of the fair value of Fresenius Medical Care’s investment on Humacyte, Inc.
1 On a comparable basis: Q4/18 and FY/18 adjusted for divestitures of Care Coordination activities at FMC; Q4/19 and FY/19 adjusted for IFRS 16 effect
2 On a comparable basis: Q4/19 and FY/19 before special items and adjusted for IFRS 16 effect; Q4/18 and FY/18 before special items and adjusted for divestitures of Care Coordination activities at FMC
3 Net income attributable to shareholders of Fresenius SE & Co. KGaA
4 After special items and including IFRS 16 effect
For a detailed overview of special items and adjustments please see the reconciliation tables on pages 20-28 of the PDF document.
In Q4/19, Group net interest before special items was -€182 million including an IFRS 16 effect of -€51 million. On a comparable basis, net interest1 increased to -€131 million in Q4/19 (Q4/18: -€129 million). Reported Group net interest2 was -€184 million. In FY/19, Group net interest before special items was -€714 million including an IFRS 16 effect of -€204 million. On a comparable basis, net interest1 improved to -€510 million (FY/18: -€549 million) mainly due to successful refinancing activities and lower interest rates. Reported Group net interest2 was -€719 million.
In Q4/19, the Group tax rate before special items and adopting IFRS 16 was 23.8%, in FY/19 it was 23.3%. On a comparable basis, the Group tax rate1 was 24.0% in Q4/19 and 23.4% in FY/19 (Q4/18: 22.7%; FY/18: 22.1%). The YoY increase was driven by positive one-time effects in the prior-year relating to the US tax reform.
In Q4/19, Noncontrolling interest before special items was -€336 million including an IFRS 16 effect of €18 million. On a comparable basis, noncontrolling interest1 was -€354 million (Q4/18: -€363 million). In FY/19, noncontrolling interest before special items was -€1,170 million including an IFRS 16 effect of €49 million. On a comparable basis, noncontrolling interest1 was -€1,219 million (FY/18: -€1,243 million), of which 96% was attributable to the noncontrolling interest in Fresenius Medical Care.
In Q4/19, Group net income3 before special items was €506 million including an IFRS 16 effect of -€11 million. On a comparable basis, Group net income1,3 increased by 3% (2% in constant currency) to €517 million (Q4/18: €504 million). Reported Group net income2,3 was €515 million.
In FY/19, Group net income3 before special items was €1,879 million including an IFRS 16 effect of -€36 million. On a comparable basis, Group net income1,3 increased by 2% (0% in constant currency) to €1,915 million (FY/18: €1,872 million). Reported Group net income2,3 was €1,883 million.
1 On a comparable basis: Q4/19 and FY/19 before special items and adjusted for IFRS 16 effect; Q4/18 and FY/18 before special items and adjusted for divestitures of Care Coordination activities at FMC
2 After special items and including IFRS 16 effect
3 Net income attributable to shareholders of Fresenius SE & Co. KGaA
For a detailed overview of special items and adjustments please see the reconciliation tables on pages 20-28 of the PDF document.
In Q4/19, Earnings per share1 before special items were €0.90 including an IFRS 16 effect of -€0.03. On a comparable basis, Earnings per share1,2 increased by 2% (1% in constant currency) to €0.93 (Q4/18: €0.91). Reported Earnings per share1,3 were €0.92. In FY/19, Earnings per share1 before special items were €3.37 including an IFRS 16 effect of -€0.07. On a comparable basis, earnings per share1,2 increased by 2% (0% in constant currency) to €3.44 (FY/18: €3.37). Reported Earnings per share1,3 were €3.38.
Continued investment in growth
2019 was an investment year for the Fresenius Group with a variety of initiatives to secure long-term sustainable growth. In Q4/19, spending on property, plant and equipment was €871 million corresponding to 9% of sales (Q4/18: €793 million; 9%). In FY/19, spending on property, plant and equipment was €2,463 million corresponding to 7% of sales (FY/18: €2,163 million; 6%). The 2019 investments served primarily for the modernization and expansion of dialysis clinics, production facilities as well as hospitals, and day clinics.
In Q4/19, total acquisition spending was €331 million (Q4/18: €210 million). In FY/19, total acquisition spending was €2,623 million (FY/18: €1,086 million), mainly for the acquisition of NxStage by Fresenius Medical Care.
Cash flow development
In Q4/19, Group operating cash flow was €1,286 million including an IFRS 16 effect of €211 million. On a comparable basis, Group operating cash flow was €1,075 million (Q4/18: €1,193 million) with a margin of 11.5% (Q4/18: 13.5%). Free cash flow before acquisitions and dividends adjusted for IFRS 16 was €231 million (Q4/18: €472 million). Free cash flow after acquisitions and dividends adjusted for IFRS 16 was -€122 million (Q4/18: €202 million). The IFRS 16 effect amounts to €211 million. Correspondingly, cash flow from financing activities decreased by €211 million.
In FY/19, Group operating cash flow was €4,263 million including an IFRS 16 effect of €749 million. On a comparable basis, Group operating cash flow was €3,514 million
(FY/18: €3,742 million) with a margin of 9.9% (FY/18: 11.2%). The decrease was primarily driven by the FCPA-related charge of €206 million at Fresenius Medical Care. As a consequence, and in combination with the increased investments, free cash flow before acquisitions and dividends adjusted for IFRS 16 of €1,081 million was below the previous year (FY/18: €1,665 million). Free cash flow after acquisitions and dividends adjusted for IFRS 16 was -€2,294 million (FY/18: €1,374 million). The IFRS 16 effect amounts to €749 million. Correspondingly, cash flow from financing activities decreased by €749 million.
1 Net income attributable to shareholders of Fresenius SE & Co. KGaA
2 On a comparable basis: Q4/19 and FY/19 before special items and adjusted for IFRS 16 effect; Q4/18 and FY/18 before special items and adjusted for divestitures of Care Coordination activities at FMC
3 After special items and including IFRS 16 effect
For a detailed overview of special items and adjustments please see the reconciliation tables on pages 20-28 of the PDF document.
Solid balance sheet structure
The Group’s total assets were €67,006 million including an IFRS 16 effect of €5,769 million. Adjusted for IFRS 16, Group total assets increased by 8% (7% in constant currency) to €61,237 million (Dec. 31, 2018: €56,703 million). Current assets increased by 3% (3% in constant currency) to €15,264 million (Dec. 31, 2018: €14,790 million). Non-current assets1 increased by 10% (9% in constant currency) to €45,973 million (Dec. 31, 2018: € 41,913 million).
Total shareholders’ equity was €26,580 million including an IFRS 16 effect of -€256 million. Adjusted for IFRS 16, total shareholders’ equity increased by 7% (6% in constant currency) to €26,836 million (Dec. 31, 2018: €25,008 million). The equity ratio was 39.7%. Adjusted for IFRS 16, the equity ratio was 43.8% (Dec. 31, 2018: 44.1%).
Group debt was €27,258 million including an IFRS 16 effect of €6,025 million. Adjusted for IFRS 16, Group debt increased by 12% to €21,233 million (11% in constant currency) (Dec. 31, 2018: € 18,984 million). Group net debt was €25,604 million including an IFRS 16 effect of €6,025 million. Adjusted for IFRS 16, Group net debt increased by 20% (20% in constant currency) to € 19,579 million (Dec. 31, 2018: € 16,275 million) mainly due to the acquisition of NxStage by Fresenius Medical Care.
As of December 31, 2019, the reported net debt/EBITDA ratio was 3.61x2,3,4. Adjusted for IFRS 16, the net debt/EBITDA ratio was 3.14x1,2,3,4 (Dec. 31, 2018: 2.71x2,4).
1 Adjusted for IFRS 16
2 At LTM average exchange rates for both net debt and EBITDA; pro forma closed acquisitions/divestitures
3 Including acquisition of NxStage
4 Before special items
For a detailed overview of special items and adjustments please see the reconciliation tables on pages 20-28 of the PDF document.
Business Segments
Fresenius Medical Care (Financial data according to Fresenius Medical Care press release)
Fresenius Medical Care is the world's largest provider of products and services for individuals with renal diseases. As of December 31, 2019, Fresenius Medical Care was treating 345,096 patients in 3,994 dialysis clinics. Along with its core business, the company provides related medical services in the field of Care Coordination.

• 5 % organic sales growth in Q4/19
• Investments in home dialysis and growth markets in 2019
• FY/20 outlook : Sales4 and net income5 growth6 within a mid to high single digit percentage range expected
Adjusted for IFRS 16, the contribution from the divested Care Coordination activities and NxStage, sales increased by 6% (4% in constant currency) to €4,546 million in Q4/19 (Q4/18: €4,294 million). Organic sales growth was 5%. Positive currency translation effects of 2% were mainly related to the U.S. dollar strengthening against the euro. In FY/19, sales adjusted for IFRS 16, the contributions from the divested Care Coordination activities and NxStage increased by 8% (5% in constant currency) to €17,329 million (FY/18: €16,026 million). Organic sales growth was 5%.
In Q4/19, EBIT7 increased by 3% (0% in constant currency) to €655 million (Q4/18: €636 million). The EBIT6 margin was 14.4% (Q4/18: 14.8%).
1 On an adjusted basis: before special items (transaction-related expenses, gain related to divestitures of Care Coordination activities, expenses associated with the cost optimization program), adjusted for IFRS 16 effect, excluding effects from NxStage transaction
2 Q4/18 and FY/18 before special items and adjusted for divestitures of Care Coordination activities
3 Net income attributable to shareholders of Fresenius Medical Care AG & Co. KGaA
4 FY/19 base: €17,477 million, including IFRS 16 effect
5 FY/19 base: €1,236 million, before special items, including IFRS 16 effect; FY/20: before special items
6 In constant currency
7 Q4/18 and FY/18 before special items items and after adjustments
Q4/19 and FY/19 before special items (transaction-related expenses, gain related to divestitures of Care
Coordination activities, expenses associated with the cost optimization program), adjusted for IFRS 16 effect,
excluding effects from NxStage transaction
For a detailed overview of special items and adjustments please see the reconciliation tables on pages 20-28 of the PDF document.
In FY/19, EBIT1 of €2,296 million remained at prior-year’s level (decreased by 4% in constant currency; FY/18: €2,292 million). The EBIT1 margin decreased to 13.2% (FY/18: 14.3%). Adjustments on accounts receivable in legal dispute paired with reduced patient attribution and a decreasing savings rate for ESCOs weighed on earnings. These effects were partially offset by the remeasurement effect of the fair value of the investment on Humacyte, Inc.
In Q4/19, net income1,2 increased by 3% (0% in constant currency) to €408 million (Q4/18: €395 million). In FY/19, net income1,2 increased by 2% (-2% in constant currency) to €1,369 million (FY/18: €1,341 million).
In Q4/19, operating cash flow was €597 million3 (Q4/18: €698 million) with a margin of 13.1% (Q4/18: 16.2%). In FY/19, operating cash flow was €1,947 million4 (FY/18: €2,062 million) with a margin of 11.2% (FY/18: 12.5%).
For FY/20, Fresenius Medical Care expects sales5 to grow within a mid to high single digit percentage range in constant currency. Net income2,6 is also expected to grow within a mid to high single digit percentage range in constant currency.
For further information on the IFRS 16 reconciliation of Fresenius Medical Care, please see page 18 of the PDF document.
For further information, please see Fresenius Medical Care’s press release at www.freseniusmedicalcare.com.
1 Q4/18 and FY/18 before special items and after adjustments;
Q4/19 and FY/19 before special items (transaction-related expenses, gain related to divestitures of care coordination activities, expenses associated with the cost optimization program), adjusted for IFRS 16 effect, excluding effects from NxStage transaction
2 Net income attributable to shareholders of Fresenius Medical Care AG & Co. KGaA
3 €771 million including an IFRS 16 effect of €174 million
4 €2,567 million including an IFRS 16 effect of €620 million
5 FY/19 base: €17,477 million, including IFRS 16 effect
6 FY/19 base: €1,236 million, before special items (transaction-related expenses, gain related to divestitures of care coordination activities, expenses associated with the cost optimization program), including IFRS 16 effect;
FY/20: before special items
For a detailed overview of special items and adjustments please see the reconciliation tables on pages 20-28 of the PDF document.
Fresenius Kabi
Fresenius Kabi offers intravenously administered generic drugs, clinical nutrition and infusion therapies for seriously and chronically ill patients in the hospital and outpatient environments. The company is also a leading supplier of medical devices and transfusion technology products. In the biosimilars business, Fresenius Kabi develops products with a focus on oncology and autoimmune diseases.

• 4% organic sales growth in Q4/19
• Excellent Emerging Markets growth partially offsets softer development in North America
• FY/20 outlook: organic sales3 growth of 3% to 6% and EBIT development4 of -4% to 0% expected
In Q4/19, sales of Fresenius Kabi increased by 5% (4% in constant currency) to €1,766 million (Q4/18: €1,687 million). Organic sales growth was 4%. In FY/19, sales increased by 6% (4% in constant currency) to €6,919 million (FY/18: €6,544 million). Organic sales growth was 4%. Positive currency translation effects of 2% were mainly related to the U.S. dollar strengthening against the euro.
In Q4/19, sales in North America increased by 2% (organic growth: 1%; Q4/18: €599 million) to €609 million. In FY/19, sales in North America increased by 3% (organic growth: -2%) to €2,424 million (FY/18: €2,359 million). Intensified competition on selected molecules, missing tailwinds from drug shortages as well as a shift in clinical practice towards non-opiods in the hospital-based pain management weighed on the sales development.
In Q4/19, sales in Europe grew by 2% (organic growth: 2%) to €604 million (Q4/18: €590 million). In FY/19, sales in Europe increased by 3% (organic growth: 2%) to €2,313 million
(FY/18: €2,248 million).
1 On a comparable basis: before special items and adjusted for IFRS 16 effect
2 Net income attributable to shareholders of Fresenius SE & Co. KGaA
3 FY/19 base: €6,919 million, including IFRS 16 effect
4 FY/19 base: €1,205 million; FY/19 before special items (transaction-related expenses, revaluations of biosimilars contingent purchase price liabilities), including IFRS 16 effect; FY/20: before special items, in constant currency
For a detailed overview of special items and adjustments please see the reconciliation tables on pages 20-28 of the PDF document.
In Q4/19, sales in Asia-Pacific increased by 15% (organic growth: 13%) to €385 million (Q4/18: €336 million). In FY/19, sales in Asia-Pacific increased by 16% (organic growth: 14%) to €1,506 million (FY/18: €1,300 million).
In Q4/19, sales in Latin America/Africa increased by 4% (organic growth: 10%) to €168 million (Q4/18: €162 million). In FY/19, sales in Latin America/Africa increased by 6% (organic growth: 14%) to €676 million (FY/18: €637 million).
In Q4/19, EBIT1 decreased by 1% (-1% in constant currency) to €283 million (Q4/18: €285 million) with an EBIT margin of 16.0% (Q4/18: 16.9%). In FY/19, EBIT1 increased by 5% (3% in constant currency) to €1,200 million (FY/18: €1,139 million) with an EBIT margin of 17.3% (FY/18: 17.4%).
In Q4/19, net income1,2 decreased by 2% (-3% in constant currency) to €184 million (Q4/18: €188 million). In FY/19, net income1,2 increased by 8% (5% in constant currency) to €802 million (FY/18: €742 million).
In Q4/19, operating cash flow3 was €273 million (Q4/18: €220 million) with a margin3 of 15.5% (Q4/18: 13.0%). In FY/19, operating cash flow3 was €968 million (FY/18: €1,040 million) with a margin3 of 14.0% (FY/18: 15.9%).
For FY/20, Fresenius Kabi expects organic sales growth4 of 3% to 6% and an EBIT development5 of -4% to 0% in constant currency.
For further information on the IFRS 16 reconciliation of Fresenius Kabi, please see page 18 of the PDF document of the PDF document.
1 On a comparable basis: before special items and adjusted for IFRS 16
2 Net income attributable to shareholders of Fresenius SE & Co. KGaA
3 Adjusted for IFRS 16 (operating cash flow after special items)
4 FY/19 base: €6,919 million, including IFRS 16 effect
5 FY/19 base: €1,205 million; FY/19 before special items (transaction-related expenses, revaluations of biosimilars contingent purchase price liabilities), including IFRS 16 effect; FY/20: before special items
For a detailed overview of special items and adjustments please see the reconciliation tables on pages 20-28 of the PDF document.
Fresenius Helios
Fresenius Helios is Europe's leading private hospital operator. The company comprises Helios Germany and Helios Spain (Quirónsalud). Helios Germany operates 86 hospitals, ~125 outpatient centers and 8 prevention centers. Quirónsalud operates 47 hospitals, 71 outpatient centers and around 300 occupational risk prevention centers. In addition, the company is active in Latin America with 4 hospitals and as a provider of medical diagnostics.

• Helios Germany with solid organic sales growth of 3% in Q4/19; return to EBIT growth in Q4/19
• Helios Spain with excellent organic sales growth of 7% in Q4/19; acquisitions in Latin America support further growth
• FY/20 outlook: organic sales4 growth of 3% to 6% and EBIT growth of 3% to 7% (in constant currency) expected
In Q4/19, sales increased by 5% (organic growth: 4%) to €2,344 million (Q4/18: €2,231 million). In FY/19, sales increased by 3% (5%1; organic growth: 5%) to €9,234 million (FY/18: €8,993 million).
In Q4/19, sales of Helios Germany increased by 3% (organic growth: 3%) to €1,475 million (Q4/18: €1,439 million). Organic sales growth was positively influenced by pricing effects and slight admissions growth. In FY/19, sales of Helios Germany decreased by 1% (increased by 3%1; organic growth: 3%) to €5,940 million (FY/18: €5,970 million). The reclassification of nursing staff funding from other income to sales also contributed to growth.
In Q4/19, sales of Helios Spain increased by 9% (organic growth: 7%) to €867 million (Q4/18: €792 million). Organic sales growth was positively influenced by admission growth and excellent execution within the existing hospital and service offerings. In FY/19, sales of Helios Spain increased by 9% (organic growth: 7%) to €3,292 million (FY/18: €3,023 million).
1 Adjusted for the post-acute care business transferred to Fresenius Vamed as of July 1, 2018
2 Adjusted for IFRS 16 effect
3 Net income attributable to shareholders of Fresenius SE & Co. KGaA
4 FY/19 base: €9,234 million, including IFRS 16 effect
5 FY/19 base: €1,025 million, including IFRS 16 effect
For a detailed overview of special items and adjustments please see the reconciliation tables on pages 20-28 of the PDF document.
In Q4/19, EBIT1 of Fresenius Helios increased by 5% to €292 million (Q4/18: €277 million) with an EBIT margin of 12.5% (Q4/18: 12.4%). In FY/19, EBIT1 decreased by 4% (-3% ) to €1,015 million (FY/18: €1,052 million) with an EBIT margin of 11.0% (FY/18: 11.7%).
In Q4/19, EBIT1 of Helios Germany increased by 4% to €143 million (Q4/18: €137 million) with an EBIT margin of 9.7% (Q4/18: 9.5%). In FY/19, EBIT1 of Helios Germany decreased by 8% (-6%2) to €576 million (FY/18: €625 million) with an EBIT margin of 9.7% (FY/18: 10.5%). Ongoing investments to counter regulatory headwinds continued to weigh on Helios Germany’s financial performance.
In Q4/19, EBIT1 of Helios Spain increased by 6% to €134 million (Q4/18: €127 million) with an EBIT margin of 15.5% (Q4/18: 16.0%). In FY/19, EBIT1 of Helios Spain increased by 5% to €434 million (FY/18: €413 million) with an EBIT margin of 13.2% (FY/18: 13.7%).
In Q4/19, net income1,3 increased by 16% to €198 million (Q4/18: €170 million). In FY/19, net income1,3 decreased by 2% to €670 million (FY/18: €686 million).
In Q4/19, operating cash flow1 increased to €212 million (Q4/18: €167 million) with a margin of 9.0% (Q4/18: 7.5%). In FY/19, operating cash flow1 increased to €683 million (FY/18: €554 million) with a margin of 7.4% (FY/18: 6.2%).
For FY/20, Fresenius Helios expects organic sales4 growth of 3% to 6% and EBIT5 growth of 3% to 7% in constant currency.
For further information on the IFRS 16 reconciliation of Fresenius Helios, please see page 18 of the PDF document.
1 Adjusted for IFRS 16 effect
2 Adjusted for the post-acute care business transferred to Fresenius Vamed as of July 1, 2018
3 Net income attributable to shareholders of Fresenius SE & Co. KGaA
4 FY/19 base: €9,234 million, including IFRS 16 effect
5 FY/19 base: €1,025 million, including IFRS 16 effect
For a detailed overview of special items and adjustments please see the reconciliation tables on pages 20-28 of the PDF document.
Fresenius Vamed
Fresenius Vamed manages projects and provides services for hospitals and other health care facilities worldwide and is a leading post-acute care provider in Central Europe. The portfolio ranges along the entire value chain: from project development, planning, and turnkey construction, via maintenance and technical management to total operational management.

• Dynamic sales growth of service business of 11% in Q4/19
• Record order backlog supports future sales development of the project business
• FY/20 outlook: organic sales4 growth of 4% to 7% and EBIT5 growth of 5% to 9% (in constant currency) expected
In Q4/19, sales of Fresenius Vamed increased by 6% to €737 million (Q4/18: €697 million). Organic sales growth was 4%. Acquisitions and currency translation effects contributed each 1% to growth. In FY/19, sales increased by 31% (19%1) to €2,206 million (FY/18: €1,688 million). Organic sales growth was 16%. Acquisitions contributed 14% and currency translation effects contributed 1% to growth. Both the service and the project business showed strong growth momentum.
In Q4/19, sales in the service business grew by 11% to €374 million (Q4/18: €337 million). Sales of the project business increased by 1% to €363 million (Q4/18: €360 million).
In Q4/19, EBIT2 increased by 8% to €66 million (Q4/18: €61 million) with an EBIT margin of 9.0% (Q4/18: 8.8%). In FY/19, EBIT2 increased by 19% (6%1) to €131 million (FY/18: €110 million) with an EBIT margin of 5.9% (FY/18: 6.5%).
In Q4/19, net income2,3 increased by 13% to €44 million (Q4/18: €39 million). In FY/19, net income2,3 increased by 18% to €85 million (FY/18: €72 million).
1 Adjusted for German post-acute care business acquired from Fresenius Helios as of July 1, 2018
2 Adjusted for IFRS 16 effect
3 Net income attributable to shareholders of VAMED AG
4 FY/19 base: €2,206 million, including IFRS 16 effect
5 FY/19 base: €134 million, including IFRS 16 effect
For a detailed overview of special items and adjustments please see the reconciliation tables on pages 20-28 of the PDF document.
In Q4/19, order intake was €576 million (Q4/18: €660 million). FY/19 order intake increased by 7% to €1,314 million (FY/18: €1,227 million). As of December 31, 2019, order backlog reached an all-time high at €2,865 million (December 31, 2018: €2,420 million).
In Q4/19, operating cash flow1 decreased to -€8 million (Q4/18: €108 million) with a margin of -1.1% (Q4/18: 15.5%). In FY/19, operating cash flow1 decreased to -€46 million (FY/18: €106 million) with a margin of -2.1% (FY/18: 6.3%) given timing of payments in the project business as well as increased working capital.
For FY/20, Fresenius Vamed expects organic sales2 growth of 4% to 7% and EBIT3 growth of 5% to 9% in constant currency.
For further information on the IFRS 16 reconciliation of Fresenius Vamed, please see page 18 of the PDF document.
1 Adjusted for IFRS 16 effect
2 FY/19 base: €2,206 million, including IFRS 16 effect
3 FY/19 base: €134 million, including IFRS 16 effect
For a detailed overview of special items and adjustments please see the reconciliation tables on pages 20-28 of the PDF document.
Conference Call
As part of the publication of the results for FY 2019, a conference call will be held on February 20, 2020 at 1:30 p.m. CET (7:30 a.m. EST). All investors are cordially invited to follow the conference call in a live broadcast over the Internet at www.fresenius.com/investors. Following the call, a replay will be available on our website.
For additional information on the performance indicators used please refer to our website www.fresenius.com/alternative-performance-measures.
This release contains forward-looking statements that are subject to various risks and uncertainties. Future results could differ materially from those described in these forward-looking statements due to certain factors, e.g. changes in business, economic and competitive conditions, regulatory reforms, results of clinical trials, foreign exchange rate fluctuations, uncertainties in litigation or investigative proceedings, and the availability of financing. Fresenius does not undertake any responsibility to update the forward-looking statements in this release.
- Strong organic sales growth across all business segments
- Growth investments proceeding according to plan
- Fresenius Kabi’s excellent Emerging Markets growth partially offsets softer development in North America
- Fresenius Helios showing excellent organic sales growth across all regions
- Fresenius Medical Care with record growth in home dialysis in North America
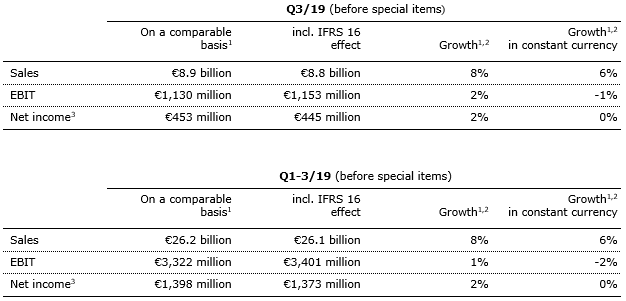
1 Adjusted for IFRS 16 effect
2 Q3/18 and Q1-3/18 before special items and adjusted for divestitures of Care Coordination activities at Fresenius Medical Care (FMC)
3 Net income attributable to shareholders of Fresenius SE & Co. KGaA
For a detailed overview of special items and adjustments please see the reconciliation tables on pages 20-28 of the PDF document.
Group guidance for 2019 confirmed
Based on the Group’s solid Q1-3/19 results and good prospects for the remainder of the year, Fresenius confirms its 2019 Group sales and earnings guidance. Fresenius projects sales growth1 of 4% to 7% in constant currency. Net income2,3 growth is expected to be ~0% in constant currency. The guidance for 2019 includes the sales and dilutive earnings contributions of the NxStage acquisition.
Fresenius expects net debt/EBITDA4 at year-end to be around the upper-end of the original self-imposed target corridor of 2.5x to 3.0x. This includes the NxStage acquisition which is increasing the net debt/EBITDA ratio in 2019 by ~30 basis points and excludes IFRS 16 effects.
Due to the adoption of the IFRS 16 accounting standard (“IFRS 16 effect”), Fresenius’ self-imposed target corridor has shifted to 3.0x to 3.5x net debt/EBITDA on a reported basis.
1 On a comparable basis: FY/18 base: €33,009 million; FY/18 adjusted for divestitures of Care Coordination activities at FMC; FY/19: adjusted for IFRS 16 effect
2 Net income attributable to shareholders of Fresenius SE & Co. KGaA
3 On a comparable basis: FY/18 base: €1,872 million; FY/18 before special items and adjusted for divestitures of Care Coordination activities at FMC; FY/19: before special items (transaction-related expenses, revaluations of biosimilars contingent liabilities, gain related to divestitures of Care Coordination activities at FMC, expenses associated with the cost optimization program at FMC), adjusted for IFRS 16 effect
4 Both net debt and EBITDA calculated at expected annual average exchange rates; excluding further potential acquisitions
For a detailed overview of special items and adjustments please see the reconciliation tables on pages 20-28 of the PDF document.
6% sales growth1 in constant currency
Group sales were €8,842 million including an IFRS 16 effect of -€35 million. Group sales1 on a comparable basis increased by 8% (6% in constant currency) to €8,877 million (Q3/18: €8,185 million). Organic sales growth was 5%. Acquisitions/divestitures contributed net 1% to growth.
In Q1-3/19, Group sales were €26,098 million including an IFRS 16 effect of -€75 million. Group sales1 on a comparable basis increased by 8% (6% in constant currency) to €26,173 million (Q1-3/18: €24,179 million). Organic sales growth was 5%. Acquisitions/divestitures contributed net 1% to growth. Positive currency translation effects of 2% were mainly driven by the U.S. dollar strengthening against the euro.
Net income2,3 growth in constant currency
Group EBITDA before special items was €1,763 million including an IFRS 16 effect of €237 million. Group EBITDA2 on a comparable basis increased by 4% (2% in constant currency) to €1,526 million (Q3/18: €1,463 million).
In Q1-3/19, Group EBITDA before special items was €5,167 million including an IFRS 16 effect of €699 million. Group EBITDA2 on a comparable basis increased by 3% (0% in constant currency) to €4,468 million (Q1-3/18: €4,352 million).
Group EBIT before special items was €1,153 million including an IFRS 16 effect of €23 million. Group EBIT2 on a comparable basis increased by 2% (-1% in constant currency) to €1,130 million (Q3/18: €1,112 million). The EBIT margin2 on a comparable basis was 12.7% (Q3/18: 13.6%). Reported Group EBIT4 was €1,129 million. Group EBIT was impacted by a negative effect from adjustments on accounts receivable in legal dispute of €84 million5 at Fresenius Medical Care, the reduction in patient attribution and a decreasing savings rate for ESCOs, based on recent reports under discussion for current and prior plan years as well as a softer development in North America at Fresenius Kabi. Moreover, investments to counter the regulatory headwinds at Helios Germany continued to weigh on the Group’s EBIT. These effects were partially offset by the remeasurement effect on the fair value of an investment in Humacyte, Inc. at Fresenius Medical Care.
1 On a comparable basis: Q3/18 and Q1-3/18 adjusted for divestitures of Care Coordination activities at FMC;
Q3/19 and Q1-3/19 adjusted for IFRS 16 effect
2 On a comparable basis: Q3/19 and Q1-3/19 before special items and adjusted for IFRS 16 effect;
Q3/18 and Q1-3/18 before special items and adjusted for divestitures of Care Coordination activities at FMC
3 Net income attributable to shareholders of Fresenius SE & Co. KGaA
4 After special items and including IFRS 16 effect
5 Please see footnote 5 on page 7 in the FMC section
For a detailed overview of special items and adjustments please see the reconciliation tables on pages 20-28 of the PDF document.
In Q1-3/19, Group EBIT before special items was €3,401 million including an IFRS 16 effect of €79 million. Group EBIT1 on a comparable basis increased by 1% (-2% in constant currency) to €3,322 million (Q1-3/18: €3,297 million). The EBIT margin1 on a comparable basis was 12.7% (Q1-3/18: 13.6%). Reported Group EBIT2 was €3,362 million.
Group net interest before special items was -€171 million including an IFRS 16 effect of -€47 million. On a comparable basis, net interest improved to -€124 million (Q3/18: -€141 million) mainly due to successful refinancing activities and lower interest rates. Reported Group net interest2 was -€172 million.
In Q1-3/19, Group net interest before special items was -€532 million including an IFRS 16 effect of -€153 million. On a comparable basis, net interest1 improved to -€379 million
(Q1-3/18: -€420 million). Reported Group net interest2 was -€535 million.
The Group tax rate before special items and adopting IFRS 16 was 23.1% in both Q3/19 and Q1-3/19. Group tax rate1 on a comparable basis was also 23.1% in both Q3/19 and Q1-3/19 (Q3/18: 21.3%; Q1-3/18: 21.9%).
Noncontrolling interest before special items was €310 million including an IFRS 16 effect of €11 million. Noncontrolling interest1 on a comparable basis was €321 million (Q3/18:
€320 million).
In Q1-3/19, noncontrolling interest before special items was €834 million including an IFRS 16 effect of €31 million. Noncontrolling interest1 on a comparable basis was €865 million (Q1-3/18: €880 million), of which 93% was attributable to the noncontrolling interest in Fresenius Medical Care.
Group net income3 before special items was €445 million including an IFRS 16 effect of -€8 million. Group net income1,3 on a comparable basis increased by 2% (0% in constant currency) to €453 million (Q3/18: €444 million). Reported Group net income2,3 was €444 million.
1 On a comparable basis: Q3/19 and Q1-3/19 before special items and adjusted for IFRS 16 effect;
Q3/18 and Q1-3/18 before special items and adjusted for divestitures of Care Coordination activities at FMC
2 After special items and including IFRS 16 effect
3 Net income attributable to shareholders of Fresenius SE & Co. KGaA
For a detailed overview of special items and adjustments please see the reconciliation tables on pages 20-28 of the PDF document.
Earnings per share1 before special items were €0.80 including an IFRS 16 effect of -€0.01. Earnings per share1,2 on a comparable basis increased by 1% (0% in constant currency) to €0.81 (Q3/18: €0.80). Reported Earnings per share1,3 were €0.80.
In Q1-3/19, Group net income1 before special items was €1,373 million including an IFRS 16 effect of -€25 million. Group net income1,2 on a comparable basis increased by 2% (0% in constant currency) to €1,398 million (Q1-3/18: €1,368 million). Reported Group net income1,3 was €1,368 million. In Q1-3/19, Earnings per share1 before special items were €2.47 including an IFRS 16 effect of -€0.04. Earnings per share1,2 on a comparable basis increased by 2% (0% in constant currency) to €2.51 (Q1-3/18: €2.46). Reported Earnings per share1,3 were €2.46.
Continued investment in growth
2019 is an investment year for the Fresenius Group. Fresenius is making good progress in all of its investment initiatives to secure long-term sustainable growth. Spending on property, plant and equipment was €586 million (Q3/18: €539 million). This corresponds to 7% of sales. In Q1-3/19, spending on property, plant and equipment was €1,592 million (Q1-3/18: €1,370 million), primarily for the modernization and expansion of dialysis clinics, production facilities as well as hospitals and day clinics. This corresponds to 6% of sales.
Total acquisition spending was €135 million (Q3/18: €490 million). In Q1-3/19, total acquisition spending was €2,292 million (Q1-3/18: €876 million), mainly for the acquisition of NxStage by Fresenius Medical Care.
Cash flow development
Group operating cash flow was €1,483 million including an IFRS 16 effect of €185 million. Adjusted for IFRS 16, Group operating cash flow was €1,298 million (Q3/18: €1,293 million) with a margin of 14.6% (Q3/18: 15.8%). Free cash flow before acquisitions and dividends adjusted for IFRS 16 was €722 million (Q3/18: €768 million). Free cash flow after acquisitions and dividends adjusted for IFRS 16 was €547 million (Q3/18: €230 million). The IFRS 16 effect amounts to €185 million respectively. Correspondingly, cash flow from financing activities decreased by €185 million.
1 Net income attributable to shareholders of Fresenius SE & Co. KGaA
2 On a comparable basis: Q3/19 and Q1-3/19 before special items and adjusted for IFRS 16 effect;
Q3/18 and Q1-3/18 before special items and adjusted for divestitures of Care Coordination activities at FMC
3 After special items and including IFRS 16 effect
For a detailed overview of special items and adjustments please see the reconciliation tables on pages 20-28 of the PDF document.
In Q1-3/19, Group operating cash flow was €2,977 million including an IFRS 16 effect of €538 million. Adjusted for IFRS 16, Group operating cash flow was € 2,439 million
(Q1-3/18: €2,549 million) with a margin of 9.3% (Q1-3/18: 10.3%). With €850 million, free cash flow before acquisitions and dividends adjusted for IFRS 16 was below the previous year (Q1-3/18: €1,193 million) mainly due to increasing investments. Free cash flow after acquisitions and dividends adjusted for IFRS 16 was -€2,172 million (Q1-3/18: €1,172 million). The IFRS 16 effect amounts to €538 million, respectively. Correspondingly, cash flow from financing activities decreased by €538 million.
Solid balance sheet structure
The Group’s total assets were €66,759 million including an IFRS 16 effect of €5,667 million. Adjusted for IFRS 16, Group total assets1 increased by 8% (5% in constant currency) to €61,092 million (Dec. 31, 2018: €56,703 million). Current assets1 increased by 3% (1% in constant currency) to €15,180 million (Dec. 31, 2018: €14,790 million). Non-current assets1 increased by 10% (7% in constant currency) to €45,912 million (Dec. 31, 2018: € 41,913 million).
Total shareholders’ equity was €26,696 million including an IFRS 16 effect of -€232 million. Adjusted for IFRS 16, total shareholders’ equity increased by 8% (4% in constant currency) to €26,928 million (Dec. 31, 2018: €25,008 million). The equity ratio was 40.0%. Adjusted for IFRS 16, the equity ratio was 44.1% (Dec. 31, 2018: 44.1%).
Group debt was €27,013 million including an IFRS 16 effect of €5,899 million. Adjusted for IFRS 16, Group debt increased by 11% to €21,114 million (10% in constant currency) (Dec. 31, 2018: € 18,984 million). Group net debt was €25,414 million including an IFRS 16 effect of €5,899 million. Adjusted for IFRS 16, Group net debt increased by 20% (18% in constant currency) to € 19,515 million (Dec. 31, 2018: € 16,275 million) mainly due to the acquisition of NxStage by Fresenius Medical Care.
As of September 30, 2019, the net debt/EBITDA ratio was 3.13x1,2,3,4 (Dec. 31, 2018: 2.71x2,4). Including the IFRS 16 effect, the reported net debt/EBITDA ratio was to 3.55x2,3,4.
1 Adjusted for IFRS 16 effect
2 At LTM average exchange rates for both net debt and EBITDA; pro forma closed acquisitions/divestitures
3 Including acquisition of NxStage
4 Before special items
For a detailed overview of special items and adjustments please see the reconciliation tables on pages 20-28 of the PDF document.
Business Segments
Fresenius Medical Care (Figures according to Fresenius Medical Care press release)
Fresenius Medical Care is the world's largest provider of products and services for individuals with renal diseases. As of September 30, 2019, Fresenius Medical Care was treating 342,488 patients in 4,003 dialysis clinics. Along with its core business, the company provides related medical services in the field of Care Coordination.
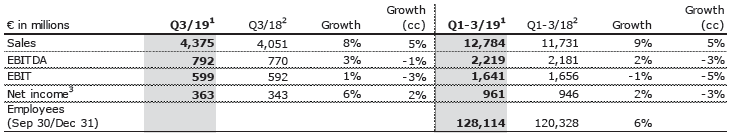
- 5% sales1,2 growth in constant currency
- Record growth in home dialysis in North America; improved earnings growth despite negative effect from ESCO effect
- FY/19 outlook confirmed
Adjusted for the contribution from the divested Care Coordination activities, the IFRS 16 effect and the contribution from NxStage, sales of Fresenius Medical Care increased by 8% (5% at constant currency) to €4,375 million (Q3/18: €4,051 million). Organic sales growth was 5%. Positive currency translation effects of 3% were mainly related to the U.S. dollar strengthening against the euro. In Q1-3/19, sales adjusted for the contribution from the divested Care Coordination activities, the IFRS 16 effect and the contribution from NxStage increased by 9% (5% at constant currency) to €12,784 million (Q1-3/18: €11,731 million). Organic sales growth was 5%.
EBIT4 increased by 1% (-3% in constant currency) to €599 million (Q3/18: €592 million). The EBIT margin decreased to 13.7% (Q3/18: 14.6%). EBIT development was impacted by a negative effect from adjustments on accounts receivable in legal dispute of € 84 million5 paired with the reduction in patient attribution and a decreasing savings rate for ESCOs, based on recent reports under discussion for current and prior plan years. These effects were partially offset by the remeasurement effect on the fair value of an investment in Humacyte, Inc.
In Q1-3/19, EBIT4 decreased by 1% (-5% in constant currency) to €1,641 million (Q1-3/18: €1,656 million). The EBIT margin decreased to 12.8% (Q1-3/18: 14.1%).
1 On an adjusted basis: before special items (transaction-related expenses, gain related to divestitures of Care Coordination activities, expenses associated with the cost optimization program), adjusted for IFRS 16 effect, excluding effects from NxStage transaction
2 Q3/18 and Q1-3/18 before special items and adjusted for divestitures of Care Coordination activities
3 Net income attributable to shareholders of Fresenius Medical Care AG & Co. KGaA
4 Q3/18 and Q1-3/18 before special items items and after adjustments
Q3/19 and Q1-3/19 before special items (transaction-related expenses, gain related to divestitures of Care Coordination activities, expenses associated with the cost optimization program), adjusted for IFRS 16 effect, excluding effects from NxStage transaction
5 This adjustment results from a material weakness in FMC`s internal controls over financial reporting regarding accounts receivable and revenue recognition specific to fee-for-service in legal dispute. FMC does not expect a restatement of its financial statements previously filed with the SEC. FMC is taking steps to remediate the control weakness.
For a detailed overview of special items and adjustments please see the reconciliation tables on pages 20-28 of the PDF document.
Net income1,2 increased by 6% (2% in constant currency) to €363 million (Q3/18: €343 million). In Q1-3/19, net income1,2 increased by 2% (-3% in constant currency) to €961 million (Q1-3/18: €946 million).
Operating cash flow was €715 million3 (Q3/18: €753 million) with a margin of 16.3% (Q3/18: 18.6%). In Q1-3/19, operating cash flow was €1,3504 million (Q1-3/18: €1,364 million) with a margin of 10.6% (Q1-3/18: 11.1%).
For FY/19, Fresenius Medical Care expects adjusted sales to grow by 3% to 7%5,6 in constant currency. Adjusted net income2 is expected to develop in the range of -2% to +2%5,7 in constant currency.
For further information on the IFRS 16 reconciliation of Fresenius Medical Care, please see page 18 of the PDF document.
For further information, please see Fresenius Medical Care’s press release at www.freseniusmedicalcare.com.
1 Q3/18 and Q1-3/18 before special items and after adjustments; Q3/19 and Q1-3/19 before special items (transaction-related expenses, gain related to divestitures of care coordination activities, expenses associated with the cost optimization program), adjusted for IFRS 16 effect, excluding effects from NxStage transaction
2 Net income attributable to shareholders of Fresenius Medical Care AG & Co. KGaA
3 €868 million including an IFRS 16 effect of €153 million
4 €1,796 million including an IFRS 16 effect of €446 million
5 FY/18 before special items, adjusted for divestitures of Care Coordination activities; FY/19 before special items (transaction-related expenses, gain related to divestitures of care coordination activities, expenses associated with the cost optimization program), adjusted for IFRS 16 effects, excluding effects from NxStage transaction
6 FY/18 base: €16,026 million
7 FY/18 base: €1,341 million
For a detailed overview of special items and adjustments please see the reconciliation tables on pages 20-28 of the PDF document.
Fresenius Kabi
Fresenius Kabi offers intravenously administered generic drugs, clinical nutrition and infusion therapies for seriously and chronically ill patients in the hospital and outpatient environments. The company is also a leading supplier of medical devices and transfusion technology products. In the biosimilars business, Fresenius Kabi develops products with a focus on oncology and autoimmune diseases.
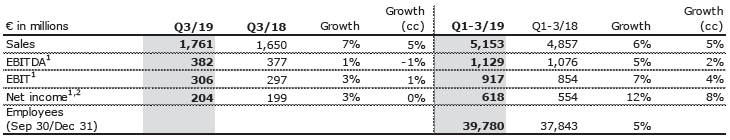
- 5% organic sales growth and 1% EBIT1 growth in constant currency
- Excellent Emerging Markets growth partially offsets softer development in North America
- FY/19 outlook confirmed
Sales of Fresenius Kabi increased by 7% (5% in constant currency) to €1,761 million (Q3/18: €1,650 million). Organic sales growth was 5%. In Q1-3/19, sales increased by 6% (5% in constant currency) to €5,153 million (Q1-3/18: €4,857 million). Organic sales growth was 4%. Positive currency translation effects of 1% were mainly related to the U.S. dollar strengthening against the euro.
Sales in North America of €619 million remained at previous year’s level (organic growth: 4%; Q3/18: €620 million). In Q1-3/19, sales in North America increased by 3% (organic growth:-3%) to €1,815 million (Q1-3/18: €1,760 million). Intensifying competition on selected molecules, a further easing of tailwinds from drug shortages as well as a shift in clinical practice towards non-opiods in the hospital-based pain management weighed on the sales development.
Sales in Europe grew by 5% (organic growth: 4%) to €564 million (Q3/18: €538 million). In Q1-3/19, sales in Europe increased by 3% (organic growth: 3%) to €1,709 million
(Q1-3/18: €1,658 million).
Sales in Asia-Pacific increased by 20% (organic growth: 18%) to €406 million (Q3/18: €337 million). In Q1-3/19, sales in Asia-Pacific increased by 16% (organic growth: 15%) to €1,121 million (Q1-3/18: €964 million).
Sales in Latin America/Africa increased by 11% (organic growth: 16%) to €172 million (Q3/18: €155 million). In Q1-3/19, sales in Latin America/Africa increased by 7% (organic growth: 16%) to €508 million (Q1-3/18: €475 million).
EBIT1 increased by 3% (1% in constant currency) to €306 million (Q3/18: €297 million) with an EBIT margin of 17.4% (Q3/18: 18.0%). In Q1-3/19, EBIT1 increased by 7% (4% in constant currency) to €917 million (Q1-3/18: €854 million) with an EBIT margin of 17.8% (Q1-3/18: 17.6%).
Net income1,2 increased by 3% (0% in constant currency) to €204 million (Q3/18: €199 million). In Q1-3/19, net income1,2 increased by 12% (8% in constant currency) to €618 million (Q1-3/18: €554 million).
Operating cash flow3 was €362 million (Q3/18: €366 million). The cash flow margin was 20.6% (Q3/18: 22.2%). In Q1-3/19, operating cash flow3 was €695 million (Q1-3/18: €820 million). The cash flow margin was 13.5% (Q1-3/18: 16.9%).
Fresenius Kabi confirms its outlook for FY/19 and expects organic sales growth4 of 3% to 6% and EBIT growth5 in constant currency of 3% to 6%.
For further information on the IFRS 16 reconciliation of Fresenius Kabi, please see page 18 of the PDF document.
1 On a comparable basis: before special items and adjusted for IFRS 16 effect
2 Net income attributable to shareholders of Fresenius SE & Co. KGaA
3 Adjusted for IFRS 16 effect (operating cash flow after special items)
4 On a comparable basis: FY/18 base: €6,544 million; FY/19 before special items (transaction-related expenses,
revaluations of biosimilars contingent liabilities) and adjusted for IFRS 16 effect
5 On a comparable basis: FY/18 base: €1,139 million; FY/18 before special items; FY/19 before special items
(transaction-related expenses, revaluations of biosimilars contingent liabilities) and adjusted for IFRS 16 effect.
For a detailed overview of special items and adjustments please see the reconciliation tables on pages 20-28 of the PDF document.
Fresenius Helios
Fresenius Helios is Europe's leading private hospital operator. The company comprises Helios Germany and Helios Spain (Quirónsalud). Helios Germany operates 86 hospitals, ~125 outpatient centers and treats approximately 5.3 million patients annually. Quirónsalud operates 50 hospitals, 62 outpatient centers and around 300 occupational risk prevention centers, and treats approximately 13.3 million patients annually.
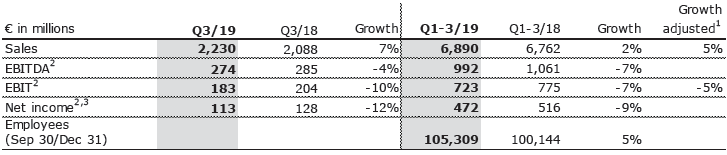
- Strong organic sales growth of 6%
- Helios Spain with excellent organic sales growth of 9%; effect from summer break not as pronounced as last year
- FY/19 outlook confirmed
Sales of Fresenius Helios increased by 7% (organic growth: 6%) to €2,230 million (Q3/18: €2,088 million). In Q1-3/19, sales increased by 2% (5% ; organic growth: 5%) to €6,890 million (Q1-3/18: €6,762 million).
Sales of Helios Germany increased by 5% (organic growth: 5%) to €1,474 million (Q3/18: €1,410 million). Organic sales growth was positively influenced by pricing effects and admissions growth. The reclassification of nursing staff funding from other income to sales contributed about 1% to growth. In Q1-3/19, sales of Helios Germany decreased by 1% (increased by 4%1; organic growth: 4%) to €4,465 million (Q1-3/18: €4,531 million).
Sales of Helios Spain increased by 12% (organic growth: 9%) to €757 million (Q3/18: €678 million). In Q1-3/19, sales of Helios Spain increased by 9% (organic growth: 7%) to €2,425 million (Q1-3/18: €2,231 million).
1 Adjusted for the post-acute care business transferred to Fresenius Vamed as of July 1, 2018
2 Adjusted for IFRS 16 effect
3 Net income attributable to shareholders of Fresenius SE & Co. KGaA
For a detailed overview of special items and adjustments please see the reconciliation tables on pages 20-28 of the PDF document.
EBIT1 of Fresenius Helios decreased by 10% to €183 million (Q3/18: €204 million) with an EBIT margin of 8.2% (Q3/18: 9.8%). In Q1-3/19, EBIT1 of Fresenius Helios decreased by 7% (-5% ) to €723 million (Q1-3/18: €775 million) with an EBIT margin of 10.5% (Q1-3/18: 11.5%).
EBIT1 of Helios Germany decreased by 9% to €130 million (Q3/18: €143 million) with an EBIT margin of 8.8% (Q3/18: 10.1%). Ongoing investments to counter regulatory headwinds continued to weigh on Helios Germany’s financial performance. In Q1-3/19, EBIT1 of Helios Germany decreased by 11% (-9%2) to €433 million (Q1-3/18: €488 million) with an EBIT margin of 9.7% (Q1-3/18: 10.8%).
EBIT1 of Helios Spain decreased by 5% to €56 million (Q3/18: €59 million) with an EBIT margin of 7.4% (Q3/18: 8.7%). EBIT was impacted by costs for temporary workers in order to cope with the higher than anticipated number of admissions. In Q1-3/19, EBIT1 of Helios Spain increased by 5% to €300 million (Q1-3/18: €286 million) with an EBIT margin of 12.4% (Q1-3/18: 12.8%).
Net income1,3 decreased by 12% to €113 million (Q3/18: €128 million). In Q1-3/19, net income1,3 decreased by 9% to €472 million (Q1-3/18: €516 million).
Operating cash flow1 increased to €183 million (Q3/18: €128 million) with a margin of 8.2% (Q3/18: 6.1%). In Q1-3/19, operating cash flow1 increased to €471 million (Q1-3/18: €387 million) with a margin of 6.8% (Q1-3/18: 5.7%).
Fresenius Helios confirms its outlook for FY/19 and expects organic sales growth of 2% to 5% and negative EBIT1 growth of -5% to -2%.
For further information on the IFRS 16 reconciliation of Fresenius Helios, please see page 18 of the PDF document.
1 Adjusted for IFRS 16 effect
2 Adjusted for the post-acute care business transferred to Fresenius Vamed as of July 1, 2018
3 Net income attributable to shareholders of Fresenius SE & Co. KGaA
For a detailed overview of special items and adjustments please see the reconciliation tables on pages 20-28 of the PDF document.
Fresenius Vamed
Fresenius Vamed manages projects and provides services for hospitals and other health care facilities worldwide and is a leading post-acute care provider in Central Europe. The portfolio ranges along the entire value chain: from project development, planning, and turnkey construction, via maintenance and technical management to total operational management.
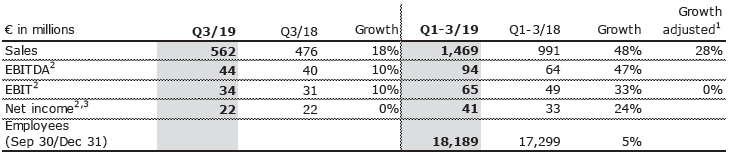
- Strong organic sales growth of 17%
- Integration of post-acute care business from Helios completed
- FY/19 outlook confirmed
Sales of Fresenius Vamed increased by 18% to €562 million (Q3/18: €476 million). Organic sales growth was 17%, acquisitions contributed 1% to growth.
Sales in the service business grew by 11% to €349 million (Q3/18: €315 million). Sales of the project business increased by 32% to €213 million (Q3/18: €161 million). In Q1-3/19, sales increased by 48% (28%1) to €1,469 million (Q1-3/18: €991 million). Organic sales growth was 24%, acquisitions contributed 24% to growth. Both the service and the project business showed strong growth momentum.
EBIT2 increased by 10% to €34 million (Q3/18: €31 million) with an EBIT margin of 6.0% (Q3/18: 6.5%). In Q1-3/19, EBIT2 increased by 33% (0%1) to €65 million (Q1-3/18: €49 million) with an EBIT margin of 4.4% (Q1-3/18: 4.9%).
Net income2,3 of €22 million remained at previous year’s level (Q3/18: €22 million). In Q1-3/19, net income2,3 increased by 24% to €41 million (Q1-3/18: €33 million).
Order intake increased by 114% to €240 million (Q3/18: €112 million) and in Q1-3/19 by 30% to €738 million (Q1-3/18: €567 million). As of September 30, 2019, order backlog reached an all-time high at €2,711 million (Dec. 31, 2018: €2,420 million).
Operating cash flow2 decreased to €27 million (Q3/18: €54 million) with a margin of 4.8% (Q3/18: 11.3%). In Q1-3/19, Operating cash flow2 decreased to -€38 million (Q1-3/18:
-€2 million) with a margin of -2.6% (Q1-3/18: -0.2%) given timing of payments in the project business.
Fresenius Vamed confirms its outlook for FY/19 and expects organic sales growth of ~10% and EBIT growth2 of 15% to 20%.
For further information on the IFRS 16 reconciliation of Fresenius Vamed, please see page 18 of the PDF document.
1 Adjusted for German post-acute care business acquired from Fresenius Helios as of July 1, 2018
2 Adjusted for IFRS 16 effect
3 Net income attributable to shareholders of VAMED AG
For a detailed overview of special items and adjustments please see the reconciliation tables on pages 20-28 of the PDF document.
Conference Call
As part of the publication of the results for the third quarter / first three quarters of 2019, a conference call will be held on October 29, 2019 at 1:30 p.m. CET (8:30 a.m. EDT). All investors are cordially invited to follow the conference call in a live broadcast over the Internet at www.fresenius.com/investors. Following the call, a replay will be available on our website.
For additional information on the performance indicators used please refer to our website www.fresenius.com/alternative-performance-measures.
This release contains forward-looking statements that are subject to various risks and uncertainties. Future results could differ materially from those described in these forward-looking statements due to certain factors, e.g. changes in business, economic and competitive conditions, regulatory reforms, results of clinical trials, foreign exchange rate fluctuations, uncertainties in litigation or investigative proceedings, and the availability of financing. Fresenius does not undertake any responsibility to update the forward-looking statements in this release.
- Good organic sales growth across all business segments
- Growth investments well on track
- Fresenius Kabi successfully launched first biosimilar in Europe; continued excellent growth in Emerging Markets
- Fresenius Helios showing strong organic sales growth in Germany and enters successfully Colombian hospital market
- Fresenius Medical Care’s strategy reinforced by U.S. government’s plans for changes of kidney disease care
If no timeframe is specified, information refers to Q2/2019
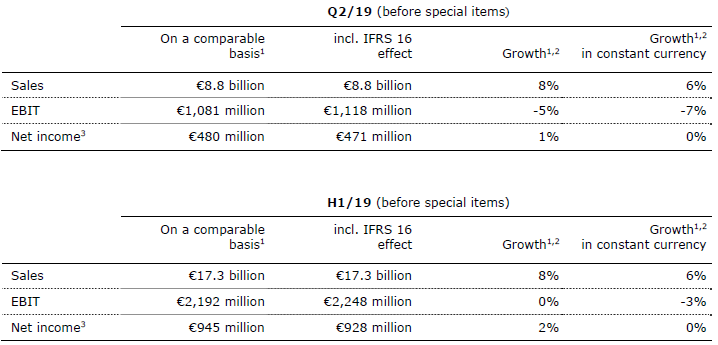
1 Adjusted for IFRS 16 effect
2 Q2/18 and H1/18 adjusted for divestitures of Care Coordination activities at Fresenius Medical Care (FMC)
3 Net income attributable to shareholders of Fresenius SE & Co. KGaA
For a detailed overview of special items and adjustments please see the reconciliation tables on pages 20-32 of the PDF document.
Group sales growth guidance for 2019 raised
Based on the Group’s good H1/19 results and good prospects for the remainder of the year, Fresenius raises its 2019 Group sales growth guidance. Fresenius now projects sales growth1 of 4% to 7% in constant currency. Previously, Fresenius expected sales growth1 of 3% to 6% in constant currency. The company confirms its earnings guidance. Net income2,3 growth is expected to be ~0% in constant currency. The guidance for 2019 includes the related sales and dilutive earnings contributions of the NxStage acquisition.
Fresenius expects net debt/EBITDA4 at year-end to be around the upper-end of the original self-imposed target corridor of 2.5x to 3.0x. This includes the NxStage acquisition which is increasing the net debt/EBITDA ratio in 2019 by ~30 basis points and excludes IFRS 16 effects.
Due to the adoption of the IFRS 16 accounting standard (“IFRS 16 effect”), Fresenius’ self-imposed target corridor has shifted to 3.0x to 3.5x net debt/EBITDA on a reported basis.
1 On a comparable basis: FY/18 base: €33,009 million; FY/18 adjusted for divestitures of Care Coordination activities at FMC (H1/18); FY/19: adjusted for IFRS 16 effect
2 Net income attributable to shareholders of Fresenius SE & Co. KGaA
3 On a comparable basis: FY/18 base: €1,872 million; FY/18 before special items and adjusted for divestitures of Care Coordination activities at FMC (H1/18); FY/19: before special items (transaction-related expenses, revaluations of biosimilars contingent liabilities, gain related to divestitures of Care Coordination activities at FMC, expenses associated with the cost optimization program at FMC), adjusted for IFRS 16 effect
4 Both net debt and EBITDA calculated at expected annual average exchange rates; excluding further potential acquisitions
For a detailed overview of special items and adjustments please see the reconciliation tables on pages 20-32 of the PDF document.
6% sales growth1 in constant currency
Group sales were €8,761 million including an IFRS 16 effect of -€18 million. Group sales1 on a comparable basis increased by 8% (6% in constant currency) to €8,779 million (Q2/18: €8,124 million). Organic sales growth was 5%. Acquisitions/divestitures contributed net 1% to growth. In H1/19, Group sales were €17,256 million including an IFRS 16 effect of -€40 million. Group sales1 on a comparable basis increased by 8% (6% in constant currency) to €17,296 million (H1/18: €15,994 million). Organic sales growth was 5%. Acquisitions/divestitures contributed net 1% to growth. Positive currency translation effects of 2% were mainly driven by the U.S. dollar strengthening against the euro.
Net income2,3 growth in constant currency
Group EBITDA before special items was €1,703 million including an IFRS 16 effect of €242 million. Group EBITDA2 on a comparable basis decreased by 2% (-5% in constant currency) to €1,461 million (Q2/18: €1,495 million). In H1/19, Group EBITDA before special items was €3,404 million including an IFRS 16 effect of €462 million. Group EBITDA2 on a comparable basis increased by 2% (-1% in constant currency) to €2,942 million (H1/18: €2,889 million).
Group EBIT before special items was €1,118 million including an IFRS 16 effect of €37 million. Group EBIT2 on a comparable basis decreased by 5% (-7% in constant currency) to €1,081 million (Q2/18: €1,135 million). The EBIT margin2 on a comparable basis was 12.3% (Q2/18: 14.0%). A significant contributor was the reduction in patient attribution and a decreasing savings rate for ESCOs, based on recent reports for prior plan years (“ESCO effect”). Reported Group EBIT4 was €1,118 million. In H1/19, Group EBIT before special items was €2,248 million including an IFRS 16 effect of €56 million. Group EBIT2 on a comparable basis remained at previous year’s level (-3% in constant currency) at €2,192 million (H1/18: €2,185 million). The EBIT margin2 on a comparable basis was 12.7% (H1/18: 13.7%). Reported Group EBIT4 was €2,233 million.
Group net interest before special items was -€180 million including an IFRS 16 effect of -€58 million. On a comparable basis, net interest2 improved to -€122 million (Q2/18: -€140 million) mainly due to successful refinancing activities and lower interest rates. Reported Group net interest4 was -€179 million. In H1/19, Group net interest before special items was -€361 million including an IFRS 16 effect of -€106 million. On a comparable basis, net interest1 improved to -€255 million (H1/18: -€279 million). Reported Group net interest3 was -€363 million.
1 On a comparable basis: Q2/18 and H1/18 adjusted for divestitures of Care Coordination activities at FMC;
Q2/19 and H1/19 adjusted for IFRS 16 effect
2 On a comparable basis: Q2/19 and H1/19 before special items and adjusted for IFRS 16 effect;
Q2/18 and H1/18 adjusted for divestitures of Care Coordination activities at FMC
3 Net income attributable to shareholders of Fresenius SE & Co. KGaA
4 After special items and including IFRS 16 effect
For a detailed overview of special items and adjustments please see the reconciliation tables on pages 20-32 of the PDF document.
The Group tax rate before special items and adopting IFRS 16 was 22.8%. Group tax rate1 on a comparable basis was 22.8% (Q2/18: 23.3%). In H1/19, the Group tax rate before special items and adopting IFRS 16 was 23.1%. In H1/19, Group tax rate1 on a comparable basis was 23.1% (H1/18: 22.1%).
Noncontrolling interest before special items was €253 million including an IFRS 16 effect of €7 million. Noncontrolling interest1 on a comparable basis was €260 million (Q2/18:
€290 million). In H1/19, Noncontrolling interest before special items was €524 million including an IFRS 16 effect of €20 million. Noncontrolling interest1 on a comparable basis was €544 million (H1/18: €560 million), of which 93% was attributable to the Noncontrolling interest in Fresenius Medical Care.
Group net income2 before special items was €471 million including an IFRS 16 effect of -€9 million. Group net income1,2 on a comparable basis increased by 1% (0% in constant currency) to €480 million (Q2/18: €473 million). Reported Group net income2,3 was €471 million. Earnings per share2 before special items were €0.85 including an IFRS 16 effect of -€0.01. Earnings per share1,2 on a comparable basis increased by 1% (0% in constant currency) to €0.86 (Q2/18: €0.85). Reported Earnings per share2,3 were €0.85.
In H1/19, Group net income2 before special items was €928 million including an IFRS 16 effect of -€17 million. Group net income1,2 on a comparable basis increased by 2% (0% in constant currency) to €945 million (H1/18: €924 million). Reported Group net income2,3 was €924 million. In H1/19, Earnings per share2 before special items were €1.67 including an IFRS 16 effect of -€0.03. Earnings per share1,2 on a comparable basis increased by 2% (0% in constant currency) to €1.70 (H1/18: €1.66). Reported Earnings per share2,3 were €1.66.
Continued investment in growth
2019 is an investment year for the Fresenius Group. Fresenius is making good progress in all of its investment initiatives to secure long-term sustainable growth. Spending on property, plant and equipment was €565 million (Q2/18: €451 million). This corresponds to 6% of sales. In H1/19, spending on property, plant and equipment was €1,006 million (H1/18: €831 million), primarily for the modernization and expansion of dialysis clinics, production facilities as well as hospitals and day clinics. This corresponds to 6% of sales.
Total acquisition spending was €234 million (Q2/18: €194 million) including the acquisition of Clínica Medellín in Colombia by Fresenius Helios, among others. In H1/19, total acquisition spending was €2,157 million (H1/18: €386 million), mainly for the acquisition of NxStage by Fresenius Medical Care.
1 On a comparable basis: Q2/19 and H1/19 before special items and adjusted for IFRS 16 effect;
Q2/18 and H1/18 adjusted for divestitures of Care Coordination activities at FMC
2 Net income attributable to shareholders of Fresenius SE & Co. KGaA
3 After special items and including IFRS 16 effect
Cash flow development
Group operating cash flow was €1,205 million including an IFRS 16 effect of €182 million. On a comparable basis, Group operating cash flow was €1,023 million (Q2/18: €1,020 million) with a margin of 11.7% (Q2/18: 12.2%). Free cash flow before acquisitions and dividends adjusted for IFRS 16 was €467 million (Q2/18: €580 million). Free cash flow after acquisitions and dividends adjusted for IFRS 16 was -€437 million (Q2/18: €1,331 million). The IFRS 16 effect amounts to €182 million respectively. Correspondingly, cash flow from financing activities decreased by €182 million.
In H1/19, Group operating cash flow was €1,494 million including an IFRS 16 effect of €353 million. On a comparable basis, Group operating cash flow was €1,141 million (H1/18: €1,256 million) with a margin of 6.6% (H1/18: 7.6%). Free cash flow before acquisitions and dividends adjusted for IFRS 16 was €128 million (H1/18: €425 million) mainly due to increasing investments. Free cash flow after acquisitions and dividends adjusted for IFRS 16 was -€2,719 million (H1/18: €942 million). The IFRS 16 effect amounts to €353 million respectively. Correspondingly, cash flow from financing activities decreased by €353 million.
Solid balance sheet structure
The Group’s total assets were €64,929 million including an IFRS 16 effect of €5,587 million. Adjusted for IFRS 16, Group total assets1 increased by 5% (4% in constant currency) to €59,342 million (Dec. 31, 2018: €56,703 million). Current assets1 remained flat (remained flat in constant currency) to €14,851 million (Dec. 31, 2018: €14,790 million). Non-current assets1 increased by 6% (6% in constant currency) to €44,491 million (Dec. 31, 2018: € 41,913 million).
Total shareholders’ equity was €25,382 million including an IFRS 16 effect of -€186 million. Adjusted for IFRS 16, total shareholders’ equity increased by 2% (2% in constant currency) to €25,568 million (Dec. 31, 2018: €25,008 million). The equity ratio was 39.1%. Adjusted for IFRS 16, the equity ratio was 43.1% (Dec. 31, 2018: 44.1%).
Group debt was €26,879 million including an IFRS 16 effect of €5,773 million. Adjusted for IFRS 16, Group debt increased by 11% to €21,106 million (11% in constant currency) (Dec. 31, 2018: € 18,984 million). Group net debt was €25,416 million including an IFRS 16 effect of €5,773 million. Adjusted for IFRS 16, Group net debt increased by 21% (21% in constant currency) to € 19,643 million (Dec. 31, 2018: € 16,275 million) mainly due to the acquisition of NxStage by Fresenius Medical Care.
As of June 30, 2019, the net debt/EBITDA ratio increased to 3.21x1,2,3,4 (December 31, 2018: 2.71x2,4). Including the IFRS 16 effect, the reported net debt/EBITDA ratio increased to 3.64x2,3,4.
1 Adjusted for IFRS 16 effect
2 At LTM average exchange rates for both net debt and EBITDA; pro forma closed acquisitions/divestitures
3 Including acquisition of NxStage
4 Before special items
For a detailed overview of special items and adjustments please see the reconciliation tables on pages 20-32.
Business Segments
Fresenius Medical Care (Figures according to Fresenius Medical Care press release)
Fresenius Medical Care is the world's largest provider of products and services for individuals with renal diseases. As of June 30, 2019, Fresenius Medical Care was treating 339,550 patients in 3,996 dialysis clinics. Along with its core business, the company provides related medical services in the field of Care Coordination.
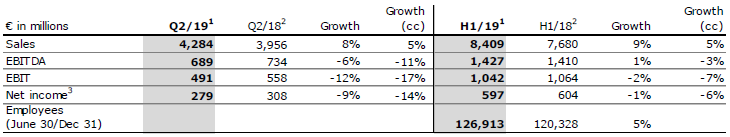
- 5% sales1,2 growth in constant currency
- Underlying dialysis business development as expected; negative impact from ESCO adjustments for prior plan years
- FY/19 outlook confirmed
Adjusted for the Q2/18 contribution from the divested Care Coordination activities, the IFRS 16 effect and the contribution from NxStage, sales of Fresenius Medical Care increased by 8% (5% at constant currency) to €4,284 million (Q2/18: €3,956 million). Organic sales growth was 4%. Positive currency translation effects of 3% were mainly related to the U.S. dollar strengthening against the euro. In H1/19, sales adjusted for the H1/18 contribution from the divested Care Coordination activities, the IFRS 16 effect and the contribution from NxStage increased by 9% (5% at constant currency) to €8,409 million (H1/18: €7,680 million). Organic sales growth was 5%.
EBIT4 decreased by 12% (-17% in constant currency) to €491 million (Q2/19: €558 million) The EBIT margin4 decreased to 11.5% (Q2/18: 14.1%). A significant contributor was the reduction in patient attribution and a decreasing savings rate for ESCOs, based on recent reports for prior plan years (“ESCO effect”).
1 On an adjusted basis: before special items (transaction-related expenses, gain related to divestitures of Care Coordination activities, expenses associated with the cost optimization program), adjusted for IFRS 16 effect, excluding effects from NxStage transaction
2 Q2/18 and H1/18 adjusted for divestitures of Care Coordination activities
3 Net income attributable to shareholders of Fresenius Medical Care AG & Co. KGaA
4 Q2/18 and H1/18 before special items and after adjustments; Q2/19 and H1/19 before special items (transaction-related expenses, gain related to divestitures of Care Coordination activities, expenses associated with the cost optimization program), adjusted for IFRS 16 effect, excluding effects from NxStage transaction
For a detailed overview of special items and adjustments please see the reconciliation tables on pages 20-32.
In H1/19, EBIT6 decreased by 2% (-7% in constant currency) to €1,042 million (H1/18: €1,064 million). The EBIT margin4 decreased to 12.4% (H1/18: 13.9%).
Net income1,2 decreased by 9% (-14% in constant currency) to €279 million (Q2/18: €308 million). A significant contributor was the ESCO effect. In H1/19, net income1,2 decreased by 1% (-6% in constant currency) to €597 million (H1/18: €604 million).
Operating cash flow was €700 million3 (Q2/18: €656 million) with a margin of 16.0% (Q2/18: 15.6%). In H1/19, operating cash flow was €635 million (H1/18: €611 million) with a margin of 7.6% (H1/18: 7.5%).
For FY/19, Fresenius Medical Care expects adjusted sales to grow by 3% to 7%5,6 in constant currency. Adjusted net income1 is expected to develop in the range of -2% to +2%5,7 in constant currency.
For further information on the IFRS 16 reconciliation of Fresenius Medical Care, please see page 18 in the PDF document.
For further information, please see Fresenius Medical Care’s press release at www.freseniusmedicalcare.com.
1 Net income attributable to shareholders of Fresenius Medical Care AG & Co. KGaA
2 Q2/18 and H1/18 before special items and after adjustments; Q2/19 and H1/19 before special items (transaction-related expenses, gain related to divestitures of care coordination activities, expenses associated with the cost optimization program), adjusted for IFRS 16 effect, excluding effects from NxStage transaction
3 €852 million including an IFRS 16 effect of €152 million
4 €928 million including an IFRS 16 effect of €293 million
5 FY/18 before special items, Q2/18 and H1/18 adjusted for divestitures of Care Coordination activities;
FY/19 before special items (transaction-related expenses, gain related to divestitures of care coordination activities, expenses associated with the cost optimization program), adjusted for IFRS 16 effects, excluding effects from NxStage transaction
6 FY/18 base: €16,026 million
7 FY/18 base: €1,341 million
For a detailed overview of special items and adjustments please see the reconciliation tables on pages 20-32 in the PDF document.
Fresenius Kabi
Fresenius Kabi offers intravenously administered generic drugs, clinical nutrition and infusion therapies for seriously and chronically ill patients in the hospital and outpatient environments. The company is also a leading supplier of medical devices and transfusion technology products. In the biosimilars business, Fresenius Kabi develops products with a focus on oncology and autoimmune diseases.
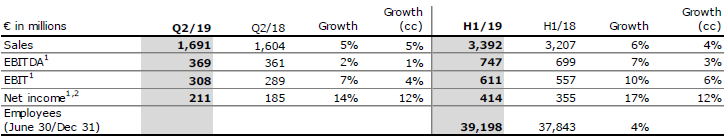
- 4% organic sales growth and 4% EBIT1 growth in constant currency
- Excellent growth in Emerging Markets
- FY/19 outlook confirmed
Sales of Fresenius Kabi increased by 5% (5% in constant currency) to €1,691 million (Q2/18: €1,604 million). Organic sales growth was 4%. In H1/19, sales increased by 6% (4% in constant currency) to €3,392 million (H1/18: €3,207 million). Organic sales growth was 4%. Positive currency translation effects of 2% were mainly related to the U.S. dollar strengthening against the euro.
Sales in North America increased by 4% (organic growth: -1%) to €573 million (Q2/18: €549 million). In H1/19, sales in North America increased by 5% (organic growth:
-1%) to €1,196 million (H1/18: €1,140 million). The anticipated easing of shortage situations, intensified competition in individual molecules, and a prescribing trend towards non-opioids pain management were the main headwinds.
Sales in Europe grew by 2% (organic growth: 1%) to €572 million (Q2/18: €563 million). In H1/19, sales in Europe increased by 2% (organic growth: 2%) to €1,145 million (H1/18: €1,120 million).
Sales in Asia-Pacific increased by 15% (organic growth: 15%) to €374 million (Q2/18: €326 million). In H1/19, sales in Asia-Pacific increased by 14% (organic growth: 13%) to €715 million (H1/18: €627 million).
Sales in Latin America/Africa increased by 4% (organic growth: 13%) to €172 million (Q2/18: €166 million). In H1/19, sales in Latin America/Africa increased by 5% (organic growth: 15%) to €336 million (H1/18: €320 million).
EBIT1 increased by 7% (4% in constant currency) to €308 million (Q2/18: €289 million) with an EBIT margin1 of 18.2% (Q2/18: 18.0%). In H1/19, EBIT1 increased by 10% (6% in constant currency) to €611 million (H1/18: €557 million) with an EBIT margin1 of 18.0% (H1/18: 17.4%).
Net income1,2 increased by 14% (12% in constant currency) to €211 million (Q2/18: €185 million). In H1/19, net income1,2 increased by 17% (12% in constant currency) to €414 million (H1/18: €355 million).
Operating cash flow3 was €201 million (Q2/18: €228 million). The cash flow margin was 11.9% (Q2/18: 14.2%). In H1/19, operating cash flow3 was €333 million (H1/18: €454 million). The cash flow margin was 9.8% (H1/18: 14.2%).
Fresenius Kabi confirms its outlook for FY/19 and expects organic sales growth4 of 3% to 6% and EBIT growth5 in constant currency of 3% to 6%.
For further information on the IFRS 16 reconciliation of Fresenius Kabi, please see page 18 of the PDF document.
1 On a comparable basis: before special items and adjusted for IFRS 16 effect
2 Net income attributable to shareholders of Fresenius SE & Co. KGaA
3 Adjusted for IFRS 16 effect (operating cash flow after special items)
4 On a comparable basis: FY/18 base: €6,544 million; FY/19 before special items (acquisition-related expenses, revaluations of biosimilars contingent liabilities) and adjusted for IFRS 16 effect
5 On a comparable basis: FY/18 base: €1,139 million; FY/18 before special items; FY/19 before special items (acquisition-related expenses, revaluations of biosimilars contingent liabilities) and adjusted for IFRS 16 effect.
For a detailed overview of special items and adjustments please see the reconciliation tables on pages 20-32 of the PDF document.
Fresenius Helios
Fresenius Helios is Europe's leading private hospital operator. The company comprises Helios Germany and Helios Spain (Quirónsalud). Helios Germany operates 86 hospitals, ~125 outpatient centers and treats approximately 5.3 million patients annually. Quirónsalud operates 50 hospitals, 62 outpatient centers and around 300 occupational risk prevention centers, and treats approximately 13.3 million patients annually.
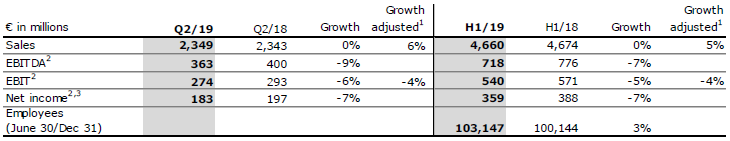
- Strong organic sales growth of 5%
- Helios Germany further stabilized; Helios Spain with solid growth despite Easter effect
- FY/19 outlook confirmed
Sales of Fresenius Helios remained at previous year’s level (increased by 6%1 organic growth: 5%) to €2,349 million (Q2/18: €2,343 million). In H1/19, sales also remained at previous year’s level (increased by 5%1; organic growth: 4%) to €4,660 million (H1/18: €4,674 million).
Sales of Helios Germany decreased by 3% (increased by 5%1; organic growth: 5%) to €1,506 million (Q2/18: €1,547 million). Organic sales growth was positively influenced by pricing effects and a strong case mix. In H1/19, sales of Helios Germany decreased by 4% (increased by 3%1; organic growth: 3%) to €2,991 million (H1/18: €3,121 million).
Sales of Helios Spain increased by 6% (organic growth: 4%) to €842 million (Q2/18: €796 million) despite the negative effect related to the Easter holidays. In H1/19, sales of Helios Spain increased by 7% (organic growth: 6%) to €1,668 million (H1/18: €1,553 million).
1 Adjusted for the post-acute care business transferred to Fresenius Vamed as of July 1, 2018
2 Adjusted for IFRS 16 effect
3 Net income attributable to shareholders of Fresenius SE & Co. KGaA
For a detailed overview of special items and adjustments please see the reconciliation tables on pages 20-32 of the PDF document.
EBIT1 of Fresenius Helios decreased by 6% (-4% ) to €274 million (Q2/18: €293 million) with an EBIT margin of 11.7% (Q2/18: 12.5%). In H1/19, EBIT1 of Fresenius Helios decreased by 5% (-4%2) to €540 million (H1/18: €571 million) with an EBIT margin of 11.6% (H1/18: 12.2%).
EBIT1 of Helios Germany decreased by 8% (-4%2) to €154 million (Q2/18: €168 million) with an EBIT margin of 10.2% (Q2/18: 10.9%). In H1/19, EBIT1 of Helios Germany decreased by 12% (-10%2) to €303 million (H1/18: €345 million) with an EBIT margin of 10.1% (H1/18: 11.1%). Whilst EBIT and margin have further stabilized, investments for preparatory structural measures continue to weigh on Helios Germany’s financial performance.
Despite the negative Easter effect, EBIT1 of Helios Spain increased by 1% to €125 million (Q2/18: €124 million) with an EBIT margin of 14.8% (Q2/18: 15.6%). In H1/19, EBIT1 of Helios Spain increased by 7% to €244 million (H1/18: €227 million).
Net income1,3 decreased by 7% to €183 million (Q2/18: €197 million). In H1/19, net income1,3 also decreased by 7% to €359 million (H1/18: €388 million).
Operating cash flow1 was €197 million (Q2/18: €162 million) with a margin of 8.4% (Q2/18: 6.9%). In H1/19, operating cash flow1 was €288 million (H1/18: €259 million) with a margin of 6.2% (H1/18: 5.5%). The increase is mainly attributable to the decrease in days sales outstanding (DSO) at Helios Spain.
Fresenius Helios confirms its outlook for FY/19 and expects organic sales growth of 2% to 5% and an EBIT1 growth of -5% to -2%.
For further information on the IFRS 16 reconciliation of Fresenius Helios, please see page 18.
1 Adjusted for IFRS 16 effect
2 Adjusted for the post-acute care business transferred to Fresenius Vamed as of July 1, 2018
3 Net income attributable to shareholders of Fresenius SE & Co. KGaA
For a detailed overview of special items and adjustments please see the reconciliation tables on pages 20-32 of the PDF document.
Fresenius Vamed
Fresenius Vamed manages projects and provides services for hospitals and other health care facilities worldwide and is a leading post-acute care provider in Central Europe. The portfolio ranges along the entire value chain: from project development, planning, and turnkey construction, via maintenance and technical management to total operational management.
- Very strong organic sales growth of 27%
- Intensified collaboration with Fresenius Helios contributes to sales growth
- FY/19 outlook confirmed
Sales of Fresenius Vamed increased by 76% (31%1) to €467 million (Q2/18: €266 million). Organic sales growth was 27%, acquisitions contributed 3%1 to growth. Positive currency translation effects increased sales by 1%. Sales in the service business grew by 106% (35%1) to €344 million (Q2/18: €167 million), supported by an intensified collaboration with Fresenius Helios. Sales of the project business increased by 24% to €123 million (Q2/18: €99 million). In H1/19, sales increased by 76% (32%1) to €907 million (H1/18: €515 million). Organic sales growth was 29%, acquisitions contributed 3%1 to growth. Both the service and the project business showed strong growth momentum.
EBIT2 increased by 67% to €20 million (Q2/18: €12 million) with an EBIT margin of 4.3% (Q2/18: 4.5%). EBIT2 additionally adjusted for the acquisition of Helios’ German post-acute care business was €8 million (-33% YoY) with an EBIT margin of 2.3% - the decrease was mainly driven by phasing effects in the project business. In H1/19, EBIT2 increased by 72% to €31 million (H1/18: €18 million) with an EBIT margin of 3.4% (H1/18: 3.5%). EBIT2 additionally adjusted for the acquisition of Helios’ German post-acute care business was €15 million (-17% YoY) with an EBIT margin of 2.2%.
Net income2,3 increased by 86% to €13 million (Q2/18: €7 million). In H1/19, net income2,3 increased by 73% to €19 million (H1/18: €11 million).
Order intake decreased by -41% to €115 million (Q2/18: €195 million) but increased by 9% to €498 million in H1/19 (H1/18: €455 million). As of June 30, 2019, order backlog was at €2,690 million (Dec 31, 2018: €2,420 million).
Operating cash flow2 decreased to -€42 million (Q2/18: -€14 million) with a margin of -9.0% (Q2/18: -5.3%). In H1/19, Operating cash flow2 decreased to -€65 million (H1/18:
-€56 million) with a margin of -7.2% (H1/18: -10.9%).
Fresenius Vamed confirms its outlook for FY/19 and expects organic sales growth of ~10% and EBIT growth2 of 15% to 20%.
For further information on the IFRS 16 reconciliation of Fresenius Vamed, please see page 18 of the PDF document.
1 Adjusted for German post-acute care business acquired from Fresenius Helios as of July 1, 2018
2 Adjusted for IFRS 16 effect
3 Net income attributable to shareholders of VAMED AG
For a detailed overview of special items and adjustments please see the reconciliation tables on pages 20-32 of the PDF document.
Conference Call
As part of the publication of the results for the second quarter / first half of 2019, a conference call will be held on July 30, 2019 at 1:30 p.m. CEDT (7:30 a.m. EDT). All investors are cordially invited to follow the conference call in a live broadcast over the Internet at www.fresenius.com/investors. Following the call, a replay will be available on our website.
For additional information on the performance indicators used please refer to our website www.fresenius.com/alternative-performance-measures.
This release contains forward-looking statements that are subject to various risks and uncertainties. Future results could differ materially from those described in these forward-looking statements due to certain factors, e.g. changes in business, economic and competitive conditions, regulatory reforms, results of clinical trials, foreign exchange rate fluctuations, uncertainties in litigation or investigative proceedings, and the availability of financing. Fresenius does not undertake any responsibility to update the forward-looking statements in this release.