

- Group organic revenue growth of 9%1,2 to €5.3 billion2 driven by a strong Kabi performance and good organic growth at Helios.
- Strong bottom-line traction with Group EBIT2 increase in constant currency of 9%3 to €552 million and EPS growth of 7%2,3,4.
- Group outlook for fiscal 2024 upgraded; Organic revenue growth1,2 is now expected to grow between 6% to 8% (previous: between 4% to 7%) and EBIT growth2 in constant currency is now targeted to be in the 8 to 11% range (previous: between 6% to 10%).
- Group-wide cost and productivity savings ahead of plan with target for FY/24 already achieved YTD.
- Excellent operating cash flow resulting from focused cash management.
- Deleveraging continued, and leverage ratio further improved to 3.24x2,5 driven by excellent cash flow; Leverage target corridor under review.
- Fresenius Kabi delivering above the top-end of the structural growth band with organic revenue growth of 11%6; strong EBIT margin at 15.9%2.
- Growth Vectors at Kabi show continued strong performance, led by dynamic growth at Biopharma, which had yet again positive EBIT in Q3. Tyenne is in line with expectations, building on strong momentum.
- Fresenius Helios with excellent organic revenue growth of 8% driven by solid performance in Spain and supported by some favorable technical reclassifications in Germany; EBIT margin of 7.9%2 in line with expectations due to anticipated lower seasonal demand in Spain; last quarter of energy relief funding support.
- Dedicated Helios performance program underway to drive further operational excellence and compensate ending energy relief funding in Germany.
Michael Sen, CEO of Fresenius: Team Fresenius delivered an excellent third quarter in 2024 – all financial metrics improved versus the prior year. Revenues grew strongly, with margin expansion across the Group, and significantly improved cash flow generation. Both Kabi and Helios continue to deliver consistent and sustained financial performance. We are more focused and stronger, deploying our cash to reduce debt further, while growing earnings per share and driving shareholder returns. Quarter after quarter we are showing how our #FutureFresenius strategy is paying off. Our mission remains at the core of our activities: saving and improving human lives. Fresenius is: Committed to Life.” Sen continued, “Given the strength of our first nine months, we are upgrading our revenue and earnings guidance for the year.”
1 Organic growth rate adjusted for accounting effects related to Argentina hyperinflation.
2 Before special items
3 Growth rate adjusted for Argentina hyperinflation
4 Excluding Fresenius Medical Care
5 At average exchange rates for both net debt and EBITDA; pro forma closed acquisitions/divestitures, including lease liabilities, including Fresenius Medical Care dividend
6 Organic growth rate adjusted for the accounting effects related to Argentina hyperinflation.
Conference call and Audio webcast
As part of the publication of the results for Q3/24, a conference call will be held on November 6, 2024 at 1:30 p.m. CET (7:30 a.m. EST). All investors are cordially invited to follow the conference call in a live audio webcast at www.fresenius.com/investors. Following the call, a replay will be available on
our website.
Note on the presentation of financial figures
An overview of the presentation of the financial figures are available on page 14 of this Investor News.
Structural productivity improvements: Target achieved ahead of plan
The Group-wide cost and efficiency measures are progressing faster than planned. The target for annual sustainable cost savings of ~€400 million at EBIT level has already been achieved with accumulative savings totaling €408 million until the end of Q3/24. Originally, it was expected to achieve the target by year-end 2025.
Fresenius will continue its efforts to increase structural productivity. So far, Kabi has delivered the majority of the savings. Going forward, it will be Fresenius Helios with its dedicated efficiency program focused on operations excellence including reduction of process and waiting times and digitalization of processes, resource optimization and synergies in particular in logistics and procurement. An update will be provided as part of the FY/24 results in February 2025.
Further efforts to enhance structural efficiency will, however, also be driven forward by Fresenius Kabi and the Corporate Center. Key elements include measures to reduce complexity, optimize supply chains and improve procurement processes.
Group sales and earnings development

Group revenue before special items increased by 7% (9% in constant currency) to €5,303 million (Q3/23: €4,967 million). Organic growth was 9%2, driven by Kabi and Helios's ongoing strong performance. Currency translation had a negative effect of 2% on revenue growth.
Group EBITDA before special items increased by 4% (5% in constant currency) to €814 million (Q3/23: €783 million).
Group EBIT before special items increased by 8% (9% in constant currency) to €552 million (Q3/23: €509 million), mainly driven by the strong organic revenue growth at Kabi and Helios and the continued progress of the groupwide cost savings program. The EBIT margin before special items was 10.4% (Q3/23: 10.2%). Reported Group EBIT was €492 million (Q3/23: €362 million).
Group net interest before special items increased to -€116 million (Q3/23: -€102 million) mainly due to financing activities in a higher interest rate environment.
Group tax rate before special items was 24.5% (Q3/23: 23.1%).
1 Before special items
2 Organic growth rate adjusted for accounting effects related to Argentina hyperinflation
3 Net income attributable to shareholders of Fresenius SE & Co. KGaA
Constant currency growth rates adjusted for Argentina hyperinflation. Financial figures and growth rates adjusted for the divestment of the fertility services group Eugin and the hospital stake in Peru.
Net income1 from deconsolidated Fresenius Medical Care operations before special items increased by 38% (42% in constant currency) to €76 million (Q3/231: €55 million).
Group net income1 before special items increased by 12% (13% in constant currency) to €388 million (Q3/231: €347 million). The increase was driven by operating strength. Reported Group net income1 increased to €326 million (Q3/231: -€406 million) mainly due to Fresenius Medical Care's positive net income contribution. The negative net income in the prior year period was due to the non-cash valuation effect of Fresenius Medical Care in accordance with IFRS 5.
Group net income1 before special items excluding Medical Care increased by 7% (7% in constant currency) to €312 million (Q3/231: €292 million).
Earnings per share1 before special items increased by 12% (13% in constant currency) to €0.69 (Q3/231: €0.62). Reported earnings per share1 were €0.58 (Q3/231: -€0.72).
1Net income attributable to shareholders of Fresenius SE & Co. KGaA
Constant currency growth rates adjusted for Argentina hyperinflation. Financial figures and growth rates adjusted for the divestment of the fertility services group Eugin and the hospital stake in Peru.
For a detailed overview of special items please see the reconciliation tables at
Financial Results | FSE (fresenius.com).
Group Cash flow development
Group operating cash flow (continuing operations) increased to €763 million (Q3/23: €603 million) mainly driven by the very good operational business development and improvements in working capital at Helios and Kabi. Group operating cash flow margin was 14.4% (Q3/23: 12.1%). Before acquisitions, dividends and lease liabilities, free cash flow (continuing operations) increased to €532 million (Q3/23: €346 million). After acquisitions, dividends and lease liabilities, free cash flow (continuing operations) improved to €623 million (Q3/23: €102 million).
Fresenius Kabi’s operating cash flow remained almost stable at €374 million (Q3/23: €380 million) with a margin of 17.7% (Q3/23: 18.8%).
Fresenius Helios’ operating cash flow increased to €454 million (Q3/23: €208 million) due to the strong focus on cash and working capital management in Germany and Spain. The operating cash flow margin improved to 14.7% (Q3/23: 7.3%).
The cash conversion rate (CCR), which is defined as the ratio of adjusted free cash flow1 to EBIT before special items was 1.2 in Q3/24 (LTM) (Q3/23: 0.9, LTM). This positive development is due to the strong cash flow focus across the Group.
The CCR is expected to be around 1 in FY/24.
1Cash flow before acquisitions and dividends; before interest, tax, and special items
Group leverage
Group debt decreased by -16% (-16% in constant currency) to €13,317 million
(Dec. 31, 2023: € 15,830 million) mainly related to the repayment of debt based on the excellent cash flow development and the around €400 million reduction of the leasing liabilities related to the Vamed exit. Group net debt decreased by -11%
(-11% in constant currency) to € 11,823 million (Dec. 31, 2023: € 13,268 million).
As of September 30, 2024, the net debt/EBITDA ratio was 3.24x1,2 (Dec. 31, 2023: 3.76x1,2) corresponding to a reduction of 52 bps compared to Dec. 31, 2023. This achievement is due to a combination of better EBITDA and Free cash flow. The legally required suspension of dividend payments and the Vamed exit further supported the positive development. Compared to Q3/23 (4.03x1,2) this is a 79 bps reduction.
Fresenius anticipates improving net debt/EBITDA ratio further3 towards the lower end of the self-imposed corridor of 3.0 to 3.5x by year-end 2024. This is expected to be driven by further reducing net debt and operational performance of the Operating Companies.
ROIC was 6.1% in Q1-3/24 (FY/23: 5.2%) mainly driven by the improvement in EBIT and the stringent capital allocation. With that, ROIC is within the ambition range of 6% to 8%. For 2024, Fresenius expects ROIC to be above 6.0% (previous: around 6.0%).
1 At average exchange rates for both net debt and EBITDA; pro forma closed acquisitions/divestitures, including lease liabilities, including Fresenius Medical Care dividend
2 Before special items
3 At expected average exchange rates for both net debt and EBITDA; pro forma closed acquisitions/divestitures; excluding further potential acquisitions/divestitures; before special items; including lease liabilities, including Fresenius Medical Care dividend
For a detailed overview of special items please see the reconciliation tables at
Financial Results | FSE (fresenius.com).
Operating Company Fresenius Kabi

Revenue increased by 5% (10% constant currency) to €2,114 million (Q3/23: €2,021 million). Organic growth was 11%1. This performance was driven by positive pricing effects, particularly in Argentina, and the excellent operating performance of the Growth Vectors.
Revenue of the Growth Vectors (MedTech, Nutrition and Biopharma) increased by 9% (16% in constant currency) to €1,158 million (Q3/23: €1,067 million). Organic growth was excellent at 16%1.
In Nutrition, organic growth of 11%1 benefited from positive pricing effects in Argentina and the good development in the US, driven by the ongoing roll-out of lipid emulsions. China continued to be impacted by a general economic weakness, price declines in connection with tenders, and indirect effects of the government’s countrywide anti-corruption campaign. Biopharma showed excellent organic growth of 66%1 driven by the overall good Biosimilars rollout in Europe and the U.S., with Tyenne standing out. Moreover, mAbxience also performed strongly, driven by bevacizumab and milestone payments. In MedTech, organic growth was of 7%1 driven by a broad-based positive development in the US, Europe and International, reflecting strong performances for infusion and nutrition systems.
1 Organic growth rate adjusted for accounting effects related to Argentina hyperinflation.
2 Before special items
Constant currency growth rates adjusted for Argentina hyperinflation.
For a detailed overview of special items please see the reconciliation tables at
Financial Results | FSE (fresenius.com).
Revenue in the Pharma (IV Drugs & Fluids) business increased by 2% (3% in constant currency; organic growth: 6% ) and amounted to €957 million (Q3/23: €941 million). Organic growth was mainly driven by a strong performance in Europe and International and solid growth in the U.S., driven by an improved backorder situation, compensating the softer development in China.
EBIT2 of Fresenius Kabi increased by 16% (16% in constant currency) to €335 million (Q3/23: €289 million) mainly due to the good revenue development, the positive EBIT result of the Biopharma business, and ongoing progress of the cost saving initiatives. EBIT margin2 was 15.9% (Q3/23: 14.3%) and thus at the upper end of 2024 outlook.
EBIT2 of the Growth Vectors increased by 62% (constant currency: 53%) to €168 million (Q3/23: €104 million) due to the positive EBIT of the Biopharma business and the good revenue development. EBIT margin2 was 14.5% (Q3/23: 9.8%). The Biopharma business is now expected to be EBIT break even also in the FY/24.
EBIT2 in the Pharma business decreased by -9% (constant currency: -8%) to €182 million (Q3/23: €200 million) primarily driven by additional costs due to the start of production at the main US plants in Wilson and Melrose Park. EBIT margin2 was 19.0% (Q3/23: 21.3%).
1 Organic growth rate adjusted for accounting effects related to Argentina hyperinflation.
2 Before special items
Constant currency growth rates adjusted for Argentina hyperinflation.
For a detailed overview of special items please see the reconciliation tables at
Financial Results | FSE (fresenius.com).
Operating Company Fresenius Helios

Revenue before special items increased by 8% (8% in constant currency) to €3,082 million (Q3/23: €2,863 million). Organic growth was 8%.
Revenue of Helios Germany increased by 8% (in constant currency: 8%) to €1,940 million (Q3/23: €1,800 million) due to pricing effects coupled with volume growth and supported by some favourable technical reclassifications. Organic growth was 8%.
Revenue of Helios Spain before special items increased by 8% (8% in constant currency) to €1,142 million (Q3/23: €1,062 million) driven by solid activity levels despite the anticipated lower seasonal demand, and favourable price effects. Organic growth was 8%. The clinics in Latin America also showed a good performance, additionally supported by currency exchange rate effects.
EBIT1 of Fresenius Helios increased by 7% (6% in constant currency) to €244 million (Q3/23: €229 million) with an EBIT margin1 of 7.9% (Q3/23: 8.0%).
EBIT1 of Helios Germany increased by 8% to €170 million (Q3/23: €157 million) with an EBIT margin1 of 8.8% (Q3/23: 8.7%). Q3/24 marked the last quarter in which energy relief funding was recognized in the income statement supporting profitability.
EBIT1 of Helios Spain decreased by -3% (0% in constant currency) to €73 million (Q3/23: €75 million) due to the expected seasonal softness and some phasing effects. The EBIT margin1 was 6.4% (Q3/23: 7.1%). On a more comparable nine-months basis, the EBIT margin1 was 11.2% (Q1-3/23: 11.2%).
1 Before special items
Financial figures and growth rates adjusted for the divestment of the fertility services group Eugin and the hospital stake in Peru.
For a detailed overview of special items please see the reconciliation tables at
Financial Results | FSE (fresenius.com).
Implications of the Fresenius Vamed exit
As of Q2 2024, Vamed is no longer a reporting segment of Fresenius. The company’s High-End-Services (HES) which offers services for Fresenius Helios and other hospitals, is included under Corporate / Other in the Group consolidated segment reporting.
In Q1-3/24, the divestment of the rehabilitation business and the Vamed operations in Austria led to non-cash special items of €406 million at Group net income level.
Special items related to the gradual scale back of the international project business amounted to €441 million at Group EBIT level in Q1-3/24, and to €357 million2 at Group net income level. A total amount of high triple-digit million euros of special items is expected, which is spread over the next few years and will be mostly cash-effective.
1 Before special items
2 According to ownership share
Financial figures and growth rates adjusted for the divestment of the fertility services group Eugin and the hospital stake in Peru.
For a detailed overview of special items please see the reconciliation tables at
Financial Results | FSE (fresenius.com).
Group and segment outlook for 20241
Fresenius upgrades its outlook for FY/24. Based on the excellent first nine months of 2024, Group organic revenue growth2,4,5 is now expected to grow between
6% to 8% (previous: between 4% to 7%) in 2024 and Group constant currency EBIT3,4 is anticipated to grow in a 8% to 11% range (previous: between 6% to 10%).
Fresenius Kabi expects organic revenue growth5 in a mid-to high-single-digit percentage range in 2024. The EBIT margin4 is expected to be in a range of 15% to 16% (structural margin band: 14% to 17%).
Fresenius Helios expects organic revenue4 to grow in mid-single digit percentage range in 2024. The EBIT margin4 is expected to be within 10% to 11% (structural margin band: 10% to 12%).
The Group outlook is given without Fresenius Vamed, i.e. exclusively for the Operating Companies Fresenius Kabi and Fresenius Helios.
1 For the prior-year basis please see table “Basis for Guidance for 2024”
2 2023 base: €20,307 million
3 2023 base: €2,266 million
4 Before special items
5 Organic growth rate adjusted for accounting effects related to Argentina hyperinflation.
Basis for Guidance for 2024

If no timeframe is specified, information refers to Q3/2024.
An overview of the results for Q3/2024 - before and after special items – is available on our website.
Consolidated results for Q3/24 as well as for Q3/23 include special items. These concern: divestment of the fertility services group Eugin and the hospital stake in Peru, Vamed exit, expenses associated with the Fresenius cost and efficiency program, transaction costs for mAbxience and Ivenix, costs in relation to the change of legal form of Fresenius Medical Care, legacy portfolio adjustments, IT transformation, transformation/exit Vamed, discontinued operations Vamed, special items at Fresenius Medical Care, and impact of PPA due to the application of the equity method to the Fresenius Medical Care investment. The special items shown within the reconciliation tables are reported in the Corporate/Other segment.
Note on the deconsolidation of Fresenius Medical Care
Following the deconsolidation of Fresenius Medical Care, Group financial figures are presented in accordance with IAS 28 (at equity method) since December 1, 2023. The proportionate share of 32% of Fresenius Medical Care is presented as a separate line in Fresenius Group’s P&L and balance sheet. Dividends received from Fresenius Medical Care are reported as a separate line as part of the cash flow statement. Moreover, IAS 28 requires a full purchase price allocation (PPA). The accounting for the PPA is treated as special item. For reasons of simplification and comparability, Fresenius presents net income with and without Fresenius Medical Care`s equity result.
Note on the portfolio optimization at Fresenius Helios
As part of the portfolio optimization, the sale of the fertility services group Eugin was completed on January 31, 2024. The divestment of the majority stake in the hospital Clínica Ricardo Palma hospital in Lima, Peru, was completed on April 23, 2024. Therefore, results of Fresenius Helios and accordingly of the Fresenius Group for Q3/24 and Q3/23 are adjusted.
Note on the growth rates Fresenius Kabi
Growth rates in constant currency of Fresenius Kabi are adjusted. Adjustments relate to the hyperinflation in Argentina. Accordingly, in constant currency growth rates of the Fresenius Group are also adjusted.
Note on the Vamed exit
Due to the application of IFRS 5, the prior year and prior quarter figures of the current year have been adjusted in the consolidated statement of income and the consolidated statement of cash flows. Vamed’s High-End-Services (HES) which offers services for Fresenius Helios and other hospitals, will be transferred to Fresenius and is included under Corporate / Other in the Group consolidated segment reporting. Details on the financial and accounting implications of the Vamed exit and the portfolio adjustments at Fresenius Helios are available on our website.
Information on the performance indicators are available on our website at www.fresenius.com/alternative-performance-measures.
This release contains forward-looking statements that are subject to various risks and uncertainties. Future results could differ materially from those described in these forward-looking statements due to certain factors, e.g. changes in business, economic and competitive conditions, regulatory reforms, results of clinical trials, foreign exchange rate fluctuations, uncertainties in litigation or investigative proceedings, the availability of financing and unforeseen impacts of international conflicts. Fresenius does not undertake any responsibility to update the forward-looking statements in this release.
- Strong organic growth in Group revenue of 8%1 to €5.4 billion2; excellent Group EBIT2 increase in constant currency of 15%3 to €660 million reflects strong operating performance and group-wide cost savings progressing ahead of plan.
- Strong bottom-line delivery: 15%2,3,4 EPS growth in constant currency.
- Major progress on deleveraging: Leverage ratio at 3.43x2,5 and therefore within the target corridor, in particular due to operating strength and the excellent cash flow.
- Structural productivity improvements ahead of plan.
- Strong operating cash flow development driven by working capital efficiencies and the increased focus on cash generation as well as excellent operating performance.
- Group outlook for fiscal 2024 confirmed based on excellent first half; Optimistic to get Group EBIT growth2,6 into upper half of 6 to 10% range.
- Fresenius Kabi clearly above the top-end of the structural growth band with very strong organic revenue growth of 11%1 ; excellent EBIT margin at 15.9%2.
- Growth Vectors at Kabi pacing performance: very strong organic growth of 19%1; EBIT margin of 14.7%2 within structural margin band.
- Biopharma accelerating momentum: very strong revenue growth and yet again positive EBIT in Q2 driven by the licensing business at mAbxience and ongoing ramp up of Tyenne.
- Fresenius Helios with strong organic revenue growth of 6%; EBIT margin of 11.1%2 driven by an excellent operating performance in Spain.
1 Organic growth rate adjusted for accounting effects related to Argentina hyperinflation.
2 Before special items
3 Growth rate adjusted for Argentina hyperinflation
4 Excluding Fresenius Medical Care
5 At average exchange rates for both net debt and EBITDA; pro forma closed acquisitions/divestitures, including lease liabilities, including Fresenius Medical Care dividend
6 Constant currency
Conference call and Audio webcast
As part of the publication of the results for Q2/24, a conference call will be held on July 31, 2024 at 1:30 p.m. CEST (7:30 a.m. EDT). All investors are cordially invited to follow the conference call in a live audio webcast at www.fresenius.com/investors. Following the call, a replay will be available on our website.
Michael Sen, CEO of Fresenius: “Fresenius had an outstanding Q2 and first half in 2024. We delivered strong top-line growth, higher margins, and even more powerful bottom-line growth. Cash came in extremely strong, materially improving our financial profile. We are well ahead of our plans to deleverage and to take out costs. 2024 is an inflection year where we see how the work we’ve done continues to impact and improve the lives of patients and generate value for all stakeholders. Fresenius is 'Committed to Life' ".
Structural productivity improvements ahead of plan
The Group-wide cost and efficiency measures are progressing faster than planned. Including the first half of 2024, Fresenius has achieved structural cost savings totaling ~€336 million at EBIT level.
For the remainder of the year, Fresenius will continue its efforts to further increase its structural productivity. Some measures that were planned for 2025 will be brought forward to the current financial year. The company aims to achieve the target of annual sustainable cost savings of ~€400 million at EBIT level by year-end 2024. Originally, this was expected in 2025.
The structural cost savings continue to be driven by all business segments and the Corporate Center. Key elements include measures to reduce complexity, optimize supply chains and improve procurement processes.
Group sales and earnings development

Group revenue before special items increased by 6% (8% in constant currency) to €5,414 million (Q2/23: €5,113 million). Organic growth was 8%2 driven by an ongoing strong performance of Kabi and Helios. Currency translation had a negative effect of 2% on revenue growth.
Group EBITDA before special items increased by 14% (14% in constant currency) to €938 million (Q2/23: €822 million).
Group EBIT before special items increased by 16% (15% in constant currency) to €660 million (Q2/23: €571 million) mainly driven by the good earnings development at Kabi and Helios and the continued progress of the groupwide cost savings program. The EBIT margin before special items was 12.2% (Q2/23: 11.2%). Reported Group EBIT was €265 million (Q2/23: €187 million).
Group net interest before special items was -€108 million (Q2/23: -€99 million) mainly due to financing activities in a higher interest rate environment.
Group tax rate before special items was 26.1% (Q2/23: 25.2%).
1 Before special items
2 Organic growth rate adjusted for accounting effects related to Argentina hyperinflation
3 Net income attributable to shareholders of Fresenius SE & Co. KGaA
Constant currency growth rates adjusted for Argentina hyperinflation. Financial figures and growth rates adjusted for the divestment of the fertility services group Eugin and the hospital stake in Peru.
Net income1 from deconsolidated Fresenius Medical Care operations before special items increased by 21% (16% in constant currency) to €69 million (Q2/231: €57 million).
Group net income1 before special items increased by 16% (15% in constant currency) to €457 million (Q2/231: €393 million). The increase was driven by the operating strength.
Group net income1 before special items excluding Medical Care increased by 15% (15% in constant currency) to €388 million (Q2/231: €336 million).
Reported Group net income1 decreased to -€373 million (Q2/231: €80 million) due to effects from special items related to the Vamed exit and the discontinued operations at Vamed.
Earnings per share1 before special items increased by 16% (15% in constant currency) to €0.81 (Q2/231: €0.69). Reported earnings per share1 were -€0.66 (Q2/231: €0.15) effects from special items related to the Vamed exit and the discontinued operations at Vamed.
1 Net income attributable to shareholders of Fresenius SE & Co. KGaA
Constant currency growth rates adjusted for Argentina hyperinflation. Financial figures and growth rates adjusted for the divestment of the fertility services group Eugin and the hospital stake in Peru.
For a detailed overview of special items please see the reconciliation tables at Financial Results.
Group Cash flow development
Group operating cash flow (continuing operations) almost quintupled to €709 million (Q2/23: €148 million). This excellent development is mainly related to working capital efficiencies and the increased focus on cash generation as well as excellent operating performance in Spain at Fresenius Helios. Group operating cash flow margin was 13.1% (Q2/23: 2.9%). Free cash flow before acquisitions, dividends and lease liabilities (continuing operations) increased to €674 million (Q2/23: €40 million). Free cash flow after acquisitions, dividends and lease liabilities (continuing operations) improved to €655 million (Q2/23: -€556 million).
Fresenius Kabi’s operating cash flow increased to €259 million (Q2/23: €180 million) with a margin of 12.3% (Q2/23: 9.0%) mainly driven by an improved working capital management, in particular related to inventories and receivables.
Fresenius Helios’ operating cash flow increased to €604 million (Q2/23: €61 million) in particular due to the strong operating performance in Spain and catch-up effects following a weaker first quarter. The strong focus on cash generation and improved management of working capital is also paying off. The operating cash flow margin was 18.7% (Q2/23: 2.0%).
The cash conversion rate (CCR), which is defined as the ratio of adjusted free cash flow1 to EBIT before special items was 1.1 in Q2/24 (LTM) (Q1/24: 0.9 LTM). This positive development is due to the increased cash flow focus across the Group.
1 Cash flow before acquisitions and dividends; before interest, tax, and special items
Group leverage
Group debt decreased by 14% (-15% in constant currency) to €13,536 million (Dec. 31, 2023: € 15,830 million) mainly related to the repayment of debt and the €400 million reduction of the leasing liabilities related to the Vamed exit. Group net debt decreased by 6% (-7% in constant currency) to € 12,428 million (Dec. 31, 2023: € 13,268 million).
As of June 30, 2024, the net debt/EBITDA ratio was 3.43x1,2 (Dec. 31, 2023: 3.76x1,2) corresponding to a reduction of 33 bps compared to FY/23. This achievement is due to a combination of the improved operational performance as well as better EBITDA and Free cash flow. The legally required suspension of dividend payments and the Vamed exit further supported the positive development. Compared to Q2/23 (4.19x1,2) this is a 76 bps reduction.
Fresenius expects the net debt/EBITDA3 ratio to be within the self-imposed corridor of 3.0 to 3.5x by the end of 2024. Further improvement in the second half of 2024 is expected. This is expected to be driven by further reducing net debt and by the operational performance at the Operating Companies.
ROIC improved to 6.0% in Q2/24 (FY/23: 5.2%) mainly due to the EBIT improvement and the stringed capital allocation. With that, ROIC reached the lower end of the self-defined target range of 6% to 8%.
For 2024, Fresenius now expects ROIC to be around 6.0% (previous: 5.4% to 6.0%), (2023: 5.2%).
1 At average exchange rates for both net debt and EBITDA; pro forma closed acquisitions/divestitures, including lease liabilities, including Fresenius Medical Care dividend
2 Before special items
3 At expected average exchange rates for both net debt and EBITDA; pro forma closed acquisitions/divestitures; excluding further potential acquisitions/divestitures; before special items; including lease liabilities, including Fresenius Medical Care dividend
For a detailed overview of special items please see the reconciliation tables at Financial Results.
Operating Company Fresenius Kabi

Revenue increased by 5% (10% constant currency) to €2,101 million (Q2/23: €2,001 million). The reported revenue growth is mainly driven by negative currency translation effects related to the hyperinflation in Argentina. Organic growth was 11%1. This strong performance was driven by the Growth Vectors and helped by pricing effects in Argentina.
Revenue of the Growth Vectors (MedTech, Nutrition and Biopharma) increased by 8% (19% in constant currency) to €1,149 million (Q2/23: €1,062 million). Organic growth was outstanding at 19%1. In Nutrition, organic growth of 14%1 benefited from the good development in the US, driven by the ongoing roll-out of lipid emulsions. Whereas China continued to be impacted by indirect effects of the government’s countrywide anti-corruption campaign and tender headwinds. Biopharma showed excellent organic growth of 102%1 driven by licensing agreements at mAbxience and the successful product launch of Tyenne in Europe. In MedTech, organic growth was of 9%1 driven by a broad-based positive development across most regions and many products groups.
Revenue in the Pharma (IV Drugs & Fluids) business was flat (0% in constant currency; organic growth: 2%1) and amounted to €951 million (Q2/23: €952 million). Organic growth was mainly driven by the positive development across many regions, particularly Europe.
EBIT2 of Fresenius Kabi increased by 17% (17% in constant currency) to €334 million (Q2/23: €285 million) mainly due to the good revenue development, the EBIT break-even result of the Biopharma business, and ongoing progress of the cost saving initiatives. EBIT margin2 was 15.9% (Q2/23: 14.2%) and thus at the upper end of 2024 outlook.
EBIT2 of the Growth Vectors increased by 93% (constant currency: 47%) to €169 million (Q2/23: €88 million) due to the EBIT break-even result of the Biopharma business and the good revenue development. EBIT2 margin was 14.7% (Q2/23: 8.3%).
EBIT2 in the Pharma business decreased by 10% (constant currency: -11%) to €185 million (Q2/23: €206 million) primarily driven by additional costs due to the start of production at the main US plants in Wilson and Melrose Park. EBIT2 margin was 19.5% (Q2/23: 21.6%).
1 Organic growth rate adjusted for accounting effects related to Argentina hyperinflation.
2 Before special items
Constant currency growth rates adjusted for Argentina hyperinflation.
For a detailed overview of special items please see the reconciliation tables at Financial Results.
Operating Company Fresenius Helios

Revenue before special items increased by 7% (6% in constant currency) to €3,230 million (Q2/23: €3,020 million). Organic growth was 6%.
Revenue of Helios Germany increased by 3% (in constant currency: 3%) to €1,882 million (Q2/23: €1,823 million), mainly driven by favourable price effects and moderately increased activity levels. Organic growth was 3%.
Revenue of Helios Spain before special items increased by 13% (11% in constant currency) to €1,348 million (Q2/23: €1,198 million) driven by a positive calendar effect related to the Easter week and related higher activities, as well as positive price effects. Organic growth was 11%. The clinics in Latin America also showed a good performance.
EBIT1 of Fresenius Helios increased by 19% (18% in constant currency) to €357 million (Q2/23: €301 million) with an excellent EBIT margin1 of 11.1% (Q2/23: 10.0%) due to the strong operating performance in Spain.
EBIT1 of Helios Germany increased by 2% to €157 million (Q2/23: €154 million) with an EBIT margin1 of 8.3% (Q2/23: 8.4%) driven by the solid revenue development and helped by Government relief funding for higher energy costs.
EBIT1 of Helios Spain increased by 33% (32% in constant currency) to €201 million (Q2/23: €151 million) driven by the strong revenue growth based on the positive calendar effect related the Easter week as well as positive price effects. The EBIT margin1 reached 14.9% (Q2/23: 12.6%), clearly above the structural margin band ambition. On a more comparable half-year basis, the EBIT margin improved 30 bps to13.3% (H1/23: 13.0%).
Exit Fresenius Vamed
As of Q2 2024, Vamed is no longer a reporting segment of Fresenius. The company’s High-End-Services (HES) which offers services for Fresenius Helios and other hospitals, will be transferred to Fresenius and has already been included under Corporate / Other in the Group consolidated segment reporting.
The divestment of the rehabilitation business and the Vamed operations in Austria led to non-cash special items of €427 million at Group net income level.
Due to the exit from the project business, a total amount of high triple-digit million euros of special items are expected, which are spread over the next few years and mostly cash-effective. In H1/24, special items related to the gradual scale back of the international project business amounted to €425 million at Group EBIT level and to €343 million2 at Group net income level.
1 Before special items
2 According to 77% ownership share
Financial figures and growth rates adjusted for the divestment of the fertility services group Eugin and the hospital stake in Peru.
For a detailed overview of special items please see the reconciliation tables at Financial Results.
Group and segment outlook for 20241
Fresenius confirms its outlook for FY/24. Based on the excellent first half year, Fresenius is optimistic to get Group constant currency EBIT2,3 growth into the upper half of the 6% to 10% range. For 2024, Group organic revenue growth2,3 is expected to grow between 4% to 7%.
Fresenius Kabi expects organic revenue growth in a mid-to high-single-digit percentage range in 2024. The EBIT margin3 is expected to be in a range of 15% to 16% (structural margin band: 14% to 17%).
Fresenius Helios expects organic revenue3 to grow in mid-single digit percentage range in 2024. The EBIT margin3 is expected to be within 10% to 11% (structural margin band: 10% to 12%).
The Group outlook is given without Fresenius Vamed, i.e. exclusively for the Operating Companies Fresenius Kabi and Fresenius Helios.
1 For the prior-year basis please see table “Basis for Guidance for 2024”
2 2023 base: €2,266 million
3 Before special items
4 2023 base: €20,307 million
Basis for Guidance for 2024

1 Before special items
If no timeframe is specified, information refers to Q2/2024.
An overview of the results for Q2/2024 - before and after special items – is available on our website.
Consolidated results for Q2/24 as well as for Q2/23 include special items. These concern: divestment of the fertility services group Eugin and the hospital stake in Peru, Vamed exit, expenses associated with the Fresenius cost and efficiency program, transaction costs for mAbxience and Ivenix, costs in relation to the change of legal form of Fresenius Medical Care, legacy portfolio adjustments, IT transformation, transformation/exit Vamed, discontinued operations Vamed, special items at Fresenius Medical Care, and impact of PPA due to the application of the equity method to the Fresenius Medical Care investment. The special items shown within the reconciliation tables are reported in the Corporate/Other segment.
Note on the deconsolidation of Fresenius Medical Care
Following the deconsolidation of Fresenius Medical Care, Group financial figures are presented in accordance with IAS 28 (at equity method) since December 1, 2023. The proportionate share of 32% of Fresenius Medical Care is presented as a separate line in Fresenius Group’s P&L and balance sheet. Dividends received from Fresenius Medical Care are reported as a separate line as part of the cash flow statement. Moreover, IAS 28 requires a full purchase price allocation (PPA). The accounting for the PPA is treated as special item. For reasons of simplification and comparability, Fresenius presents net income with and without Fresenius Medical Care`s equity result.
Note on the portfolio optimization at Fresenius Helios
As part of the portfolio optimization, the sale of the fertility services group Eugin was completed on January 31, 2024. The divestment of the majority stake in the hospital Clínica Ricardo Palma hospital in Lima, Peru, was completed on April 23, 2024. Therefore, results of Fresenius Helios and accordingly of the Fresenius Group for Q2/24 and Q2/23 are adjusted.
Note on the growth rates Fresenius Kabi
Growth rates in constant currency of Fresenius Kabi are adjusted. Adjustments relate to the hyperinflation in Argentina. Accordingly, in constant currency growth rates of the Fresenius Group are also adjusted.
Note on the Vamed exit
Due to the application of IFRS 5, the prior year and prior quarter figures of the current year have been adjusted in the consolidated statement of income and the consolidated statement of cash flows. Vamed’s High-End-Services (HES) which offers services for Fresenius Helios and other hospitals, will be transferred to Fresenius and is included under Corporate / Other in the Group consolidated segment reporting. Details on the financial and accounting implications of the Vamed exit and the portfolio adjustments at Fresenius Helios are available on our website.
Information on the performance indicators are available on our website at
https://www.fresenius.com/alternative-performance-measures.
This release contains forward-looking statements that are subject to various risks and uncertainties. Future results could differ materially from those described in these forward-looking statements due to certain factors, e.g. changes in business, economic and competitive conditions, regulatory reforms, results of clinical trials, foreign exchange rate fluctuations, uncertainties in litigation or investigative proceedings, the availability of financing and unforeseen impacts of international conflicts. Fresenius does not undertake any responsibility to update the forward-looking statements in this release.
Fresenius published its first Sustainability Highlights Report today. In the online report, the company presents its sustainability strategy, ambitions and highlights. In addition, the company reports on Scope 3 emissions for the first time, thereby creating full transparency across the entire value chain.
- Improving Fresenius Helios outlook for FY/24 – Expecting mid-single-digit revenue growth and an EBIT margin of 10% to 11% in FY/24
- Raising ambition level for Fresenius Helios within Fresenius Financial Framework – Targeting organic revenue growth of 4% to 6% p.a. as well as structural EBIT margin band of 10% to 12%
- System-critical and stable businesses – Helios Germany’s and Quirónsalud’s patient-centric, reliable and market-leading provider network driving steady capital-efficient organic growth and consistent cash-flow generation
- Digital and data strategy – Bringing new tools and technologies, such as AI, to clinical practice and tapping opportunities to leverage proprietary data to boost treatment outcomes
- Key value drivers – Clustering and specialization, outpatient integration, and emergency care provision in Germany; technology-focused improvements, enhanced physician value proposition, and selective network expansion in Spain
At its Capital Markets Day in London, global healthcare company Fresenius today presented a strategy update for its Care Provision Platform and improved the outlook for its Operating Company Fresenius Helios. For FY/24, Fresenius Helios now expects organic revenue to grow in a mid-single digit percentage range (previous: low-to-mid-single-digit percentage range) and targets an EBIT margin of 10 to 11% (previous: within structural margin band of 9% to 11%). Furthermore, Fresenius raised its ambition level for Fresenius Helios within the Fresenius Financial Framework, and now targets an annual organic revenue growth of 4% to 6% (previous: 3% to 5%) as well as a structural margin band of 10% to 12% (previous: 9% to 11%). The ambition is to grow EBIT stronger than revenue, hence, underlining accelerated profitable growth. Fresenius Helios further sharpens its focus on optimizing net working capital to improve its sustainable cash flow generation. The expected acceleration of organic revenue growth, targeted productivity improvements, enhanced profitability and rigorous capital allocation measures are contributing to Fresenius Group’s ambition to improve its Return on Invested Capital (ROIC) and its deleveraging efforts.
The improved expectations follow a strong start into 2024 and are based on the key elements and drivers of Fresenius Helios’ growth strategy, which Fresenius outlined to analysts and investors today. The main growth drivers at Helios in Germany are an extended medical cluster & specialization strategy, further improved outpatient integration and a boost of the emergency care provision. At Quirónsalud, the main growth drivers are technology-focused improvements, various physician support initiatives, as well as a selective network expansion. Fresenius Helios is Europe's leading private healthcare provider. It operates around 140 hospitals and more than 400 outpatient facilities under its brands Helios in Germany and Quirónsalud in Spain and Colombia.
Fresenius CEO Michael Sen said: “As a leading therapy-focused company, we are shaping the future of healthcare, which will be digital, data-driven, personalized and human. And this is where our strength lies. We are close to the patients. We are Committed to Life. That is the promise we have made with #FutureFresenius. And we are a simpler and stronger company today. Our sharpened focus on our Operating Companies is paying off. The strong and reliable growth momentum of our Care Provision Platform gives us confidence which is why we are improving the outlook for Fresenius Helios for the full year.”
Hospital markets growing
Hospital markets in Germany and Spain are growing steadily and reliably. In Germany, the total hospital market in 2023 was around €120 billion. It is expected to grow by 3% to 4% per year until 2027, driven by supportive demographic trends including an aging population and inflation-related base rate adjustments. Furthermore, Helios Germany sees itself well positioned to benefit from the planned hospital reform, which fosters hospital network concentration, specialization and a stronger integration of inpatient and outpatient care.
In Spain, where there are distinct public and private healthcare systems, the private provider segment accounted for 20% (€21 billion) of total provider expenditures in 2023 and is expected to grow at an average rate of 4% to 5% annually until 2027. This growth is – like in Germany – also driven by demographic factors, and price adjustments, but also by a continued uptake of private health insurances due to public system pressure, resulting in a growing demand for private provider offerings.
Robert Möller, member of the Fresenius Management Board and CEO of Fresenius Helios, said: “Providing world-class care and high-quality medical outcomes is key to our success. We lead in two steadily growing and highly attractive markets, representing roughly 30% of the EU's total population. It makes us number one in European healthcare provision, and it makes us critical for the systems we serve. With our proven focus on superior medical outcome quality, highly efficient care provision and strong digital and data capabilities, we are well positioned in both countries to drive steady, value-accretive growth.”
Growth strategies for Germany and Spain
In Germany, Helios will further drive its strategy of grouping its hospitals into highly specialized clusters, whereby two to five hospitals in geographic proximity form one multi-site hospital system. Experience shows that these clusters deliver higher medical quality, efficiency and growth by consolidating and better aligning medical and administrative activities as well as promoting specialization among the locations. The cluster and specialization strategy therefore is also well aligned with current and expected future regulatory changes in Germany. This also applies to the stronger integration of inpatient and outpatient care, which Helios expects to support with its own network of around 230 outpatient centers and strong relationships with external partners. These allow for seamless patient journeys and a closer collaboration between physicians resulting in improved patient experience and medical outcome quality.
Quirónsalud in Spain focuses on its core hospital operations and continued value creation based on its leadership position and solid market fundamentals. The Spanish hospital market is highly attractive with a growing private healthcare segment, providing tailwinds to Quirónsalud’s steady and resilient growth going forward. Focus of Quirónsalud will be on further improving clinical pathways, leveraging digital capabilities to optimize processes and performance as well as to boost patient care quality. Already today, Quirónsalud has an outstanding positioning in digitalization in Spain with more than 6 million registered patient portal users and large parts of the patient journey being already fully digitalized. In addition, Quirónsalud will drive value from strengthening its value proposition to attract and retain best-in-market talents as well as in engaging selective network expansion.
Digitalization as enabler to boost medical outcome quality
Given their commitment to highest medical quality, Helios Germany and Quirónsalud highly focus on outcome quality and its continuous further improvement by measurement against internal and external benchmarks. Helios in Germany, for example, delivers better quality performance versus the market average in 89% of its cases and has a patient satisfaction rate of 96%. Meanwhile Quirónsalud is the first private group worldwide to earn the JCI accreditation for healthcare quality at the corporate level and has a 90% patient satisfaction rate. Both Helios Germany and Quirónsalud are currently rolling out a structured benchmarking program to intensify cross company comparison and best practice sharing from best performing hospitals, setting the benchmark for all hospitals in the group.
Leveraging medical data, analytics and AI will further promote improved medical outcomes as well as personalized care and better patient experience. Fresenius Helios aims to systematically utilize medical and clinical data to improve treatment quality and outcomes, as well as unlock experience and efficiency gains for its patients, its people, and its performance at the same time. The clear aim is to have all relevant clinical decision-making supported by digital assistance in the mid-term.
ESG: Zero CO2 emissions by 2040
Fresenius Helios reiterates its ambitious ESG targets across its business activities with clearly defined tracking and connection to management remuneration. Its ESG strategy holistically aims to serve patients, people and the planet and is reflected in respective KPIs. Initiatives focused on patients include the Inpatient Quality Indicator and ISO certifications of Helios hospitals, for instance. The efforts for its people are, for example, captured with the People Engagement Index, reflecting initiatives like employee training. With regard to its planet commitment, Fresenius Helios’ key ambition is to reduce CO2 emissions by 50% by 2030 and to zero by 2040.
Webcast
Presentations will be held on June 5, 2024, starting at 11:30 a.m. CEDT. You are cordially invited to follow the Capital Markets Day in a live webcast at https://www.fresenius.com/capital-markets-day. After the event, a replay will be available on our website.
This release contains forward-looking statements that are subject to various risks and uncertainties. Future results could differ materially from those described in these forward-looking statements due to certain factors, e.g. changes in business, economic and competitive conditions, regulatory reforms, results of clinical trials, foreign exchange rate fluctuations, uncertainties in litigation or investigative proceedings, the availability of financing and unforeseen impacts of international conflicts. Fresenius does not undertake any responsibility to update the forward-looking statements in this release.
- Excellent start to 2024: Group outlook raised for FY/24 due to the excellent first quarter and a better than originally expected operating performance for the remainder of the financial year 2024: Group organic revenue growth 4 to 7%, EBIT growth in constant currency 6 to 10%.
- Strategic portfolio measures concluded: Structured exit from Investment Company Vamed initiated.
- Strong organic growth in Group revenue of 6%1 to € 5.7 billion in Q1/24; Group EBIT increase in constant currency by 15% to € 633 million reflects the excellent performance of Operating Companies and the group-wide cost savings progressing ahead of plan.
- EPS increases: 11% in constant currency.
- Strong operating cash flow development at Fresenius Kabi driven by working capital efficiencies; Fresenius Helios expects catch-up of outstanding receivables in Germany in the course of the year.
- Fresenius Kabi shows excellent organic revenue growth of 9%1 and an improved EBIT margin at 15.1% in particular driven by the positive development of the Biopharma business.
- Biopharma business picking up: EBIT break-even in Q1/24 driven by licensing business at mAbxience; Tyenne with good progress.
- Fresenius Helios with solid organic revenue growth of 5%2 and EBIT margin of 11.1%; supported by phasing of energy related government relief funding in Germany and strong operating performance.
1 Organic growth rate adjusted for the accounting effects related to Argentina hyperinflation.
2 Organic growth rate adjusted for the divestment of the fertility services group Eugin and the hospital stake in Peru.
If no timeframe is specified, information refers to Q1/2024.
An overview of the results for Q1/2024 - before and after special items – is available on our website.
Following the deconsolidation of Fresenius Medical Care, Group financial figures are presented in accordance with IAS 28 (at equity method) since December 1, 2023. The proportionate share of 32% of Fresenius Medical Care is presented as a separate line in Fresenius Group’s P&L and balance sheet. Dividends received from Fresenius Medical Care will also be reported as a separate line as part of the cash flow statement. Moreover, IAS 28 requires a full purchase price allocation (PPA). The accounting for the PPA is treated as special item. For reasons of simplification and comparability, Fresenius presents net income with and without Fresenius Medical Care`s equity result.
Information on the performance indicators are available on our website at https://www.fresenius.com/alternative-performance-measures.
Consolidated results for Q1/24 as well as for Q1/24 include special items. These concern: revaluations of biosimilars contingent purchase price liabilities, expenses associated with the Fresenius cost and efficiency program, transaction costs for mAbxience and Ivenix, costs in relation to the change of legal form of Fresenius Medical Care, the transformation of Fresenius Vamed, legacy portfolio adjustments, special items at Fresenius Medical Care, and impact of PPA equity method Fresenius Medical Care. The special items shown within the reconciliation tables are reported in the Corporate/Other segment.
Growth rates of Fresenius Kabi and Fresenius Helios are adjusted. Adjustsments relate to the divestment of the fertility services group Eugin and the hospital stake in Peru at Fresenius Helios and Helios Spain as well as to hyperinflation in Argentina at Fresenius Kabi. Accordingly, growth rates of the Fresenius Group are also adjusted.
Conference call and Audio webcast
As part of the publication of the results for Q1/24, a conference call will be held on May 8, 2024 at 1:30 p.m. CET (7:30 a.m. EST). All investors are cordially invited to follow the conference call in a live audio webcast at https://www.fresenius.com/investors. Following the call, a replay will be available on our website.
Michael Sen, CEO of Fresenius: “Fresenius has made an excellent start into the year and our focus on Fresenius Kabi and Fresenius Helios is paying off. We are confident to maintain our growth momentum and raise our outlook for the full year. With the exit from Vamed, our strategic portfolio restructuring is completed as planned. Fresenius is already a simpler, stronger, and more innovative company due to the consistent implementation of #FutureFresenius. We now have even more opportunities to offer world-class therapies and improve people’s health.”
#FutureFresenius: Exit from Investment Company Vamed concludes strategic portfolio measures
The exit from the Investment Company Vamed completes the strategic portfolio restructuring as part of #FutureFresenius. The exit is carried out in three parts: 1) The already announced sale of 67 % of Vamed’s rehabilitation business to the private equity company PAI. Closing of this transaction is expected in the second half of 2024 2) Vamed’s operations in Austria to be sold to an Austrian consortium of the construction companies Porr and Strabag for a total purchase price of €90 million. 3) The Health Tech Engineering (HTE) segment, which is responsible for the international project business and accounts for around 15% of Vamed's revenue, will gradually be scaled back in an orderly manner. The process should largely be completed by 2026. Until then, the business will be reported as a special item outside Fresenius' core business. Current project contracts will be fulfilled.
Vamed’s High-End-Services (HES) which offers services for Fresenius Helios and other hospitals, will be transferred to Fresenius. HES is a stable business with good growth prospects and accounts for around 30% of Vamed's revenues. The profitability of HES is in the mid-single-digit percentage range.
The divestments of the rehabilitation business and the operations in Austria lead to non-cash special items of around €0.6 billion.
Due to the exit from the project business, a high triple-digit-million euro amount of special items are expected, which are spread over the next few years and mostly cash-effective.
As of Q2 2024, Vamed will no longer be a reporting segment of Fresenius. In addition to reducing complexity, this step is expected to improve the Group's profitability by more than 50 basis points. It will also reduce net debt and increase the Group's return on invested capital (ROIC). Last but not least, the transparency and quality of earnings will be significantly enhanced.
After exiting from Vamed, Fresenius will consist of the two Operating Companies Fresenius Kabi and Fresenius Helios (each with 100% ownership share) and the Investment Company Fresenius Medical Care (32% ownership share).
Cost savings program fully on track
The groupwide cost savings program progressed is fully on track. Under the program, Fresenius realized ~€25 million incremental structural cost savings at EBIT level in Q1/24. In the same period, one-time costs of ~€15 million incurred to achieve these savings.
Fresenius expects to achieve annual sustainable cost savings of ~€400 million at EBIT level by 2025. So far, Fresenius reached ~€305 million of cumulative structural cost savings. To reach this target, one-time costs between ~€80 and €100 million are anticipated between 2024 and 2025.
For 2024, total cost savings of ~€330 to €350 million are expected. This corresponds to incremental cost savings of ~€50 to €70 million in 2024 compared to 2023.
The programs continue to target all business segments and the Corporate Center. Key elements include measures to optimize sales and administrative costs, fostering digitalization as well as improve procurement processes.
Group sales and earnings development

Group revenue increased by 4% (6% in constant currency) to €5,704 million (Q1/23: €5,546 million). Organic growth was 6%1 driven by an ongoing strong performance of our Operating Companies. Currency translation had a negative effect of 2% on revenue growth.
In Q1/24, revenue of the Operating Companies increased by 5% (7% in constant currency) to €5,216 million (Q1/23: €5,039 million).
Group EBITDA before special items increased by 13% (13% in constant currency) to €924 million (Q1/232: €828 million).
Group EBIT before special items increased by 15% (15% in constant currency) to €633 million (Q1/232: €554 million) mainly driven by the good earnings development at the Operating Companies and the continued progress of the groupwide cost savings program. The EBIT margin before special items was 11.1% (Q1/231: 10.0%). Reported Group EBIT was €559 million (Q1/23: €526 million).
The Operating Companies showed an 9% increase of EBIT before special items (9% in constant currency) to €631 million (Q1/232: €581 million) with an EBIT margin of 12.1% (Q1/232: 11.5%).
1 Organic growth rate adjusted for the divestment of the fertility services group Eugin, the hospital stake in Peru, and accounting effects related to Argentina hyperinflation.
2 Before special items
3 Net income attributable to shareholders of Fresenius SE & Co. KGaA
Group net interest before special items increased to -€115 million (Q1/231: -€87 million) mainly due to financing activities in a higher interest rate environment.
Group tax rate before special items was 24.5% (Q1/231: 24.4%).
Net income1 from deconsolidated Fresenius Medical Care operations before special items increased by 25% (33% in constant currency) to €60 million (Q1/232: €48 million).
Group net income2 before special items increased by 10% (11% in constant currency) to €429 million (Q1/232: €389 million). The increase was driven by the operating strength which outpaces higher interest.
Group net income1 before special items excluding Medical Care increased by 8% (8% in constant currency) to €369 million (Q1/232: €341 million).
Reported Group net income2 decreased to €278 million (Q1/232: €346 million).
Negative effects from the Purchase Price Allocation (PPA) and other negative special items at Fresenius Medical Care as well as the Vamed transformation had a negative impact on the Group net income income1.
Earnings per share2 before special items increased by 10% (11% in constant currency) to €0.76 (Q1/232: €0.69). Reported earnings per share2 were €0.49 (Q1/23: €0.61).
1 Before special items
2 Net income attributable to shareholders of Fresenius SE & Co. KGaA
For a detailed overview of special items please see the reconciliation tables at Financial Results.
Group Cash flow development
Group operating cash flow was €2 million (Q1/23: €32 million). The first quarter is usually the softest in the course of the year. In Q1/24 the soft operating cash flow was mainly driven by temporarily higher working capital, in particular due to nursing budget related receivables built ups at Helios Germany. Group operating cash flow margin was 0.0% (Q1/23: 0.6%). Free cash flow before acquisitions, dividends and lease liabilities decreased to -€194 million (Q1/23: -€180 million). Free cash flow after acquisitions, dividends and lease liabilities improved to -€103 million (Q1/23: -€258 million).
Fresenius Kabi’s operating cash flow increased to €157 million (Q1/23: €21 million) with a margin of 7.7% (Q1/23: 1.1%) mainly driven by an improved working capital management.
Fresenius Helios’ operating cash flow decreased to -€117 million (Q1/23: €108 million) and was impacted by higher working capital in particular driven by temporary nursing budget related receivables built-ups at Helios Germany. The operating cash flow margin was -3.7% (Q1/23: 3.5%).
Fresenius Vamed’s operating cash flow improved to -€10 million (Q1/23: -€68 million) with a margin of -1.8% (Q1/23: -11.7%).
The cash conversion rate (CCR), which is defined as the ratio of adjusted free cash flow1 to EBIT before special items was 1.0 in Q1/24 (LTM) (Q1/23: 0.9 LTM). This positive development is due to the increased cash flow focus across the Group.
1 Cash flow before acquisitions and dividends; before interest, tax, and special items
Group leverage
Group debt decreased by 8% (8% in constant currency) to €14,504 million (Dec. 31, 2023: € 15,830 million) mainly related to the repayment of debt. Group net debt increased by 2% (2% in constant currency) to € 13,485 million (Dec. 31, 2023: € 13,268 million) which is mainly related to the cash flow development at Fresenius Helios, particularly driven by temporary receivables built ups related to the nursing budget at Helios in Germany.
As of March 31, 2024, the net debt/EBITDA ratio was 3.75x1,2 (Dec. 31, 2023: 3.76x1,2), a further reduction compared to Q4/23 and mainly driven by the good EBITDA development. Compared to Q1/23 (3.96x1,2) this is a 21 bps reduction.
Fresenius expects the net debt/EBITDA3 ratio to be within the self-imposed corridor of 3.0 to 3.5x by the end of 2024. This is expected to be driven by reducing net debt and by the operational performance at the Operating Companies.
ROIC increased to 5.5% in Q1/24 (Q1/23: 5.2%) mainly due to the EBIT improvement. The Operating Companies improved ROIC to 5.8% (Q1/23: 5.5%).
1 At average exchange rates for both net debt and EBITDA; pro forma closed acquisitions/divestitures, including lease liabilities, including Fresenius Medical Care dividend
2 Before special items
3 At expected average exchange rates for both net debt and EBITDA; pro forma closed acquisitions/divestitures; excluding further potential acquisitions/divestitures; before special items; including lease liabilities, including Fresenius Medical Care dividend
For a detailed overview of special items please see the reconciliation tables at Financial Results.
Operating Company Fresenius Kabi

Revenue increased by 9% in constant currency (3% reported) to €2,051 million (Q1/23: €1,991 million). The reported revenue growth is mainly driven by negative currency translation effects related to the US dollar and the hyperinflation in Argentina. Organic growth was 9%1. This strong performance was driven in particular by the Biopharma business as well as by Nutrition.
Revenue of the Growth Vectors (MedTech, Nutrition and Biopharma) increased by 4% (14% in constant currency) to €1,089 million (Q1/23: €1,051 million). Organic growth was outstanding at 13%. In Nutrition, organic growth of 8% benefited from the good development in the US and was driven by many other international markets. Whereas China continued to be impacted by indirect effects of the government’s countrywide anti-corruption campaign and direct effects of the soft economy. Biopharma showed excellent organic growth of 117% driven by successful product launches in Europe and the US, as well as licensing agreements. MedTech showed organic growth of 1% given the high prior-year level.
1 Organic growth rate adjusted for accounting effects related to Argentina hyperinflation.
2 Before special items
Growth rates adjusted for Argentina hyperinflation.
Revenue in the Pharma (IV Drugs & Fluids) business increased by 2% (4% in constant currency; organic growth: 5%) and amounted to €962 million (Q1/23: €940 million). The solid organic growth was mainly driven by the positive development across many regions including the US.
EBIT1 of Fresenius Kabi increased by 7% (8% in constant currency) to €310 million (Q1/23: €289 million) mainly due to the good revenue development, the EBIT break-even result of the Biopharma business, and ongoing progress of the cost saving initiatives. EBIT margin1 was 15.1% (Q1/23: 14.5%) and thus within the structural EBIT margin band.
EBIT1 of the Growth Vectors increased by 29% (constant currency: 17%) to €124 million (Q1/23: €96 million) due to the EBIT break-even result of the Biopharma business and the good revenue development. EBIT1 margin was 11.4% (Q1/23: 9.2%).
EBIT1 in the Pharma business increased 4% (constant currency: 6%) to €206 million (Q1/23: €197 million) due to the very well-progressing cost saving initiatives and the good revenue development. EBIT1 margin was 21.4% (Q1/23: 21.0%).
1 Before special items
Growth rates adjusted for Argentina hyperinflation.
For a detailed overview of special items please see the reconciliation tables at Financial Results.
Operating Company Fresenius Helios

Revenue increased by 6% (5% in constant currency) to €3,184 million (Q1/23: €3,066 million). Organic growth was 5%.
Revenue of Helios Germany increased by 4% (in constant currency: 4%) to €1,903 million (Q1/23: €1,828 million), mainly driven by solid admissions numbers and favourable price effects. Organic growth was 4%.
Revenue of Helios Spain increased by 10% (8% in constant currency) to €1,281 million (Q1/23: €1,170 million) driven by ongoing strong activity levels and positive price effects. Organic growth was 7%1. The clinics in Latin America also showed a good performance.
EBIT2 of Fresenius Helios increased by 14% (14% in constant currency) to €353 million (Q1/23: €311 million) with an EBIT margin2 of 11.1% (Q1/23: 10.1%).
EBIT of Helios Germany increased by 32% to €205 million (Q1/23: €155 million) with an EBIT margin of 10.8% (Q1/23: 8.5%) in particular driven by the phasing of the Government relief funding for higher energy costs as well as the good revenue development and the progressing cost savings program.
1 Before special items
Growth rates adjusted for the divestment of the fertility services group Eugin and the hospital stake in Peru
For a detailed overview of special items please see the reconciliation tables at Financial Results.
EBIT1 of Helios Spain decreased by 6% (7% in constant currency) to €149 million (Q1/23: €157 million). EBIT1 was impacted by the phasing due to the calendar variation related to the Easter week and related lower activities and mix effects as well as a high prior-year level. Despite the Easter effect, the EBIT margin1 was 11.6% (Q1/23: 13.4%).
As part of the portfolio optimization, the sale of the fertility services group Eugin was completed on January 31, 2024. The divestment of the majority stake in the hospital Clínica Ricardo Palma hospital in Lima, Peru, was completed on April 23, 2024. The sale marks Fresenius’ exit from the Peruvian hospital market.
Fresenius Vamed
Further progress was made in Q1/24 with the far-reaching restructuring program to increase Fresenius Vamed’s profitability which was initiated in 2023.
Revenue from continued business was €514 million in Q1/24. Organic growth of the continued business increased 1% driven by the positive development of the Services business offsetting the negative effects of the Project business. Total revenue of Fresenius Vamed was €561 million (Q1/23: €583 million) and declined by 4% (-4% in constant currency).
EBIT1 was at €2 million in Q1/24 (Q1/231: -€27 million), thus showing a significant year-over-year improvement and making it the third consecutive quarter of positive EBIT. The EBIT margin1 in Q1/24 was 0.4% (Q1/231: -4.6%).
The ongoing transformation resulted in negative special items of €47 million in Q1/24 mainly related to cessation of activities, asset re-evaluations and restructuring costs resulting in write-downs and provisions. The negative special items were predominantly booked as non-cash items.
1 Before special items
Growth rates adjusted for the divestment of the fertility services group Eugin and the hospital stake in Peru
Group and segment outlook for 20241
Fresenius raises its outlook for FY/24 based on the excellent first quarter and improved prospects for the ramainder of the year.
For 2024, Group organic revenue growth2 is now expected to grow between 4% to 7% (previous: 3% to 6%). Group constant currency EBIT3,4 is expected to grow in the rage of 6% to 10% (previous: 4% to 8%).
Fresenius Kabi now expects organic revenue growth in a mid-to high-single-digit percentage range in 2024 (previous: mid-single-digit percentage range). The EBIT margin4 is now expected to be in a range of 15% to 16% (previously: around 15%) (structural margin band: 14% to 17%).
Fresenius Helios expects organic revenue to grow in a low to mid-single digit percentage range in 2024. The EBIT margin4 is expected to be within the structural margin band of 9% to 11%.
The adjustment of the Group outlook also reflects the fact that the forecast is now given without Fresenius Vamed, i.e. exclusively for the Operating Companies Fresenius Kabi and Fresenius Helios. Following the announcement of the planned divestment of Fresenius Vamed's rehabilitation business, Fresenius has initiated its structured exit from its Investment Company Fresenius Vamed.
1 For the prior-year basis please see table “Basis for Guidance for 2024”
2 2023 base: €20,307 million
3 2023 base: €2,266 million
4 Before special items
Basis for Guidance for 2024

This release contains forward-looking statements that are subject to various risks and uncertainties. Future results could differ materially from those described in these forward-looking statements due to certain factors, e.g. changes in business, economic and competitive conditions, regulatory reforms, results of clinical trials, foreign exchange rate fluctuations, uncertainties in litigation or investigative proceedings, the availability of financing and unforeseen impacts of international conflicts. Fresenius does not undertake any responsibility to update the forward-looking statements in this release.
- Fresenius achieves the raised outlook for FY/23. Strong fourth quarter with continued good development of the Operating Companies Fresenius Kabi and Fresenius Helios and progress in the turnaround of the Investment Company Fresenius Vamed.
- Group 2024 outlook: Organic revenue growth expected between 3% and 6%; EBIT expected to grow between 4% and 8%.
- Improvement leverage ratio: expected to be within the target corridor of 3.0x to 3.5x by the end of 2024.
- Revenue of €22.3 billion in FY/23: Strong organic Group revenue growth of 6%; Group EBIT increased 2% in constant currency to €2.3 billion; excellent Group operating cashflow totaled €2.1 billion.
- Group cost savings target significantly exceeded by ~40% in 2023 – FY/25 structural productivity savings target raised to ~€400 million at EBIT level (before: ~€350 million).
- Group revenue increased organically by 5% in Q4; Group EBIT increased by 8% in constant currency.
- Fresenius Kabi with excellent organic revenue growth of 7% in Q4 at top-end of structural growth band and EBIT margin of 14.1% within structural band.
- Fresenius Helios with strong organic revenue growth of 5% in Q4 at top-end of structural growth band and excellent EBIT margin of 11.6 % well above structural margin band.
- Fresenius Vamed’s transformation progressing well; ongoing operational improvement with positive EBIT in second consecutive quarter.
- Ongoing divestments: Sale of fertility services group Eugin successfully completed in January 2024.
If no timeframe is specified, information refers to Q4/2023.
An overview of the results for Q4/2023 and the 2023 financial year - before and after special items – is available on our website.
Following the deconsolidation of Fresenius Medical Care, Group financial figures are presented in accordance with IAS 28 (at equity method) since December 1, 2023. Prior-year figures have been adjusted due to the application of IFRS 5 to the deconsolidated operations of Fresenius Medical Care.
Information on the performance indicators are available on our website at https://www.fresenius.com/alternative-performance-measures.
Consolidated results for FY/23 as well as for FY/22 in-clude special items. These concern: revaluations of biosimilars contingent purchase price liabilities, expenses associated with the Fresenius cost and efficiency program, impacts related to the war in Ukraine, transaction costs for mAbxience and Ivenix, hyperinflation in Türkiye, retroactive duties, costs in relation to the change of legal form of Fresenius Medical Care, the transformation of Fresenius Vamed, legacy portfolio adjustment, effects from the valua-tion of the investment in Fresenius Medical Care in ac-cordance with IFRS 5, and expenses PPA equity method Fresenius Medical Care. The special items shown within the reconciliation tables are reported in the Corpo-rate/Other segment.
Conference call and Audio webcast
As part of the publication of the results for FY/23, a conference call will be held on February 21, 2024 at 1:30 p.m. CET (7:30 a.m. EST). All investors are cordially invited to follow the conference call in a live audio webcast at https://www.fresenius.com/investors. Following the call, a replay will be available on our website.
Michael Sen, CEO of Fresenius: “We took decisive actions in fiscal year 2023 and put Fresenius back on track. #FutureFresenius is driving improvements throughout the company and creating value. We added focus, simplified the structure, and delivered better financial performance. We will build on that momentum to further grow our businesses and accelerate earnings growth driven by the Operating Companies Fresenius Kabi and Fresenius Helios. Fresenius is uniquely positioned to address the rising demand for healthcare leveraging innovations also in digitalization and AI. We are deepening our purpose of Advancing Patient Care.”
2024 Strategic priorities
After a year of significant structural progression in the Group and improved operating performance, Fresenius’ priorities in 2024 will focus on financial progression. This includes driving down leverage, execute on raised cost savings target and a rigorous focus on capital efficiency and returns. This bundle of measures is expected to translate into accelerated earnings growth in 2024 and beyond.
Fresenius is uniquely positioned to benefit from the mega trends of the healthcare sector, including growing and ageing populations, and digitalization. With its leading position in the European private hospital market and at a vast number of ambulatory clinics, the company has direct access to about 26 million patients. In addition, innovative MedTech devices and an integrated end-to-end Biopharma platform enable crucial therapies for the future. These strong platforms form a highly robust, earnings-enhancing business model in attractive growth areas.
Deconsolidation of Fresenius Medical Care successfully completed
Fresenius successfully completed the deconsolidation of Fresenius Medical Care. This was a historic step and a landmark on the way forward to #FutureFresenius. The complexity of the Group structure was significantly reduced, and the governance structure simplified, enabling more targeted, faster, and agile decisions at both, Fresenius and Fresenius Medical Care. Fresenius remains the largest shareholder of Fresenius Medical Care with an unchanged 32% stake.
The change in legal form took effect on November 30, 2023. Fresenius Medical Care now operates as Fresenius Medical Care AG. As a result of the deconsolidation, the investment in Fresenius Medical Care is now classified in accordance with IAS 28 (at equity method).
As part of the subsequent IFRS 5 remeasurements as of September 30, 2023 and November 30, 2023, a non-cash special item of €1,115 million attributable to the shareholders of Fresenius SE & Co. KGaA was recognized in the consolidated financial statements of Fresenius as of December 31, 2023.
Going forward, the proportionate share of 32% of Fresenius Medical Care will be presented as a separate line in Fresenius Group’s P&L and balance sheet. Dividends received from Fresenius Medical Care will also be reported as a separate line as part of the cash flow statement.
IAS 28 requires a full purchase price allocation (PPA) from the date on which the investment in Fresenius Medical Care was recognized as an associated company. The accounting for the PPA will be treated as special item.
For reasons of simplification and comparability, Fresenius will present net income with and without the equity result in the future.
Transformation Fresenius Vamed progressing well
Further good progress was made in Q4/23 with the far-reaching restructuring program toincrease Fresenius Vamed’s profitability which was initiated during 2023. After €10 million in Q3/23, Fresenius Vamed has for the second consecutive quarter shown a positive EBIT1 with €21 million in Q4/23 (FY/23: -€16 million). The EBIT margin1 in Q4/23 was 3.5% and -0.7% in 2023 (20221: 0.8%).
Revenue from continued business was €589 million in Q4/23. Organic growth of the continued business declined by5 % mainly due to some contract timing issues as well as more rigorous vetting in the Project Business. In 2023, revenue from continued businesses was €2,201 million.
Total revenue of Fresenius Vamed amounted to €595 million (Q4 2022: €712 million) and declined by 16% (-17% in constant currency). The decline is primarily related to discontinued businesses as part of the transformation and the associated adjustments and postponements in the Project business. In 2023, total revenue of Fresenius Vamed remained flat at €2,356 million (2022: €2,359 million).
The ongoing transformation resulted in negative special items of €113 million in Q4/23 mainly related to cessation of activities, asset re-evaluations and restructuring costs resulting in write-downs and provisions. The negative special items were predominantly booked as non-cash items. In 2023, a total of negative special items of €554 million were incurred.
The positive development is expected to continue in 2024. Fresenius Vamed reiterates its targets and expects to reach the structural EBIT margin band of 4% to 6% by 2025 as set out in the #FutureFresenius Financial Framework.
1 Before special items
Structural productivity targets significantly exceeded – 2025 target raised
The groupwide cost savings program progressed well ahead of plan. Under the program, Fresenius realized ~€280 million of structural cost savings at EBIT level in FY/23. With that, the originally anticipated saving of ~€200 million for FY/23 were significantly exceeded. In the same period, one-time costs of ~€220 million incurred to achieve these savings.
Due to the excellent progress of the measures implemented across the entire Group, Fresenius raises its target for the second time. Fresenius now expects to achieve annual sustainable cost savings of ~€400 million at EBIT level by 2025 (before: ~€350 million). To reach this new target, one-time costs between ~€80 and €100 million are anticipated between 2024 and 2025. For 2024, total cost savings of ~€330 to €350 million are expected. This corresponds to incremental cost savings of ~€50 to €70 million compared to 2023.
The targeted programs involve all business segments and the Corporate Center. Key elements include measures to optimize procurement, processes, sales and administrative costs, as well as fostering digitalization.
Group sales and earnings development

Group revenue remained nearly unchanged (increased by 4% in constant currency) at €5,678 million (Q4/22: €5,670 million). Organic growth was 5% driven by an ongoing strong performance of our Operating Companies. Divestitures reduced revenue growth by 1%. Currency translation had a negative effect of 4% on revenue growth. In FY/23, Group revenue increased by 4% (6% in constant currency) to €22,299 million (2022: €21,532 million). Organic growth was 6%. Currency translation decreased revenue growth by 2%.
In Q4/23, revenue of the Operating Companies increased by 2% (7% in constant currency) to €5,165 million (Q4/22: €5,047 million). In FY/23, revenue of the Operating Companies increased by 4% (7% in constant currency) to €20,255 million (2022: €19,494 million).
Group EBITDA before special items increased by 6% (4% in constant currency) to €942 million (Q4/221: €890 million). In FY/23, Group EBITDA before special items increased by 3% (3% in constant currency) to €3,422 million (20221: €3,315 million).
Group EBIT before special items increased by 13% (8% in constant currency) to €634 million (Q4/221: €559 million) mainly driven by the good earnings development at the Operating Companies and the progress of the operational turnaround at Fresenius Vamed. The EBIT margin before special items was 11.2% (Q4/221: 9.9%). Reported Group EBIT was €85 million (Q4/22: €337 million). In FY/23 Group EBIT before special items increased by 3% (2% in constant currency) at €2,262 million (20221: €2,190 million). The EBIT margin before special items was 10.1% (20221: 10.2%). Reported Group EBIT was €1,143 million (2022: €1,812 million).
The Operating Companies showed an 8% increase of EBIT before special items (2% in constant currency) to €613 million (Q4/221: € 568 million) with an EBIT margin of 11.9% (Q4/221: 11.3%). In FY/23, EBIT before special items of the Operating Companies increased by 5% (4% in constant currency) to €2,278 million (20221: €2,170 million) with an EBIT margin of 11.2% (20221: 11.1%).
Group net interest before special items increased to -€118 million (Q4/221: -€80 million) mainly due to financing activities in a higher interest rate environment. In FY/23, Group net interest before special items increased to -€418 million (20221: -€241 million).
Group tax rate before special items was 36.4% (Q4/221: 23.2%). The higher tax rate in Q4/23 is mainly due to the closing of tax audit procedures as well as a valuation adjustment of a deferred tax asset in Germany. In FY/23, Group tax rate before special items was 28.3% (20221: 22.4%).
1 Before special items
2 Net income attributable to shareholders of Fresenius SE & Co. KGaA
Net income1 from deconsolidated Fresenius Medical Care operations before special items remained unchanged (4% increase in constant currency) at €83 million (Q4/222: €83 million). In FY/23 net income1 from deconsolidated Fresenius Medical Care operations before special items decreased by 18% (-16% in constant currency) to €243 million (20222: €295 million).
Group net income1 before special items decreased by 11% (-17% in constant currency) to €397 million (Q4/222: €445 million). The decrease was mainly driven by rising interest expenses and a higher tax rate. Reported Group net income1 decreased to -€614 million (Q4/22: €255 million) and mainly results from the valuation effect of Fresenius Medical Care in accordance with IFRS 5 in the amount of €521 million (see “Deconsolidation of Fresenius Medical Care” on page 4). The effect has no cash impact. Furthermore, legacy portfolio adjustments and expenses for the cost and efficiency program, and the Vamed transformation had a negative impact on the Group net income income1. Group net income1 before special items excluding Medical Care decreased by 13% (-22% in constant currency) to €314 million (Q4/222: €362 million).
In FY/23, Group net income1 before special items decreased by 13% (-14% in constant currency) to €1,505 million (20222: €1,729 million). The decrease was driven by rising interest costs and a higher tax rate. Reported Group net income1 decreased to -€594 million (2022: €1,372 million) and was negative mainly due to the Fresenius Medical Care’s valuation effects according to IFRS 5 of €1,115 million (see chapter “Deconsolidation of Fresenius Medical Care” on page 4). These effects have no cash impact. Furthermore, expenses in connection with the Vamed transformation, legacy portfolio adjustments as well as expenses for the cost and efficiency program had a negative impact on the Group net income1. Group net income1 before special items excluding Medical Care decreased by 12% (-14% in constant currency) to €1,262 million (20222: €1,434 million).
Earnings per share1 before special items decreased by 11% (-17% in constant currency) to €0.70 (Q4/222: €0.79). Reported earnings per share1 were -€1.09 (Q4/22: €0.45).
In FY/23, earnings per share1 before special items decreased by 13% (-15% in constant currency) to €2.67 (20222: €3.08). Reported earnings per share1 were -€1.05 (2022: €2.44).
Group Cash flow development
Group operating cash flow increased by 4% to €1,272 million (Q4/22: €1,225 million) mainly driven by the strong cash flow development across the Group. Group operating cash flow margin was 22.4% (Q4/22: 21.6%). Free cash flow before acquisitions, dividends and lease liabilities increased to €888 million (Q4/22: €822 million). Free cash flow after acquisitions, dividends and lease liabilities increased to €814 million (Q4/22: €742 million).
In FY/23, Group operating cash flow increased by 5% to €2,131 million (2022: €2,031 million) with a margin of 9.6% (2022: 9.4%). Free cash flow before acquisitions, dividends and lease liabilities increased to €1,024 million (2022: €942 million). Free cash flow after acquisitions, dividends and lease liabilities improved to €115 million (2022: -€317 million).
Fresenius Kabi’s operating cash flow increased by 46% to €434 million (Q4/22: €298 million) with a margin of 21.7% (Q4/22: 14.6%) mainly driven by an improved working capital management. In FY/23, operating cash flow increased by 21% to €1,015 million (2022: €841 million) with a margin of 12.7% (2022: 10.7%).
1 Net income attributable to shareholders of Fresenius SE & Co. KGaA
2 Before special items
Fresenius Helios’ operating cash flow decreased by 9% to €867 million (Q4/22: €956 million) mainly due to phasing effects of receivables in Spain and the very strong cash flow in the prior year. The operating cash flow margin was 27.2% (Q4/22: 31.5%). In FY/23, operating cash flow decreased by 9% to €1.244 million (2022: €1.367 million) with a margin of 10.1% (2022: 11.7%).
Fresenius Vamed’s operating cash flow increased to €36 million (Q4/22: €12 million) with a margin of 6.1% (Q4/22: 1.7%) due to positive phasing effects. In FY/23, operating cash flow improved to €20 million (2022: -€44 million) with a margin of 0.8% (2022: -1.9%).
The cash conversion rate (CCR), which is defined as the ratio of adjusted free cash flow1 to EBIT before special items was 1.0 in FY/23 (2022: 0.9). This positive development is due to the increased cash flow focus across the Group including inventory management, working capital management and cash collection.
Group leverage
Group debt increased by 8% (8% in constant currency) to €15,830 million (Dec. 31, 20222: € 14,708 million). Group net debt remained broadly flat at € 13,268 million (Dec. 31, 20222: € 13,307 million). In constant currency, Group net debt decreased by 1%.
As of December 31, 2023, the net debt/EBITDA ratio was 3.76x3,4 (Dec. 31, 2022: 3.80x2,3,4). This is a strong 27 bps reduction compared to Q3/23 (4.03x3,4) and is mainly driven by the good cash flow development in Q4/23.
1 Cash flow before acquisitions and dividends; before interest, tax, and special items
2 Proforma deconsolidation Fresenius Medical Care
3 At average exchange rates for both net debt and EBITDA; pro forma closed acquisitions/divestitures, including lease liabilities, including Fresenius Medical Care dividend
4 Before special items
Fresenius expects the net debt/EBITDA1 ratio to be within the self-imposed corridor of 3.0 to 3.5x by the end of 2024. This is expected to be driven by reducing net debt and by the operational performance at the Operating Companies.
This assumption does not include further potential divestment activities, however, includes the fact that due to legal restrictions as a result of the use of government compensation and reimbursement payments for increased energy costs provided for in the Hospital Financing Act, however, Fresenius will not propose to the 2024 Annual General Meeting to distribute a dividend for the 2023 fiscal year. Irrespective of the legally required suspension of dividend payments for the 2023 fiscal year, Fresenius will maintain its progressive dividend policy in the future and continues to aim to increase the dividend in line with growth in earnings per share (in constant currency, before special items), or at least maintain the dividend at the previous year's level.
ROIC was 5.2% in FY/23 (FY/22: 5.6%) mainly due to the higher tax rate. The Operating Companies showed a ROIC of 5.6%.
1 At average exchange rates for both net debt and EBITDA; pro forma closed acquisitions/divestitures; excluding further potential acquisitions/divestitures; before special items; including lease liabilities, including Fresenius Medical Care dividend
Operating Company Fresenius Kabi

Revenue decreased by 2% (increased 9% in constant currency) to €1,996 million (Q4/22: €2,036 million) mainly driven by negative currency translation effects related to the US dollar and the hyperinflation in Argentina. Organic growth was 7%1. This strong performance was mainly driven by the strong business development of all Growth Vectors. In FY/23, revenue increased by 2% (9% in constant currency) to €8,009 million (2022: €7,850 million). Organic growth was 7%1.
Revenue of the Growth Vectors (MedTech, Nutrition and Biopharma) decreased by 3% to €997 million (Q4/22: €1,026 million) driven by negative currency exchange effects (increased 14% in constant currency). Organic growth was outstanding at 11%. In Nutrition, organic growth of 6% was driven by the good development in the US and Latin America whereas China was impacted by indirect effects of the government’s countrywide anti-corruption campaign. Biopharma showed very strong organic growth of 66% driven by successful product launches in Europe and the US, as well as licensing agreements. MedTech had an excellent organic growth of 8% driven by a broad-based positive development across most regions and many product groups. In FY/23, revenue of the Growth Vectors increased by 4% (14% in constant currency; organic growth: 10%) to €4,177 million (2022: €4,005 million).
1 To show the underlying business development, the organic growth definition was adjusted to fully exclude the significant inflation accounting effects in Argentina. According to the previous methodology, organic growth for Fresenius Kabi would have been Q1: 7%, Q2: 8%, Q3:7%, Q4: 14% and FY/23: 9%
2 Before special items
Revenue in the Pharma (IV Drugs & Fluids) business decreased by 1% (increased 3% in constant currency; organic growth: 3%) and amounted to €1,000 million (Q4/22: €1,010 million). The solid organic growth was mainly driven by a positive development across many regions. In FY/23, revenue in the Pharma business remained broadly stable (increased 3% in constant currency; organic growth: 3%) and amounted to €3,832 million (2022: €3,845 million).
EBIT1 of Fresenius Kabi increased by 19% (6% in constant currency) to €282 million (Q4/22: €236 million) due to the good revenue development and the well-progressing cost saving initiatives. EBIT margin1 was 14.1% (Q4/22: 11.6%) and thus within the structural EBIT margin band. In FY/23, EBIT1 increased by 6% (constant currency: 3%) to €1,145 million (2022: €1,080 million). EBIT margin1 was 14.3% (2022: 13.8%).
EBIT1 of the Growth Vectors increased by 69% (constant currency: 12%) to €102 million (Q4/22: €60 million) due to the excellent revenue development and the very well-progressing cost saving initiatives. EBIT1 margin was 10.2% (Q4/22: 5.9%). In FY/23, EBIT1 of the Growth Vectors increased by 15% (constant currency: 6%) to €390 million (2022: €339 million) with a margin1 of 9.3% (2022: 8.5%).
EBIT1 in the Pharma business remained nearly stable (increased in constant currency: 2%) to €189 million (Q4/22: €190 million) due to the very well-progressing cost saving initiatives. EBIT1 margin was 18.9% (Q4/22: 18.8%). In FY/23, EBIT1 in the Pharma business increased by 3% (constant currency: 6%) to €792 million (2022: €769 million) with a margin1 of 20.7% (2022: 20.0%).
1 Before special items
Operating Company Fresenius Helios

Revenue increased by 5% (5% in constant currency) to €3,188 million (Q4/23: €3,031 million) Organic growth was 5%. In FY/23, revenue increased by 5% (5% in constant currency) to €12,320 million (2022: €11,716 million). Organic growth was 5%.
Revenue of Helios Germany increased by 5% (organic growth: 5%) to €1,828 million (Q4/22: €1,749 million), mainly driven by solid admissions numbers. In FY/23, revenue of Helios Germany increased by 4% (organic growth: 4%) to €7,279 million (2022: €7,021 million).
Revenue of Helios Spain increased despite the already strong prior year quarter by 6% (5% in constant currency) to €1,289 million (Q4/22: €1,214 million) driven by ongoing strong activity levels. The clinics in Latin America also showed a good performance. Organic growth was 5%. In FY/23, revenue of Helios Spain increased by 7% (8% in constant currency, organic growth: 8%) to €4,770 million (2022: €4,441 million).
Revenue of Helios Fertility increased by 8% (17% in constant currency) to €71 million (Q4/22: €66 million) driven by favorable price and mix effects as well as the positive development of activity levels, especially in the US. Organic growth was 22%. In FY/23, revenue of Helios Fertility increased by 8% (14% in constant currency) to €269 million (2022: €250 million).
EBIT1 of Fresenius Helios increased by 5% (5% in constant currency) to €371 million (Q4/22: €354 million) with an EBIT margin1 of 11.6% (Q4/22: 11.7%).
In FY/23, EBIT1 increased by 4% (increased 4% in constant currency) to €1,232 million (2022: €1,185 million) with an EBIT margin1 of 10.0% (2022: 10.1%).
EBIT1 of Helios Germany decreased by 6% to €164 million (Q4/22: €174 million) with an EBIT margin1 of 9.0% (Q4/22: 9.9%) in particular due to the high prior-year basis. The prior-year quarter was not affected by any major negative inflation effects, which, however, had a significant negative impact on Q4/23. This could not be fully compensated despite the good revenue development as well as the progressing cost savings program and the Government compensation for higher energy costs. In FY/23, EBIT1 of Helios Germany increased by 1% to €630 million (2022: €623 million) with an EBIT margin1 at 8.7% (2022: 8.9%).
EBIT1 of Helios Spain increased by 9% due to the strong revenue development as well as the progressing cost savings program (8% in constant currency) to €188 million (Q4/22: €172 million). The EBIT margin1 was 14.6% (Q4/22: 14.2%). In FY/23, EBIT1 of Helios Spain increased by 4% (5% in constant currency) to €580 million (2022: €556 million). The EBIT margin1 was 12.2% (2022: 12.5%).
EBIT1 of Helios Fertility was €10 million (Q4/22: €6 million) with an EBIT margin1 of 14.1% (Q4/22: 9.1%). In FY/23, EBIT1 of Helios Fertility was €26 million (2022: €21 million) with an EBIT margin1 of 9.7% (2022: 8.4%).
Further milestone in the implementation of #FutureFresenius were the divestments of the fertility services group Eugin (Helios Fertility) and the sale of the stake in the hospital Clínica Ricardo Palma in Lima, Peru. Both transactions are line with Fresenius’s commitment to simplify the structure, sharpen the focus and accelerate performance. Furthermore, the sale proceeds will benefit the company’s financial flexibility. The sale of Eugin closed on January 31, 2024. In 2022, the company generated sales of €227 million. The divestment of the stake in the hospital in Peru is expected to close in the first quarter of 2024.2
1 Before special items
Group and segment outlook for 20241
Fresenius expects general cost inflation to continue at a slightly lower level in the 2024 financial year and the current geopolitical tensions to persist. Fresenius also expects interest rates to remain at a similar level to 2023. Irrespective of this, the Management Board considers the business outlook for the Group to be positive and expects a successful financial year 2024.
For 2024, Group organic revenue is expected to grow between 3% to 6%. Group constant currency EBIT2 is expected to grow in the rage of 4% to 8%.
Fresenius Kabi expects organic revenue growth in a mid-single-digit percentage range in 2024. The EBIT margin2 is expected to be around 15% (structural margin band: 14% to 17%). Fresenius Helios expects organic revenue to grow in a low to mid-single digit percentage range in 2024. The EBIT margin2 is expected to be within the structural margin band of 9% to 11%. Fresenius Vamed expects organic revenue to grow (Continued Business) in a mid-single-digit percentage range in 2024. The EBIT margin2 is expected to be 1 to 2 percentage points below the structural margin band of 4% to 6%.
Basis for Guidance for 2024

1 For the prior-year basis please see table “Basis for Guidance for 2024”
2 Before special items
This release contains forward-looking statements that are subject to various risks and uncertainties. Future results could differ materially from those described in these forward-looking statements due to certain factors, e.g. changes in business, economic and competitive conditions, regulatory reforms, results of clinical trials, foreign exchange rate fluctuations, uncertainties in litigation or investigative proceedings, the availability of financing and unforeseen impacts of international conflicts. Fresenius does not undertake any responsibility to update the forward-looking statements in this release.
- Application of IFRS 5: Fresenius Group financials for the first time presented excluding Fresenius Medical Care
- Excellent Group revenue growth of 6% in constant currency to €5.5 billion driven by Operating Companies and Fresenius Vamed
- Group EBIT increased 10% in constant currency reflecting strong performance of Operating Companies; Fresenius Vamed with operational improvement
- Fresenius Kabi with strong organic revenue growth of 7% at top-end of structural growth band; EBIT margin remains within structural band at 14.3%
- Fresenius Helios with strong organic revenue growth of 5% at top-end of structural growth band despite usual summer effect in Spain
- Fresenius Vamed’s transformation progressing
- Deconsolidation of Fresenius Medical Care effective by December 2023
- Divestments advancing: exit of hospital operations in Peru
- FY/23 structural productivity savings target of ~€200 million excluding Fresenius Medical Care already achieved in first nine months
- Group revenue outlook confirmed, Group EBIT outlook improved
If no timeframe is specified, information refers to Q3/2023.
The financial figures are presented in accordance with IFRS 5 excluding Fresenius Medical Care. However, this does not apply to net income and earnings per share. In the balance sheet and the cash flow statement, Fresenius Medical Care is presented separately.

1 Before special items
2 Net income attributable to shareholders of Fresenius SE & Co. KGaA
Michael Sen, CEO of Fresenius: “Fresenius had a great 3rd Quarter 2023. We made progress on every part of our #FutureFresenius program, including simplification of our corporate structure, and achieved cost savings well ahead of our targets for the full year 2023. At the same time, we are moving ahead with the divestment of non-core businesses. The focus on our two Operating Companies, Kabi and Helios, is paying off, with strong revenue and earnings development. Both businesses again announced important innovations, new products and strong partnerships to improve patient outcomes. And this gets a lot of recognition even beyond the industry. Given our strong performance throughout the first three quarters of the year, we are improving our operating earnings outlook for 2023 and expect constant currency Group EBIT to remain broadly flat year on year. This momentum will allow us to continue to build trust, deliver consistent performance, and stay focused on our purpose: Advancing Patient Care.”
New presentation of financial information
As a result of the approval of the change of legal form by the Extraordinary General Meeting on July 14, 2023, Fresenius Medical Care is for the first time in Q3/23 presented as a single item in the financial statements of the Fresenius Group. Fresenius Medical Care is now classified in accordance with IFRS 5 as "Operations to be deconsolidated” and presented in a single line item in Fresenius’s balance sheet, the P&L and the cash flow statement.
IFRS 5 requires the valuation of Fresenius Medical Care at Fair Value. As of September 30, 2023, the market capitalization of about €12 billion was below the consolidated shareholders‘ equity of Fresenius Medical Care of about €14 billion. This results in a valuation effect of €2 billion, of which ~€0.6 billion are attributable to the shareholders of Fresenius SE & Co. KGaA. This effect is reported as a special item without any cash impact.
Simplification advancing: Deconsolidation of Fresenius Medical Care
The deconsolidation process of Fresenius Medical Care is on track. The competent Higher Regional Court in Bamberg has fully approved the application for release that Fresenius Medical Care had filed with regard to the legal actions brought against the change of the legal form into a stock corporation. Accordingly, the change of the legal form can be registered with the commercial register. Fresenius expects the deconsolidation to become effective by December 2023. From then on, Fresenius Medical Care AG & Co. KGaA will operate as Fresenius Medical Care AG.
Sharpening of focus: Exit from hospital market in Peru
Fresenius sells its 70 percent stake in IDCQ CRP, a co-holding entity of the hospital Clínica Ricardo Palma in Lima, Peru. The stake is acquired by entities of the Verme family which already hold a stake in the hospital, together with other local investors. This exit from the hospital market in Peru is a further step to strengthening #FutureFresenius and is in line with the company's intention to divest certain assets announced earlier this year. Subject to antitrust review, the all-cash transaction is expected to close in the first quarter of 2024.
Transformation Fresenius Vamed
In Q3/23, further progress in the transformation of Fresenius Vamed was achieved. The company is undergoing a comprehensive strategic assessment of its business activities and initiated a far-reaching restructuring program to increase the company’s profitability. With a positive EBIT of €10 million in Q3/23 (Q2/23: -€20 million), Fresenius Vamed is ahead of its originally expected target for Q3/23. The encouraging development was especially driven by the High-End Services (HES) and Health Facility Operations (HFO) businesses. For Q4/23, a further solid development is expected.
In Q3/23, negative special items mainly related to closing down activities, asset re-evaluations and restructuring costs resulted in write-downs and provisions of €109 million. The negative special items were predominantly booked as non-cash items. In Q1-3/23, negative special items of €441 million were incurred.
By 2025, Fresenius Vamed is expected to reach the structural EBIT margin band of 4% to 6% set out in the #FutureFresenius Financial Framework.
Structural productivity improvements significantly ahead of plan
The groupwide cost savings program progresses significantly ahead of plan. Under the program, Fresenius realized ~€200 million of structural cost savings at EBIT level in Q1-3/23. With that, all savings originally expected for 2023 are already realized. In the same period, one-time costs of around €90 million incurred to achieve these savings. This is well below what the Company initially accounted for and testament that our one-time costs are tightly managed.
On Group level including Fresenius Medical Care, the savings in Q1-3/23 amount to ~€430 million. In the same period, one-time costs of ~€190 million incurred to achieve these savings.
FY/23 Group earnings outlook improved
Based on the consistent performance of the Operating Companies through the year, Fresenius improves the 2023 earnings outlook and now expects constant currency Group EBIT1 to remain broadly flat compared to FY/2022 (previous: EBIT1 expected to remain broadly flat to decline up to a mid-single-digit percentage rate). Group organic revenue2 continues to be expected to grow in a mid-single-digit percentage range.
Fresenius expects the net debt/EBITDA3 ratio excluding Fresenius Medical Care to be below 4.0x by the end of 2023, therefore further improving from 4.03x4 as of September 30, 2023 (December 31, 2022: 3.80x4). This assumption does not include potential divestment activities. The self-imposed target corridor for the leverage ratio remains unchanged at 3.0x to 3.5x.
Assumptions for guidance FY/23
For the remaining of 2023, Fresenius assumes no further escalations of geopolitical tensions. Fresenius expects moreover that the increased cost inflation will have a corresponding impact on its business. The company will continue to closely monitor the potential further consequences of the ongoing challenging macroeconomic environment, including balance sheet valuations. All of these assumptions are subject to considerable uncertainty.
1 FY/22 base: €2,190 million, before special items; FY/23: before special items
2 FY/22 base: €21,532 million
3 At LTM average exchange rates for both net debt and EBITDA; pro forma closed acquisitions/divestitures; excluding further potential acquisitions/divestitures; before special items; including lease liabilities, including Fresenius Medical Care dividend
4 At LTM average exchange rates for both net debt and EBITDA; pro forma closed acquisitions/divestitures; before special items; including lease liabilities, including Fresenius Medical Care dividend
For a detailed overview of special items please see the reconciliation tables starting page 24 of the PDF.
6% revenue increase in constant currency
Group revenue increased by 2% (6% in constant currency) to €5,518 million (Q3/22: €5,386 million). Organic growth was 6%. Acquisitions/divestitures contributed net 0% to growth. In total, currency translation had a negative effect of 4% on revenue growth. The Operating Companies increased revenue by 1% (5% in constant currency).
In Q1-3/23, Group revenue increased by 5% (7% in constant currency) to €16,621 million (Q1-3/22: €15,862 million). Organic growth was 6%. Acquisitions/divestitures contributed net 1% to growth. Currency translation decreased revenue growth by 2%. The Operating Companies increased revenue by 4% (7% in constant currency) in Q1-3/23.
10% EBIT1 increase in constant currency
Group EBITDA before special items increased by 9% (11% in constant currency) to €821 million (Q3/221: €755 million). Reported Group EBITDA was €661 million (Q3/22: €691 million). In Q1-3/23, Group EBITDA before special items increased by 2% (3% in constant currency) to €2,480 million (Q1-3/221: €2,425 million). Reported Group EBITDA was €1,923, million (Q1-3/22: €2,296 million).
Group EBIT before special items increased by 8% (10% in constant currency) to €519 million (Q3/221: €480 million) mainly driven by the good earnings development at the Operating Companies. The EBIT margin before special items was 9.4% (Q3/221: 8.9%). Reported Group EBIT was €346 million (Q3/22: €416 million). The Operating Companies showed an EBIT increase of 8% (10% in constant currency) and an EBIT margin of 10.3%.
In Q1-3/23 Group EBIT before special items remained nearly unchanged (0% in constant currency) at €1,628 million (Q1-3/221: €1,631 million). The EBIT margin before special items was 9.8% (Q1-3/221: 10.3%). Reported Group EBIT was €1,058 million (Q1-3/22: €1,475 million).
Group net interest before special items increased to -€109 million (Q3/221: -€67 million) mainly due to financing activities in a higher interest rate environment. Reported Group net interest was -€100 million (Q3/22: -€67 million).
In Q1-3/23, Group net interest before special items increased to -€300 million (Q1-3/221: -€161 million). Reported Group net interest was -€291 million (Q1-3/22: -€160 million).
Group tax rate before special items was 24.1% (Q3/221: 22.5%). Reported Group tax rate was 37.0% (Q3/22: 23.5%). The higher tax rate in Q3/23 is mainly due to the negative net income at Fresenius Vamed for which deferred tax assets could not be recognized. In Q1-3/23, Group tax rate before special items was 25.2% (Q1-3/221: 22.2%). Reported Group tax rate was 40.7%. The higher tax rate is also mainly due to the negative net income at Fresenius Vamed for which deferred tax assets could not be recognized (Q1-3/22: 23.0%).
Noncontrolling interests before special items were -€22 million (Q3/221: -€24 million). Reported noncontrolling interests were €6 million (Q3/22: -€21 million). In Q1-3/23, Noncontrolling interests before special items were -€46 million (Q1-3/221: -€72 million). Reported noncontrolling interests were €59 million (Q1-3/22: -€68 million).
Net income2 from operations to be deconsolidated decreased by 27% (-24% in constant currency) to €55 million (Q3/222: €75 million). In Q1-3/23 net income1 from operations to be deconsolidated before special items decreased by 25% (-24% in constant currency) to €160 million (Q3/222: €212 million).
Group net income2 before special items decreased by 7% (-5% in constant currency) to €344 million (Q3/221: €371 million). The decrease was driven by rising interest costs and a higher tax rate as well as lower net income from operations to be deconsolidated (Fresenius Medical Care). Reported Group net income2 decreased to -€406 million (Q3/22: €321 million). The negative net income is due to the Fresenius Medical Care valuation effect according to IFRS 5 of €594 million. This effect has no cash impact. In Q1-3/23, Group net income2 before special items decreased by 14% (-13% in constant currency) to €1,108 million (Q1-3/221: €1,284 million). Reported Group net income2 decreased to €20 million (Q1-3/22: €1,117 million). The decrease is due to the Fresenius Medical Care valuation effect according to IFRS 5 of €594 million. This effect has no cash impact.
Earnings per share2 before special items decreased by 8% (-6% in constant currency) to €0.61 (Q3/221: €0.66). Reported earnings per share2 were -€0.72 (Q3/22: €0.57). The negative net income is due to the Fresenius Medical Care valuation effect according to IFRS 5 of €594 million. This effect is without any cash impact. In Q1-3/23, earnings per share2 before special items decreased by 14% (-14% in constant currency) to €1.97 (Q1-3/221: €2.29). Reported earnings per share2 were €0.04 (Q1-3/22: €1.99). The decrease is due to the Fresenius Medical Care valuation effect according to IFRS 5 of €594 million. This effect is without any cash impact.
Investments
Spending on property, plant and equipment was €274 million corresponding to 5% of revenue (Q3/22: €255 million; 5% of revenue). These investments served primarily for the modernization and expansion of production facilities as well as hospitals.
1 Before special items
2 Net income attributable to shareholders of Fresenius SE & Co. KGaA
For a detailed overview of special items please see the reconciliation tables starting page 24 of the PDF.
In Q1-3/23, spending on property, plant and equipment was €725 million corresponding to 4% of revenue (Q1-3/22: €678 million; 4% of revenue).
Total acquisition spending was €179 million (Q3/22: €516 million) mainly for milestone payments in the biosimilars business at Fresenius Kabi.
In Q1-3/23, total acquisition spending was €197 million (Q1-3/22: €819 million).
Cash flow development
Group operating cash flow increased to €648 million (Q3/22: €598 million) mainly driven by the good cash flow development at Fresenius Kabi. Group operating cash flow margin was 11.7% (Q3/22: 11.1%). Operating cash flow from operations to be deconsolidated increased to €760 million (Q3/22: €658 million). Free cash flow before acquisitions, dividends and lease liabilities remained broadly stable at €376 million (Q3/22: €375 million). Free cash flow after acquisitions, dividends and lease liabilities increased to €121 million (Q3/22: -€155 million). Free cash flow after acquisitions, dividends and lease liabilities from operations to be deconsolidated increased to €358 million (Q3/22: €301 million).
In Q1-3/23, Group operating cash flow increased to €859 million (Q1-3/22: €806 million) with a margin of 5.2% (Q1-3/22: 5.1%). Operating cash flow from operations to be deconsolidated increased to €1,910 million (Q1-3/22: €1,568 million). Free cash flow before acquisitions, dividends and lease liabilities increased to €136 million (Q1-3/22: €120 million). Free cash flow after acquisitions, dividends and lease liabilities improved to -€699 million (Q1-3/22: -€1,059 million). Free cash flow after acquisitions, dividends and lease liabilities from operations to be deconsolidated increased to €396 million (Q1-3/22: -€63 million).
The cash conversion rate (CCR), which is defined as the ratio of adjusted free cash flow1 to EBIT before special items, was 0.9 (LTM) in Q1-3/23.
1 Cash flow before acquisitions and dividends; before interest, tax, and special items
Solid balance sheet structure
Total assets including Fresenius Medical Care decreased by 1% (-1% in constant currency) to €75,328 million (Dec. 31, 2022: €76,400 million).
Assets related to Fresenius Medical Care to be deconsolidated under IFRS 5 were at €33,520 million (Dec. 31, 2022: n.a.). Liabilities related to Fresenius Medical Care to be deconsolidated under IFRS 5 €20,111 million (Dec. 31, 2022: n.a.).
Total shareholders’ equity including Fresenius Medical Care decreased by 6% (-6% in constant currency) to €30,282 million (Dec. 31, 2022: €32,218 million). The equity ratio was 40.2% (Dec. 31, 2022: 42.2%).
Group debt1 increased by 3% (3% in constant currency) to €15,116 million (Dec. 31, 2022: € 14,708 million). Group net debt1 increased by 5% (5% in constant currency) to € 14,021 million (Dec. 31, 2022: € 13,307 million).
As of September 30, 2023, the net debt/EBITDA ratio was 4.03x2,3 (Dec. 31, 2022: 3.80x2,3). This is a 15 bps reduction compared to Q2/23.
In Q3/23, ROIC was 5.0% (Q4/22: 5.6%).
1 Value as of December 31, 2022 adjusted (excluding Fresenius Medical Care)
2 At LTM average exchange rates for both net debt and EBITDA; pro forma closed acquisitions/divestitures, including lease liabilities, including Fresenius Medical Care dividend
3 Before special items
Business Segments
Operating Company Fresenius Kabi
Fresenius Kabi specializes in products for the therapy and care of critically and chronically ill patients. The portfolio includes biopharmaceuticals, clinical nutrition, MedTech products, intravenously administered generic drugs (generic IV drugs), and IV fluids.

- Growth Vectors combined contributing strong 12% organic revenue growth
- Pharma business with robust development
- EBIT margin1 strong above 14% driven by operating improvements and cost savings significantly ahead of plan
Revenue decreased by 2% to €2,021 million (Q3/22: €2,071 million) driven by negative currency exchange effects (increased 7 % in constant currency). Organic growth was 7%. The good performance was mainly driven by the strong business development of all growth vectors.
In Q1-3/23, revenue increased by 3% (8% in constant currency) to €6,013 million (Q1-3/22: €5,814 million). Organic growth was 7%.
Revenue of the Growth Vectors (MedTech, Nutrition and Biopharma) decreased by 1% to €1,067 million (Q3/22: €1,075million) driven by negative currency exchange effects (increased 11% in constant currency, organic growth: 12%). In Q1-3/23, revenue of the Growth Vectors increased by 7% (14% in constant currency; organic growth: 11%) to €3,180 million (Q1-3/22: €2,978 million).
1 Before special items
2 Net income attributable to shareholders of Fresenius SE & Co. KGaA
For a detailed overview of special items please see the reconciliation tables starting page 24 of the PDF.
Revenue in MedTech remained broadly stable due to negative currency exchange effects (increased 7% in constant currency) and amounted to €369 million (Q3/22: €368 million). Organic growth was 8% and driven by a broad-based positive development across most regions and many product groups. In Q1-3/23, revenue in MedTech increased by 5% (8% in constant currency; organic growth: 9%) to €1,113 million (Q1-3/22: €1,055 million).
Revenue in Nutrition decreased by 9% (increased 5% in constant currency, organic growth: 9%) to €587 million (Q3/22: €644 million). Organic growth was driven by the good business development in the U.S. and Latin America. In Q1-3/23, revenue in Nutrition remained broadly stable (increased 9% in constant currency; organic growth: 10%) at €1,803 million (Q1-3/22: €1,808 million).
Revenue in Biopharma increased by 74% (99% in constant currency; organic growth: 71%) to €111 million (Q3/22: €64 million) mainly driven by the successful product launches in Europe and the U.S. as well as by licensing agreements. In Q1-3/23, revenue in Biopharma increased by 129% (154% in constant currency; organic growth: 59%) to €264 million (Q1-3/22: €116 million).
Revenue in the Pharma (IV Drugs & Fluids) business decreased by 5% (0% in constant currency; organic growth: 1%) and amounted to €941 million (Q3/22: €995 million). Organic growth was mainly driven by a robust development across many regions. In Q1-3/23, revenue in the Pharma business remained broadly stable (increased 2% in constant currency; organic growth: 3%) and amounted to €2,833 million (Q1-3/22: €2,836 million).
EBIT1 of Fresenius Kabi increased by 3% (6% in constant currency) to €289 million (Q3/22: €280 million) due to the good operating performance and the well-progressing cost saving initiatives. EBIT margin1 was 14.3% (Q3/22: 13.5%) and thus within the structural EBIT margin band.
In Q1-3/23, EBIT1 increased by 2% (constant currency: 2%) to €863 million (Q1-3/22: €844 million) EBIT margin1 was 14.4% (Q1-3/22: 14.5%).
EBIT1 of the Growth Vectors increased by 21% (constant currency: 25%) to €104 million (Q3/22: €86 million) due to the strong revenue development and the well-progressing cost saving initiatives. EBIT1 margin was 9.8% (Q3/22: 8.0%).
In Q1-3/23, EBIT1 of the Growth Vectors increased by 3% (constant currency: 4%) to €288 million (Q1-3/22: €279 million) with a margin1 of 9.1% (Q1-3/22: 9.4%).
EBIT1 in the Pharma business increased by 2% (constant currency: 9%) to €200 million (Q3/22: €197 million) due to the well-progressing cost saving initiatives. EBIT1 margin was 21.3% (Q3/22: 19.8%). In Q1-3/23, EBIT1 in the Pharma business increased by 4% (constant currency: 7%) to €603 million (Q1-3/22: €579 million) with a margin1 of 21.3% (Q1-3/22: 20.4%).
Net income1,2 increased by 3% (constant currency: 7%) to €189 million (Q3/22: €184 million). In Q1-3/23, net income1,2 decreased by 3% (constant currency: -3%) to €559 million (Q1-3/22: €574 million).
1 Before special items
2 Net income attributable to shareholders of Fresenius SE & Co. KGaA.
For a detailed overview of special items please see the reconciliation tables starting page 24 of the PDF.
Operating cash flow increased to €380 million (Q3/22: €301 million) with a margin of 18.8% (Q3/22: 14.5%) mainly driven by the business performance and an improved working capital management. In Q1-3/23, operating cash flow increased to €581 million (Q1-3/22: €543 million) with a margin of 9.7% (Q1-3/22: 9.3%).
For FY/23, Fresenius Kabi expects organic revenue1 growth in a mid-single-digit percentage range. The EBIT margin2 is expected to be around 14% (structural margin band: 14% to 17%).
1 FY/22 base: €7,850 million
2 FY/22 base: EBIT margin: 13.8%, before special items; FY/23 before special items
For a detailed overview of special items please see the reconciliation tables starting page 24 of the PDF.
Operating Company Fresenius Helios
Fresenius Helios is Europe’s leading private health care provider. The company comprises Helios Germany, Helios Spain and Helios Fertility. Helios Germany operates 86 hospitals, around 240 outpatient centers, 27 occupational health centers and 6 prevention centers. Helios Spain operates 50 hospitals, around 100 outpatient centers and around 300 occupational risk prevention centers. In addition, the company is active in Latin America with 8 hospitals and as a provider of medical diagnostics. Helios Fertility offers a wide spectrum of state-of-the-art services in the field of fertility treatments.

- Strong organic revenue growth driven by healthy activity levels in Germany and Spain
- Despite usual summer effect in Spain, solid 8% EBIT1 margin supported by ongoing cost saving initiatives and Government relief funds in Germany
- Helios Fertility with strong improvement
Revenue increased by 4% (5% in constant currency) to 2,953 million (Q3/22: €2,829 million). Organic growth was 5%. Acquisitions contributed 0% to revenue growth.
In Q1-3/23, revenue increased by 5% (6% in constant currency) to €9,132 million (Q1-3/22: €8,685 million). Organic growth was 6%. Acquisitions contributed 0% to revenue growth.
Revenue of Helios Germany increased by 4% (organic growth: 4%) to €1,800 million (Q3/22: €1,731 million), mainly driven by increasing admissions and positive price mix effects. In Q1-3/23, revenue of Helios Germany increased by 3% (organic growth: 3%) to €5,451 million (Q1-3/22: €5,272 million).
1 Before special items
2 Net income attributable to shareholders of Fresenius SE & Co. KGaA
For a detailed overview of special items please see the reconciliation tables starting page 24 of the PDF.
Revenue of Helios Spain increased by 5% (5% in constant currency) to €1,088 million (Q3/22: €1,037 million) driven by ongoing good activity levels despite the usual summer effect in Spain. The clinics in Latin America also showed a good performance. Organic growth was 5%. In Q1-3/23, revenue of Helios Spain increased by 8% (9% in constant currency) to €3,481 million (Q1-3/21: €3,227 million).
Revenue of Helios Fertility increased by 3% (11% in constant currency) to €64 million (Q3/22: €62 million) driven by positive mix effects. Organic growth was 10%. In Q1-3/23, revenue of Helios Fertility increased by 8% (13% in constant currency) to €198 million (Q1-3/22: €184 million).
EBIT1 of Fresenius Helios increased by 8% (8% in constant currency) to €239 million (Q3/22: €222 million) with an EBIT margin1 of 8.1% (Q3/22: 7.8%).
In Q1-3/23, EBIT1 increased by 4% (4% in constant currency) to €861 million (Q1-3/22: €831 million) with an EBIT margin1 of 9.4% (Q1-3/22: 9.6%).
EBIT1 of Helios Germany increased by 11% to €157 million (Q3/22: €141 million) with an EBIT margin1 of 8.7% (Q3/22: 8.1%). The EBIT development was supported by the well progressing cost savings program and the Government compensation for higher energy costs. In Q1-3/23, EBIT1 of Helios Germany increased by 4% to €466 million (Q1-3/22: €449 million) with an unchanged EBIT margin1 at 8.5%.
EBIT1 of Helios Spain decreased by 2% due to the usual summer effect (-2% in constant currency) to €81 million (Q3/22: €83 million). The EBIT margin1 was 7.4% (Q3/22: 8.0%). In Q1-3/23, EBIT1 of Helios Spain increased by 2% (3% in constant currency) to €392 million (Q1-3/22: €384 million). The EBIT margin1 was 11.3% (Q1-3/22: 11.9%).
1 Before special items
For a detailed overview of special items please see the reconciliation tables starting page 24 of the PDF.
EBIT1 of Helios Fertility was €5 million (Q3/22: €4 million) with an EBIT margin1 of 7.8% (Q3/22: 6.5%). In Q1-3/23, EBIT1 of Helios Fertility was €16 million (Q1-3/22: €15 million) with an EBIT margin1 of 8.1% (Q1-3/22: 8.2%).
Net income1,2 decreased by 4% (-4% in constant currency) to €132 million (Q3/22: €138 million).
In Q1-3/23, net income1,2 decreased by 5% (-4% in constant currency) to €505 million (Q1-3/22: €530 million).
Operating cash flow decreased to €208 million (Q3/22: €353 million) mainly due to phasing effects of receivables in Spain and the very good cashflow in the prior year. The operating cash flow margin was 7.0% (Q3/22: 12.5%).
In Q1-3/23, operating cash flow decreased to €377 million (Q1-3/22: €411 million) with a margin of 4.1% (Q1-3/22: 4.7%).
For FY/23, Fresenius Helios expects organic revenue3 growth in a mid-single-digit percentage range. The EBIT margin4 is expected to be within the structural margin band of 9% to 11%.
1 Before special items
2 Net income attributable to shareholders of Fresenius SE & Co. KGaA
3 FY/22 base: €11,716 million
4 FY/22 base: EBIT margin: 10.1%, before special items, FY/23 before special items
For a detailed overview of special items please see the reconciliation tables starting page 24 of the PDF.
Investment Company Fresenius Vamed
Fresenius Vamed internationally manages projects and provides services for hospitals and other health care facilities and is a leading post-acute care provider in Central Europe. The portfolio ranges along the entire value chain: from project development, design planning, medical and hospital engineering as well as construction, via maintenance and technical management to total operational management and high-end services.

- Fresenius Vamed’s transformation with good progress
- Revenue growth driven by Service and Project business
- EBIT1 back to positive driven by the positive development at the Service business
Revenue increased by 13% (13% in constant currency) to €647 million (Q3/22: €572 million). Organic growth was 13%.
In Q1-3/23, revenue increased by 7% (7% in constant currency) to €1,761 million (Q1-3/22: €1,647 million). Organic growth was 6%.
Revenue in the service business increased by 9% (9% in constant currency) to €456 million (Q3/22: €418 million) due to the positive development of High-End Services (HES) and Health Facility Operations (HFO) business.
In Q1-3/23, revenue in the service business increased by 8% (7% in constant currency) to €1,335 million (Q1-3/22: €1,240 million).
1 Before special items
2 Net income attributable to shareholders of VAMED AG
For a detailed overview of special items please see the reconciliation tables starting page 24 of the PDF.
Revenue in the project business increased by 24% (24% in constant currency) to €191 million (Q3/22: €154 million). In Q1-3/23, revenue in the project business increased by 5% (5% in constant currency) to €426 million (Q1-3/22: €407 million).
EBIT1 reflected the first results of the restructuring measures and was with €10 million back to positive (Q3/22: €10 million) driven by the good revenue development of the High-End Services and Health Facility Operations businesses. The EBIT margin1 was 1.5% (Q3/22: 1.7%). In Q1-3/23, EBIT1 decreased to -€37 million (Q1-3/22: €29 million) with an EBIT margin1 of -2.1% (Q1-3/22: 1.8%).
Net income1,2 decreased to -€7 million (Q3/22: €5 million).
In Q1-3/23, net income1,2 decreased to -€74 million (Q1-3/22: €15 million).
Order intake was €40 million (Q3/22: €153 million). As of September 30, 2023, order backlog was at €2,908 million3 (December 31, 2022: €3,689 million).
Operating cash flow increased to €50 million (Q3/22: -€18 million) with a margin of 7.7% (Q3/22: -3.1%) due to positive phasing effects. In Q1-3/23, operating cash flow improved to -€16 million (Q1-3/22: -€56 million) with a margin of -0.9% (Q1-3/22: -3.4%).
In Q3/23, further progress in the transformation of Fresenius Vamed was achieved. With a positive EBIT of €10 million in Q3/23, Fresenius Vamed is ahead of its originally expected target for Q3/23. For Q4/23, a further solid development is expected. For FY/2023, Fresenius Vamed confirms the outlook and expects organic revenue4 to grow in a low-to mid-single digit percentage range. The EBIT margin5 is expected to be clearly below the structural margin band of 4% to 6%.
1 Before special items
2 Net income attributable to shareholders of VAMED AG
3 Thereof conditionally agreed order backlog of €839 million
4 FY/22 base: €2,359 million
5 FY/22 base: EBIT margin: 0.8%, before special items; FY/23 before special items
For a detailed overview of special items please see the reconciliation tables starting page 24 of the PDF.
Conference Call and Webcast
As part of the publication of the results for Q3/23, a conference call will be held on November 2, 2023 at 1:30 p.m. CET (8:30 a.m. EDT). All investors are cordially invited to follow the conference call in a live broadcast over the Internet at www.fresenius.com/investors. Following the call, a replay will be available on our website.
For additional information on the performance indicators used please refer to our website https://www.fresenius.com/alternative-performance-measures.
This release contains forward-looking statements that are subject to various risks and uncertainties. Future results could differ materially from those described in these forward-looking statements due to certain factors, e.g. changes in business, economic and competitive conditions, regulatory reforms, results of clinical trials, foreign exchange rate fluctuations, uncertainties in litigation or investigative proceedings, the availability of financing and unforeseen impacts of international conflicts. Fresenius does not undertake any responsibility to update the forward-looking statements in this release.
- Excellent Group revenue growth of 7% in constant currency to €10.4 billion; Operating Companies with very strong 8% organic growth
- Group EBIT increased 15%1 in constant currency reflecting strong performance of Operating Companies and operational turnaround at Fresenius Medical Care
- Fresenius Kabi’s EBIT margin within structural band at 14.2% driven by operating leverage and well progressing cost savings
- Fresenius Helios with very strong organic revenue growth of 7% driven primarily by excellent activity levels in Spain
- Structural productivity savings ramping up, ~€280 million already achieved in H1/23
- Deconsolidation of Fresenius Medical Care on track with overwhelmingly positive votes at Extraordinary General Meeting
- Fresenius Vamed’s transformation initiated
- Group revenue outlook excluding Fresenius Medical Care improved, Group EBIT outlook excluding Fresenius Medical Care confirmed
If no timeframe is specified, information refers to Q2/2023.
1 According to FY/23 guidance, excluding Provider Relief Fund (PRF) at Fresenius Medical Care. In 2022, Fresenius Medical Care’s EBIT was supported by €277 million (H1/22: €177 million and Q2/22: €161 million) of Provider Relief Funding from the U.S. government (at current currency). Accordingly, the 2022 basis was adjusted. There is no additional U.S. governmental support assumed for 2023.

1 Before special items, Q1/22 and H1/22 restated following remeasurement Humacyte investment
2 According to FY/23 guidance, excluding Provider Relief Fund (PRF) at Fresenius Medical Care
3 Before special items
For a detailed overview of special items please see the reconciliation tables starting page 27 of the PDF.
Michael Sen, CEO of Fresenius: “We are keeping a quick and consistent pace in implementing our #FutureFresenius program. And the effects are becoming tangible. Our Operating Companies, Fresenius Helios and Fresenius Kabi, have top market positions, and are bringing innovations to patients every day. Both delivered solid second quarter results, including stronger than expected revenue growth. Both are within their respective margin bands, which we established earlier this year as part of our new financial framework. At Fresenius Medical Care, we also saw a positive business development in the second quarter. On July 14, at the Extraordinary General Meeting, shareholders overwhelmingly approved the deconsolidation of Fresenius Medical Care, paving the way for a new chapter. The challenges at our Investment Company, Vamed, are being dealt with rapidly, and we have initiated a comprehensive transformation to realign the company.”
Group simplification progresses well
The deconsolidation of Fresenius Medical Care is moving ahead as planned. At the Extraordinary General Meeting (EGM) on July 14, 2023, more than 99% of Fresenius Medical Care’s shareholders voted in favor for the conversion of Fresenius Medical Care from the legal form of a partnership limited by shares (Kommanditgesellschaft auf Aktien, KGaA) into a German stock corporation (Aktiengesellschaft, AG). In its constituting meeting following the EGM, the new Supervisory Board elected Fresenius Group CEO Michael Sen as its Chair, as well as Fresenius Group CFO Sara Hennicken as its Deputy Chair. This is a testament to Fresenius’ close relationship with Fresenius Medical Care and its continued commitment to the Company. The simplified structure will lead, among others, to a more efficient and faster decision-making as it allows for a clearer focus on the interests of the Fresenius Medical Care group and frees up management resources. Fresenius Medical Care will also have greater flexibility concerning its financial strategy. Subject to the registration with the commercial register, the conversion is expected to become effective by the end of the 2023.
Transformation Fresenius Vamed
Following the continued negative business performance, Fresenius announced as part of the presentation of the Q1/23 results, plans for an in-depth analysis of Fresenius Vamed’s business model, its governance and relevant processes. At the same time, a comprehensive and far-reaching restructuring program has been initiated with the clear goal to increase the company’s profitability. Also, a comprehensive reassessment of the company organization was initiated which led to the reorganization of the VAMED management already at the end of June. The new Fresenius Management Board member Dr. Michael Moser will be responsible for Fresenius Vamed. The control function of the VAMED Supervisory Board was strengthened through new appointments and the establishment of an Audit Committee consisting of Sara Hennicken as Chair and Dr. Michael Moser as Deputy Chair, among others.
The restructuring program aims to adjust Fresenius Vamed’s project business, especially in Germany. Moreover, the withdrawal of non-core service businesses in main markets outside Europe is intended. This includes the redimensioning of activities, and associated with this, achieving a significantly lower risk profile. In the future, Fresenius Vamed will focus on attractive businesses comprising:
- Health Facility Operations (HFO) centered on inpatient and outpatient rehabilitation and nursing
- High-End Services (HES) for hospitals focused on the management of medical equipment, hospital operating technology and sterile supplies
- Health Tech Engineers (HTE) covering the project business for the healthcare sector
In Q2/23, negative one-time items for closing down activities resulting in write-downs and provisions of €332 million were booked which are predominantly non-cash items. For further potential asset re-valuations, charges for discontinued business activities as well as restructuring costs additional around €200 million to €250 million are anticipated as of today. Thereof, approximately €60 million to 80 million cash-effective restructuring costs are anticipated.
The operational turnaround is expected for the second half of 2023, with sequential improvement in Q3/23 and a positive EBIT in Q4/23. This recovery is mainly driven by the service business HES and the HFO business. By 2025, Fresenius Vamed is expected to reach the structural EBIT margin band of 4% to 6% set out in the #FutureFresenius Financial Framework.
Structural productivity improvements well advancing
The groupwide cost savings program is well progressing with Fresenius Medical Care and Fresenius Kabi being the largest contributors. Under the program, ~€280 million of structural cost savings at EBIT level were already achieved in H1/23, that is around 55% of the planned savings for 2023. In the same period, one-time costs of ~€110 million incurred to achieve these savings. These are treated as special items. Fresenius Medical Care realized ~€75 million of cost savings in Q2/23 and invested €25 million in the same period.
FY/23 Group guidance excluding Fresenius Medical Care
With the positive vote of Fresenius Medical Cares’ shareholders in favor of the change of legal form, the structural simplification of the Fresenius Group has passed a major milestone. In order to reflect the deconsolidation of Fresenius Medical Care already now, Fresenius will provide the Group guidance for the fiscal year 2023 from now on solely excluding Fresenius Medical Care. This is a further step towards the implementation of #FutureFresenius, where Fresenius Medical Care will no longer be part of Fresenius' fully consolidated subsidiaries.
For 2023, Fresenius expects Group organic revenue1 excluding Fresenius Medical care to grow in a mid-single-digit percentage range. Constant currency Group EBIT1 excluding Fresenius Medical Care is expected to remain broadly flat or decline up to a mid-single-digit percentage rate.
Fresenius expects the net debt/EBITDA3 ratio excluding Fresenius Medical Care to be below 4.0x by the end of 2023, therefore improving from 4.19x4 as of June 30, 2023 (December 31, 2022: 3.80x4). This assumption does not include potential divestment activities. The self-imposed target corridor for the leverage ratio remains unchanged at 3.0x to 3.5x.
1 FY/22 base: €21,532 million2 FY/22 base: €2,187 million, before special items; FY/23: before special items3 At LTM average exchange rates for both net debt and EBITDA; pro forma closed acquisitions/divestitures; excluding further potential acquisitions/divestitures; before special items; including lease liabilities4 At LTM average exchange rates for both net debt and EBITDA; pro forma closed acquisitions/divestitures; before special items; including lease liabilities
For a detailed overview of special items please see the reconciliation tables starting page 27 of the PDF.
Assumptions for guidance FY/23
For 2023, Fresenius assumes no further escalations of geopolitical tensions and challenges from COVID-19, and supply chain constraints continuing to ease. Fresenius expects that the general cost inflation will have a more negative effect on its business than in 2022 due to the annualization effect of cost increases occurred in H2/2022.
Fresenius will continue to closely monitor the potential further consequences of the ongoing challenging macroeconomic environment, including balance sheet valuations.
All of these assumptions are subject to considerable uncertainty.
7% revenue increase in constant currency
Group revenue increased by 3% (7% in constant currency) to €10,359 million (Q2/22: €10,018 million). Organic growth was 6%. Acquisitions/divestitures contributed net 1% to growth. In total, currency translation had a negative effect of 4% on revenue growth. The Operating Companies increased revenue by 6% (9% in constant currency). Excluding Fresenius Medical Care, Group revenue increased by 5% (7% in constant currency) to €5,557 million (Q2/22: €5,284 million).
In H1/23, Group revenue increased by 4% (6% in constant currency) to €20,584 million (H1/22: €19,738 million). Organic growth was 5%. Acquisitions/divestitures contributed net 1% to growth. Currency translation decreased revenue growth by 2%. The Operating Companies increased revenue by 6% (7% in constant currency) in H1/23. Excluding Fresenius Medical Care, Group revenue increased by 6% (7% in constant currency) to €11,103 million (H1/22: €10,476 million).
15 %1 EBIT2 increase in constant currency
Group EBITDA before special items decreased by 2% (0% in constant currency) to €1,649 million (Q2/222: €1,682 million). Reported Group EBITDA was €1,247 million (Q2/22: €1,528 million). In H1/23, Group EBITDA before special items decreased by 3% (-3% in constant currency) to €3,234 million (H1/222: €3,344 million). Reported Group EBITDA was €2,738 million (H1/22: €3,123 million).
Group EBIT before special items and excluding Provider Relief Fund (PRF) increased by 15%1 in constant currency. The EBIT increase was driven by Fresenius Medical Care, and the Operating Companies compensating successfully inflationary headwinds. The Operating Companies showed an EBIT increase of 5% and an EBIT margin of 11.3%. Group EBIT before special items decreased by 5% (-4% in constant currency) to €956 million (Q2/222: €1,003 million) mainly driven by the negative earnings performance at Fresenius Vamed. The EBIT margin before special items was 9.2% (Q2/222: 10.0%). Reported Group EBIT was €543 million (Q2/22: €845 million). Excluding Fresenius Medical Care, Group EBIT before special items decreased by 1% (0% in constant currency) to €555 million (Q2/222: €558 million). The EBIT margin excluding Fresenius Medical Care before special items was 10.0% (Q2/222: 10.6%).
In H1/23, Group EBIT before special items excluding Provider Relief Fund (PRF) increased by 2%1 in constant currency. The Operating Companies increased EBIT by 2% with a margin of 11.4%. Group EBIT before special items decreased by 7% (-7% in constant currency) to €1,864 million (H1/222: €2,003 million). The EBIT margin before special items was 9.1% (H1/222: 10.1%). Reported Group EBIT was €1,330 million (H1/22: €1,747 million). Excluding Fresenius Medical Care, Group EBIT before special items decreased by 4% (-4% in constant currency) to €1,109 million (H1/222: €1,151 million). The EBIT margin excluding Fresenius Medical Care before special items was 10.0% (H1/222: 11.0%).
Group net interest before special items increased to -€184 million (Q2/222: -€116 million) mainly due to financing activities in a higher interest rate environment. Reported Group net interest was -€184 million (Q2/22: -€116 million). In H1/23, Group net interest before special items increased to -€354 million (H1/222: -€235 million). Reported Group net interest was -€354 million (H1/22: -€234 million).
Group tax rate before special items increased to 27.3% (Q2/222: 23.0%) mainly due to the increase in the proportionate share of non-tax-deductible expenses compared to taxable income at Fresenius Medical Care as well as to the non-recognition of increased tax loss carry forwards at Fresenius Vamed. Reported Group tax rate was 53.8% (Q2/22: 22.6%). In H1/23, Group tax rate before special items was 26.2% (H1/222: 22.9%) while the reported Group tax rate was 35.6% (H1/22: 23.1%).
1According to FY/23 guidance, excluding Provider Relief Fund (PRF) at Fresenius Medical Care
2 Before special itemsFor a detailed overview of special items please see the reconciliation tables starting page 27 of the PDF.
Noncontrolling interests before special items were -€186 million (Q2/222: -€233 million) of which 93% were attributable to the noncontrolling interests in Fresenius Medical Care. Reported noncontrolling interests were -€86 million (Q2/22: -€181 million). In H1/23, Noncontrolling interests before special items were -€351 million (H1/222: -€451 million) of which 93% were attributable to the noncontrolling interests in Fresenius Medical Care. Reported noncontrolling interests were -€203 million (H1/22: -€367 million).
Group net income1 before special items decreased by 17% (-17% in constant currency) to €375 million (Q2/222: €450 million). The decrease was driven by cost inflation and the negative earnings development at Fresenius Vamed. Moreover, rising interest costs and a higher tax rate weighed on the net income development. Reported Group net income1 decreased to €80 million (Q2/22: €383 million). Excluding Fresenius Medical Care, Group net income1 before special items decreased by 17% (-17% in constant currency) to €375 million (Q2/222: €450 million).
In H1/23, Group net income1 before special items decreased by 16% (-17% in constant currency) to €764 million (H1/222: €913 million). Reported Group net income2 decreased to €426 million (H1/22: €796 million). Excluding Fresenius Medical Care, Group net income1 before special items decreased by 16% (-17% in constant currency) to €764 million (H1/222: €796 million).
Earnings per share1 before special items decreased by 17% (-17% in constant currency) to €0.67 (Q2/222: €0.80). Reported earnings per share1 were €0.15 (Q2/22: €0.68).
In H1/23, earnings per share1 before special items decreased by 17% (-17% in constant currency) to €1.36 (H1/222: €1.63). Reported earnings per share1 were €0.76 (H1/22: €1.42).
1 Net income attributable to shareholders of Fresenius SE & Co. KGaA
2 Before special items
For a detailed overview of special items please see the reconciliation tables starting page 27 of the PDF.
Investments
Spending on property, plant and equipment was €396 million corresponding to 4% of revenue (Q2/22: €419 million; 4% of revenue). These investments served primarily for the modernization and expansion of dialysis clinics, production facilities as well as hospitals and day clinics. Excluding Fresenius Medical Care, spending on property, plant and equipment was €240 million corresponding to 4% of revenue (Q2/22: €247 million; 5% of revenue).
In H1/23, spending on property, plant and equipment was €749 million corresponding to 4% of revenue (H1/22: €757 million; 4% of revenue). Excluding Fresenius Medical Care, spending on property, plant and equipment was €451 million corresponding to 4% of revenue (H1/22: €423 million; 4% of revenue).
Total acquisition spending was €27 million (Q2/22: €291 million) mainly for investments in debt instruments at Fresenius Medical Care. Excluding Fresenius Medical Care, total acquisition spending was €0 million (Q2/22: €224 million).
In H1/23, total acquisition spending was €95 million (H1/22: €453 million). Excluding Fresenius Medical Care, total acquisition spending was €18 million (H1/22: €303 million).
Cash flow development
Group operating cash flow increased to €1,186 million (Q2/22: €1,017 million) driven by the good cash flow development at Fresenius Medical Care and Fresenius Kabi. This was partly offset by the negative earnings development at Fresenius Vamed. Group operating cash flow margin was 11.4% (Q2/22: 10.2%). Free cash flow before acquisitions and dividends increased to €791 million (Q2/22: €581 million). Free cash flow after acquisitions and dividends increased to -€30 million (Q2/22: -€391 million). Excluding Fresenius Medical Care, Group operating cash flow decreased to €285 million (Q2/22: €393 million).
In H1/23, Group operating cash flow increased to €1,361 million (H1/22: €1,118 million) with a margin of 6.6% (H1/22: 5.7%). Free cash flow before acquisitions and dividends increased €614 million (H1/22: €326 million). Free cash flow after acquisitions and dividends increased to -€311 million (H1/22: -€794 million).
Excluding Fresenius Medical Care, Group operating cash flow decreased to €317 million (H1/22: €335 million).
The cash conversion rate (CCR), which is defined as the ratio of adjusted free cash flow1 to EBIT before special items, was 0.8 (LTM: 1.2) in H1/23. Excluding Fresenius Medical Care, the cash conversion rate in H1/23 was 0.3 (LTM: 1.0).
1 Cash flow before acquisitions and dividends; before interest, tax, and special items
Solid balance sheet structure
Group total assets remained nearly unchanged compared to FY/22 (1% in constant currency) at €76,413 million (Dec. 31, 2022: €76,415 million). Current assets increased by 6% (7% in constant currency) to €19,305 million (Dec. 31, 2022: €18,279 million), mainly driven by the business expansion related increase of trade account receivables and inventories. Non-current assets decreased by 2% (0% in constant currency) to €57,108 million (Dec. 31, 2022: €58,136 million).
Total shareholders’ equity decreased by 2% (0% in constant currency) to €31,430 million (Dec. 31, 2022: €32,218 million). The equity ratio was 41.1% (Dec. 31, 2022: 42.2%).
Group debt increased by 2% (2% in constant currency) to €28,183 million (Dec. 31, 2022: € 27,763 million). Group net debt increased by 3% (3% in constant currency) to € 25,712 million (Dec. 31, 2022: € 25,014 million).
Group debt excluding Fresenius Medical Care increased by 4% (4% in constant currency) to €15,271 million (Dec. 31, 2022: € 14,708 million). Group net debt excluding Fresenius Medical Care increased by 6% (6% in constant currency) to € 14,162 million (Dec. 31, 2022: €13.307 million).
As of June 30, 2023, the net debt/EBITDA ratio was 3.88x1,2,3 (Dec. 31, 2022: 3.65x1,2) mainly driven by lower EBITDA contribution at Fresenius Medical Care and Fresenius Vamed, and higher net debt. Excluding Fresenius Medical Care, the net debt/EBITDA ratio was 4.19x1,2 (Dec. 31, 2022: 3.80x1,2).
In Q2/23, ROIC was 4.6% due to the lower EBIT (Q4/22: 5.1%). Excluding Fresenius Medical Care, the ROIC was 5.0% (Q4/22: 5.6%).
1 At LTM average exchange rates for both net debt and EBITDA; pro forma closed acquisitions/divestitures
2 Before special items
3 Fresenius Medical Care: Includes debt & lease liabilities included within the balance sheet line item “Liabilities directly associated with assets held for sale” as well as cash & cash equivalents included within “Assets held for sale”.
For a detailed overview of special items please see the reconciliation tables starting page 27 of the PDF.
Business Segments – Operating Companies
Fresenius Kabi
Fresenius Kabi specializes in products for the therapy and care of critically and chronically ill patients. The portfolio includes biopharmaceuticals, clinical nutrition, MedTech products, intravenously administered generic drugs (generic IV drugs), and IV fluids. ,
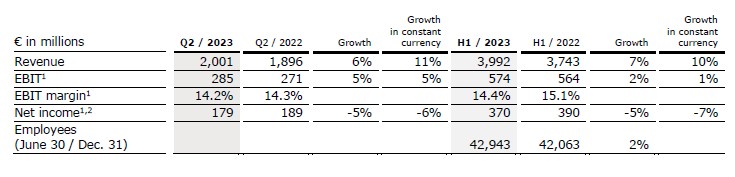
- Growth vectors with very strong double-digit organic revenue growth
- Pharma showing accelerated sequential growth
- EBIT margin1 in structural margin band
Revenue increased by 6% (11% in constant currency) to €2,001 million (Q2/22: €1,896 million) mainly driven by the strong business development of all growth vectors. Organic growth was 8%.
In H1/23, revenue increased by 7% (10% in constant currency) to €3,992 million (H1/22: €3,743 million). Organic growth was 8%.
Revenue of the Growth Vectors (MedTech, Nutrition and Biopharma) increased by 10% (organic growth: 12%) to €1,062 million (Q2/22: €961 million).
In H1/23, revenue of the Growth Vectors increased by 11% (organic growth: 11%) to €2,113 million (H1/22: €1,903 million).
Revenue in MedTech increased by 6% (organic growth: 9%) to €365million (Q2/22: €345 million) driven by, amongst others, the good business development in Transfusion Medicine and Cell Therapies (TCT) as well as by successful product rollouts. In H1/23, revenue in MedTech increased by 8% (organic growth: 9%) to €744 million (H1/22: €687 million).
1 Before special items
2 Net income attributable to shareholders of Fresenius SE & Co. KGaA
For a detailed overview of special items please see the reconciliation tables starting page 27 of the PDF.
Revenue in Nutrition increased by 5% (organic growth: 13%) to €614 million (Q2/22: €587 million) mainly driven by the good business development in Latin America and the further improving situation in China.
In H1/23, revenue in Nutrition increased by 4% (organic growth: 11%) to €1,216 million (H1/22: €1,164 million).
Revenue in Biopharma increased by 188% (organic growth: 34%) to €83 million (Q2/22: €29 million) mainly driven by successful product launches in Europe, the U.S., and Latin America.
In H1/23, revenue in Biopharma increased by 196% (organic growth: 44%) to €153 million (H1/22: €52 million).
Revenue in the Pharma (IV Drugs & Fluids) business increased by 2% (organic growth: 6%) to €952 million (Q2/22: €935 million). The revenue increase is driven by the positive business development in both product segments.
In H1/23, revenue in the Pharma business increased by 3% (organic growth: 5%) to €1,892 million (H1/22: €1,840 million).
EBIT1 of Fresenius Kabi increased by 5% (5% in constant currency) to €285 million (Q2/22: €271 million) due to the good operating performance and the well-progressing cost saving initiatives. EBIT margin1 was 14.2% (Q2/22: 14.3%) and thus within the structural EBIT margin band.
In H1/23, EBIT1 increased by 2% (1% in constant currency) to €574 million (H1/22: €564 million) EBIT margin1 was 14.4% (H1/22: 15.1%).
EBIT1 of the Growth Vectors increased by 9% (12% in constant currency) to €88 million (Q2/22: €81 million) due to the excellent revenue development and the well-progressing cost saving initiatives. EBIT1 margin was 8.3% (Q2/22: 8.4%).
In H1/23, EBIT1 of the Growth Vectors decreased by 5% (-5% in constant currency) to €184 million (H1/22: €193 million) with a margin1 of 8.7% (H1/22: 10.1%).
1 Before special items
For a detailed overview of special items please see the reconciliation tables starting page 27 of the PDF.
EBIT1 in the Pharma business increased by 4% (7% in constant currency) to €206 million (Q2/22: €198 million) due to the solid revenue development and the well-progressing cost saving initiatives. EBIT1 margin was 21.6% (Q2/22: 21.1%).
In H1/23, EBIT1 in the Pharma business increased by 5% (5% in constant currency) to €403 million (H1/22: €383 million) with a margin1 of 21.3% (H1/22: 20.8%).
Net income1,2 decreased by 5% (-6% in constant currency) to €179 million (Q2/22: €189 million).
In H1/23, net income1,2 decreased by 5% (-7% in constant currency) to €370 million (H1/22: €390 million).
Operating cash flow increased to €180 million (Q2/22: €109 million) with a margin of 9.0% (Q2/22: 5.7%) mainly driven by an improved working capital management.
In H1/23, operating cash flow decreased to €201 million (H1/22: €242 million) with a margin of 5.0% (H1/22: 6.5%).
For FY/23, Fresenius Kabi expects organic revenue3 growth in a mid-single-digit percentage range. The EBIT margin4 is expected to be around 14% (structural margin band: 14% to 17%).
1 Before special items
2 Net income attributable to shareholders of Fresenius SE & Co. KGaA.
3 FY/22 base: €7,850 million
4 FY/22 base: EBIT margin: 13.8%, before special items; FY/23 before special items
For a detailed overview of special items please see the reconciliation tables starting page 27 of the PDF.
Fresenius Helios
Fresenius Helios is Europe's leading private health care provider. The company comprises Helios Germany, Helios Spain and Helios Fertility. Helios Germany operates 87 hospitals, around 240 outpatient centers, 27 occupational health centers and 6 prevention centers. Helios Spain operates 50 hospitals, around 100 outpatient centers and around 300 occupational risk prevention centers. In addition, the company is active in Latin America with 8 hospitals and as a provider of medical diagnostics. Helios Fertility offers a wide spectrum of state-of-the-art services in the field of fertility treatments.
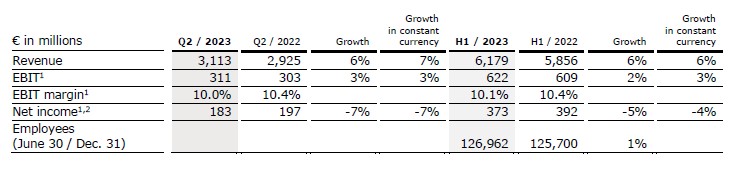
- Fresenius Helios with excellent organic revenue growth driven by high activity levels at Helios Spain including Latin America
- Helios Germany with solid top-line development supported by more complex treatments
- EBIT margin1 well in structural margin band due to ongoing successful measures to counter inflationary headwinds
- Helios Fertility with solid operating performance
Revenue increased by 6% (7% in constant currency) to €3,113 million (Q2/22: €2,925 million). Organic growth was 7%. Acquisitions contributed 0% to revenue growth.
In H1/23, revenue increased by 6% (6% in constant currency) to €6,179 million (H1/22: €5,856 million). Organic growth was 6%. Acquisitions contributed 0% to revenue growth.
Revenue of Helios Germany increased by 4% (organic growth: 4%) to €1,823 million (Q2/22: €1,758 million), mainly driven by increasing admissions and positive mix effects supported by an increase of complex treatments.
In H1/23, revenue of Helios Germany increased by 3% (organic growth: 3%) to €3,651 million (H1/22: €3,541 million).
1 Before special items
2 Net income attributable to shareholders of Fresenius SE & Co. KGaA
For a detailed overview of special items please see the reconciliation tables starting page 27 of the PDF.
Revenue of Helios Spain increased by 11% (12% in constant currency) to €1,223 million (Q2/22: €1,101 million). Organic growth of 12% was driven by ongoing high activity levels. The clinics in Latin America also showed a good performance.
In H1/23, revenue of Helios Spain increased by 9% (11% in constant currency) to €2,393 million (H1/21: €2,190 million).
Revenue of Helios Fertility increased by 5% (11% in constant currency) to €68 million (Q2/22: €65 million) driven by mix effects.
In H1/23, revenue of the Helios Fertility were €134 million (H1/22: €122 million).
EBIT1 of Fresenius Helios increased by 3% (3% in constant currency) to €311 million (Q2/22: €303 million) with an EBIT margin1 of 10.0% (Q2/22: 10.4%).
In H1/23, EBIT1 increased by 2% (3% in constant currency) to €622 million (H1/22: €609 million) with an EBIT margin1 of 10.1% (H1/22: 10.4%).
EBIT1 of Helios Germany remained stable at €154 million (Q2/22: €154 million) with an EBIT margin1 of 8.4% (Q2/22: 8.8%).
In H1/23, EBIT1 of Helios Germany increased to €309 million (H1/22: €308 million) with an EBIT margin1 of 8.5% (H1/22: 8.7%).
EBIT1 of Helios Spain increased due to the strong revenue growth and despite cost inflation by 4% (5% in constant currency) to €154 million (Q2/22: €148 million). The EBIT margin1 was 12.6% (Q2/22: 13.4%).
In H1/23, EBIT1 of Helios Spain increased by 3% (5% in constant currency) to €311 million (H1/22: €301 million). The EBIT margin1 was 13.0% (H1/22: 13.7%).
EBIT1 of Helios Fertility was €7 million (Q2/22: €7 million) with an EBIT margin1 of 10.3% (Q2/22: 10.8%).
In H1/23, EBIT1 of Helios Fertility was €11 million (H1/22: €11 million) with an EBIT margin1 of 8.2% (H1/22: 9.0%).
Net income1,2 decreased by 7% (-7% in constant currency) to €183 million (Q2/22: €197 million).
In H1/23, net income1,2 decreased by 5% (-4% in constant currency) to €373 million (H1/22: €392 million).
Operating cash flow decreased to €61 million (Q2/22: €194 million) mainly due to delays in the budget negotiations in Germany leading to higher receivables at Helios Germany. The operating cash flow margin was 2.0% (Q2/22: 6.6%).
In H1/23, operating cash flow increased to €169 million (H1/22: €58 million) with a margin of 2.7% (H1/22: 1.0%).
For FY/23, Fresenius Helios expects organic revenue3 growth in a mid-single-digit percentage range. The EBIT margin4 is expected to be within the structural margin band of 9% to 11%.
1 Before special items
2 Net income attributable to shareholders of Fresenius SE & Co. KGaA
3 FY/22 base: €11,716 million
4 FY/22 base: EBIT margin: 10.1%, before special items, FY/23 before special items
For a detailed overview of special items please see the reconciliation tables starting page 27 of the PDF.
Business Segments – Investment Companies
Fresenius Medical Care
(Financial data according to Fresenius Medical Care press release)
Fresenius Medical Care is the world's largest provider of products and services for individuals with renal diseases. As of June 30, 2023, Fresenius Medical Care was treating approximately 344,000 patients in 4,050 dialysis clinics. Dialyzers and dialysis machines are among the most important product lines. In addition, Fresenius Medical Care offers dialysis-related services.
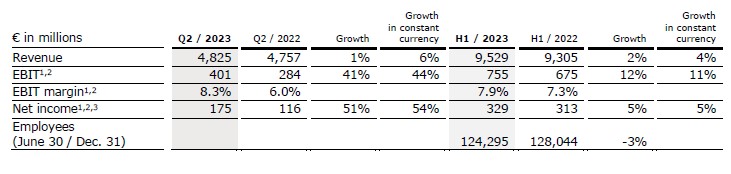
- Fresenius Medical Care successfully executes strategic plan
- Organic growth accelerated in the second quarter in Care Enablement and Care Delivery
- Savings resulting from FME25 transformation program fully on track
- Legal form conversion to a German Stock Corporation approved by shareholders
- FY 2023 operating income guidance range narrowed
Revenue increased by 1% to €4,825 million (+6% in constant currency, organic: +6%). In H1/23, revenue increased by 2% (4% in constant currency) to €9,529 million (H1/22: €9,305 million).
EBIT increased by 5% (5% in constant currency) to €357 million (Q2/22: €341 million), resulting in a margin of 7.4% (Q2/22: 7.2%). EBIT excluding special items and U.S. Provider Relief Funding (PRF) increased by 41% to €401 million (44% in constant currency), resulting in a margin of 8.3% (Q2/22: 6.0%).
1 Before special items2 According to FY/23 guidance, excluding Provider Relief Fund (PRF) at Fresenius Medical Care3 Net income attributable to shareholders of Fresenius Medical Care AG & Co. KGaA
For a detailed overview of special items please see the reconciliation tables starting page 27 of the PDF.
In H1/23, EBIT decreased by 10% (-11% in constant currency) to €618 million (H1/22: €688 million) resulting in a margin of 6.5% (H1/22: 7.4%). EBIT excluding special items and PRF increased by 12% (11% in constant currency) to €755 million (H1/22: €675 million), resulting in a margin of 7.9% (H1/22: 7.3%).
Net income1 decreased by 5% to €140 million (-4% in constant currency). Excluding special items and PRF, net income1 increased by 51% to €175 million (54% in constant currency).
In H1/23, net income1 decreased by 26% (-26% in constant currency) to €227 million (H1/22: €305 million). Net income1 before special items and PRF increased by 5% (5% in constant currency) to €329 million (H1/22: €313 million).
In the second quarter, Fresenius Medical Care generated €1,007 million of operating cash flow (Q2/22: €751 million), resulting in a margin of 20.9% (Q2/22: 15.8%). The increase was mainly driven by the recoupment of advanced payments during 2022, which had been received in the U.S. under the Medicare Accelerated and Advance Payment Program in 2020, as well as by seasonality of invoicing. In H1/23, operating cash flow was €1,150 million (H1/22: €910 million) with a margin of 12.1% (H1/22: 9.8%).
1 Net income attributable to shareholders of Fresenius Medical Care AG & Co. KGaA
For a detailed overview of special items please see the reconciliation tables starting page 27 of the PDF.
The Company continues to expect for 2023 revenue1 to grow at a low to mid-single digit percentage rate. Based on the earnings development for the first half of the year, Fresenius Medical Care narrows its EBIT target range for 2023. The Company now expects EBIT2 to remain flat or decline by up to a low-single digit percentage rate3 (previous target: remain flat or decline by up to a high-single digit percentage rate3). The Company’s target to achieve an operating income margin of 10 to 14% by 2025 remains unchanged.
For further information, please see Fresenius Medical Care’s press release at www.freseniusmedicalcare.com.
1 FY/22 base: €19,398 million2 FY/22 base: €1,540 million3 Revenue and EBIT, as referred to in the outlook, are both on a constant currency basis and excluding special items. Special items will be provided as separate KPI (“Revenue excluding special items”, “EBIT excluding special items”) to capture effects that are unusual in nature and have not been foreseeable or not foreseeable in size or impact at the time of giving guidance. These items are excluded to ensure comparability of the figures presented with the Company’s financial targets which have been defined excluding special items.
For FY 2022, special items included costs related to the FME25 program, the impact of the war in Ukraine, the impact of hyperinflation in Turkiye, the Humacyte investment remeasurement, and the net gain related to InterWell Health. Additionally, FY 2022 basis for Outlook 2023 and 2025 was adjusted for Provider Relief Funding.
For FY 2023, special items include costs related to the FME25 program, the Humacyte investment remeasurement, the costs associated with the legal form conversion and effects from legacy portfolio optimization.
Fresenius Vamed
Fresenius Vamed manages projects and provides services for hospitals and other health care facilities worldwide and is a leading post-acute care provider in Central Europe. The portfolio ranges along the entire value chain: from project development, planning, and turnkey construction, via maintenance and technical management to total operational management.
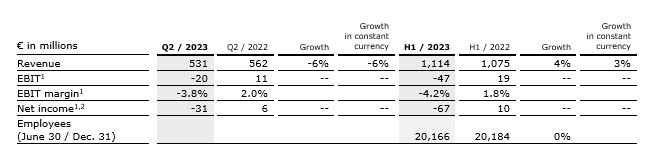
- Negative revenue growth driven by project delays and portfolio adjustments due to transformation measures
- EBIT1 negatively impacted by lower top-line and nonrecurring items
- Transformation program initiated
Revenue decreased by 6% (-6% in constant currency) to €531 million (Q2/22: €562 million). Organic growth was -7%.
In H1/23, revenue increased by 4% (3% in constant currency) to €1,114 million (H1/22: €1,075 million). Organic growth was 3%.
Revenue in the service business increased by 6% (5% in constant currency) to €443 million (Q2/22: €417 million) due to positive development of High-End Services (HES).
In H1/23, revenue in the service business increased by 7% (6% in constant currency) to €879 million (H1/22: €822 million).
Revenue in the project business decreased by 39% (-39% in constant currency) to €88 million (Q2/22: €145 million). In H1/23, revenue in the project business decreased by 7% (-7% in constant currency) to €235 million (H1/22: €253 million).
EBIT1 decreased to -€20 million (Q2/22: €11 million) with an EBIT margin1 of
-3.8% (Q2/22: 2.0%). The weak development was related to lower revenues and negative nonrecurring items. To counteract the negative EBIT development, a major transformation program was initiated.
In H1/23, EBIT1 decreased to -€47 million (H1/22: €19 million) with an EBIT margin1 of -4.2% (H1/22: 1.8%).
Net income1,2 decreased to -€31 million (Q2/22: €6 million).
In H1/23, net income1,2 decreased to -€67 million (H1/22: €10 million).
Order intake was €179 million (Q2/22: €253 million). As of June 30, 2023, order backlog was at €3,280 million3 (December 31, 2022: €3,689 million).
Operating cash flow decreased to €2 million (Q2/22: €7 million) with a margin of 0.4% (Q2/22: 1.2%) due to the negative earnings development. In H1/23, operating cash flow decreased to -€66 million (H1/22: -€38 million) with a margin of -5.9% (H1/22: -3.5%).
For FY/2023, Fresenius Vamed confirms the outlook and expects organic revenue4 to grow in a low-to mid-single digit percentage range. The EBIT margin5 is expected to be clearly below the structural margin band of 4% to 6%.
1 Before special items
2 Net income attributable to shareholders of VAMED AG
3 Thereof conditionally agreed order backlog of €1,017 million
4 FY/22 base: €2,359 million
5 FY/22 base: EBIT margin: 0.8%, before special items; FY/23 before special items
For a detailed overview of special items please see the reconciliation tables starting page 27 of the PDF.
Conference Call and Webcast
As part of the publication of the results for Q2/23, a conference call will be held on August 2, 2023 at 1:30 p.m. CEDT (7:30 a.m. EDT). All investors are cordially invited to follow the conference call in a live broadcast over the Internet at www.fresenius.com/events-and-roadshows. Following the call, a replay will be available on our website.
This release contains forward-looking statements that are subject to various risks and uncertainties. Future results could differ materially from those described in these forward-looking statements due to certain factors, e.g. changes in business, economic and competitive conditions, regulatory reforms, results of clinical trials, foreign exchange rate fluctuations, uncertainties in litigation or investigative proceedings, the availability of financing and unforeseen impacts of international conflicts. Fresenius does not undertake any responsibility to update the forward-looking statements in this release.
- Advancing patient care – Providing world-class health care products and therapies for the benefit of patients around the world
- Serving highly attractive markets – Unique platform of four leading and complementary businesses in large, growing markets positions Fresenius Kabi well to benefit from paradigm shifts in health care
- Executing Vision 2026 – Fresenius Kabi’s framework essentially contributes to the Group’s #FutureFresenius strategy with focus on clear value drivers across four businesses
- Raising Kabi outlook for 2023 – Expecting mid-single-digit organic sales growth1 (previously: growth1 in low-to mid-single-digit percentage range) and EBIT margin2 of around 14% (previously: around 1%-point below structural margin2 band of 14 to 17%)
- Improving mid-term ambition level – Targeting upper end of structural EBIT margin band of 14 to 17% by 2026
1FY/22 base: €7,850 million
2FY/22 base: EBIT margin: 13.8%, before special items; FY/23 before special items
Today, Fresenius SE is hosting a Capital Markets Day in London focused on Fresenius Kabi, a global health care company that specializes in essential health care products for critically and chronically ill patients. The Capital Markets Day is featuring Fresenius CEO Michael Sen, Fresenius Kabi CEO Pierluigi Antonelli, and Members of the Fresenius Kabi Executive Leadership Team.
During the day, Fresenius Kabi will provide insights into the execution of its framework Vision 2026, the company’s growth and sustainable value creation pathway, and the outlook for its individual businesses.
Fresenius Kabi has implemented substantial changes to strengthen the position of its three growth vectors – Biopharma, MedTech, Nutrition, and to build resilience in its Pharma business. The company has leading positions in several highly attractive markets and is poised to benefit from major paradigm shifts in biology, technology, and data. Fresenius Kabi aims to leverage its market position to be an important player in meeting the consistently growing demand of high-quality, affordable treatments.
Fresenius CEO Michael Sen opened the meeting: “Fresenius is moving ahead in its efforts to simplify, sharpen its focus and accelerate performance, all pointed at Advancing Patient Care. Fresenius Kabi – now streamlined into Pharma, Biopharma, Nutrition and MedTech activities – is key to our mission, and key to improved financial performance.”
Sen continued: “Greater transparency will enhance understanding and appreciation of Kabi’s strengths and ambitions. That is the purpose of the day. Kabi advances patient care every day, improving the treatment for the benefit of patients worldwide. It has outstanding formulations and products, a global customer and manufacturing footprint, and an exciting pipeline of new innovations. The new management team has the energy and know-how to bring all these strengths forward, and to deliver on the financial metrics we’ve set out for the Group.”
At the Capital Markets Day, the company will provide clarity on the value drivers that underpin its decision to raise Fresenius Kabi’s 2023 sales and EBIT guidance and improve its 2026 EBIT margin ambition level. For 2023, the company now expects Fresenius Kabi to grow organic sales in the mid-single digits (previously: growth1 in low- to mid-single digits percentage range) and projects EBIT margin of around 14% (previously: 1%-point below the structural 14 to 17% margin2 band). Fresenius Group guidance is unchanged. For 2026, Kabi now targets EBIT margins at the upper end of its 14 to 17% structural margin band.
1FY/22 base: €7,850 million
2FY/22 base: EBIT margin: 13.8%, before special items; FY/23 before special items
Fresenius Kabi CEO Pierluigi Antonelli said: “Fresenius Kabi is committed to the delivery of relevant and advanced treatments across our four segments. Fresenius Kabi embarked on a value creation pathway, and we have already made significant progress along that journey. Our focus across all four business units is disciplined execution and we are implementing initiatives aimed at securing sustainable and profitable long-term growth – for the good of patients, customers, and shareholders. We’ve made significant progress along that journey.
We have a strong and experienced leadership team in place with a truly unique mix of competencies, clear accountability, and a performance-oriented focus.”
Highlights of the presentations
Kabi’s new leadership team will discuss some of the organizational and operational changes being implemented and provide greater transparency on the three growth vectors (i.e., BioPharma, Nutrition and MedTech) as well as the Pharma business where the company further builds up resilience.
Rollout Nutrition – Fresenius Kabi’s Nutrition business (2022 sales of €2.4bn) focuses on the fundamentally attractive market for Parenteral Nutrition (PN) and Enteral Nutrition (EN). Kabi’s Nutrition business holds leading positions in several key regions with a broad innovative portfolio of products including multi-chamber bags, lipids, amino acids, additives, sip and tube feeds, powders, and nutritional drugs. The portfolio offers robust potential from innovative products and an improved product and market mix. The company also sees significant geographic expansion opportunities, especially in China and the U.S. market.
Sales for Nutrition are expected to grow organically by 4 to 7% p.a. over the period 2022 to 2026. Fresenius Kabi targets stable EBIT margins at high level with upside potential.
Expand on MedTech – Expecting enhanced performance and value. Kabi’s MedTech business (2022 sales of €1.4bn) comprises an Infusion & Nutrition Systems (INS) unit and a Transfusion Medicine & Cell Therapies (TCT) unit. Through INS, the company provides a range of infusion pumps, IV access systems, nutritional systems and feeding tubes. Through TCT, Kabi offers a broad portfolio of products for blood collection, apheresis, plasma processing, autotransfusions and cell therapies. MedTech holds leading TCT positions with strong growth segments such as plasma and Cell & Gene Therapies. Kabi plans to expand its INS presence in the US with the help of Ivenix, a company acquired in 2022 and is also targeting growth in the software solution business.
Sales for MedTech are targeted to grow organically by 8 to 10% p.a. over the period 2022 to 2026. For EBIT margins a strong improvement is targeted.
Broaden Biopharma – BioPharma (2022 sales €0.2bn) comprises of a rapidly growing Biosimilars business and a nascent CDMO1 unit. After a period of heavy investments in building capacity and the pipeline, Biopharma is poised for rapid growth. The company has a track record of successful market entries in Europe and countries around the world. Based on its portfolio and pipeline in Autoimmune and Anti-inflammatory Disorders (AIID) and Oncology, Kabi’s ambition is to outgrow the market. Scaling and driving vertical integration with mAbxience also offers a synergistic setup for margin improvements.
1Contract Development and Manufacturing Organization
Sales for this business are projected to triple to quadruple over the period 2022 to 2026. Fresenius Kabi expects significantly improving EBIT margins and is committed to deliver EBITDA breakeven in 2024.
Build resilience in Pharma – Kabi’s Pharma unit (2022 sales of €3.8bn) is a supplier of system-critical generic IV Drugs and Fluids in a large global market growing in the low single digits. Kabi is a leading supplier of IV drugs in anesthetics & analgesics, anti-infectives, critical care and oncology, as well as IV Fluids such as crystalloids and colloids. Kabi’s Pharma business is built on a strong footprint in attractive markets with long-standing customers and contracting expertise. The broad launch pipeline with areas of product differentiation and new molecules, covers ~80% of relevant drugs losing exclusivity (LOE) in U.S.
Sales for this business are projected to grow organically by 2 to 4% p.a. over the period 2022 to 2026. The focus for Pharma is on stable margin performance and growing earnings.
Webcast of the event:
Fresenius Kabi Capital Markets Day will be available as a webcast on the Internet at: https://www.fresenius.com/capital-markets-day. After the event, a replay will be available on our website.
- Deconsolidation of Fresenius Medical Care moving ahead as planned
- Group Revenue increased by 5% to €10.2 billion driven by a broad-based positive performance across the Group
- Group EBIT in constant currency decreased by 10%1 to €908 million in line with expectations. EBIT development of Operating Companies was broadly flat despite negative effects from inflation; Investment Companies clearly dilutive
- Fresenius Kabi with EBIT margin of 14.5% already within structural band
- Enhanced transparency with change of Fresenius Kabi’s financial disclosure from a geographic to a product segment view
- Fresenius Helios with healthy organic revenue growth driven by increasing admissions
- Structural productivity savings ramping up, ~€130 million already achieved in Q1/23
- Group outlook confirmed
If no timeframe is specified, information refers to Q1/2023.

1 According to FY/23 guidance, excluding Provider Relief Fund (PRF) at Fresenius Medical Care
2 Before special items, Q1/22 restated following remeasurement Humacyte investment
3 Before special items For a detailed overview of special items please see the reconciliation tables on pages 18-23 in the PDF.
“With a simplified Group structure, improved performance, and a clear focus, Fresenius’s course is set. Productivity measures are gaining traction and we’ve started the new year with good growth momentum,” said Michael Sen, Fresenius CEO. “Our Operating Companies Fresenius Kabi and Fresenius Helios both had strong first quarter performance. The deconsolidation of Fresenius Medical Care is on track and the turnaround is also progressing. We want to accelerate this momentum. This requires contributions from all business segments.”
Deconsolidation of Fresenius Medical Care
The deconsolidation of Fresenius Medical Care is moving ahead as planned. The separation concept has been finalized and the relevant agreements are currently being drafted. The date of the Extraordinary General Meeting (EGM) of Fresenius Medical Care has been scheduled for July 14, 2023. Subject to the necessary shareholder approvals and the registration with the commercial register, the conversion is expected to become effective latest by the end of the 2023 financial year.
Moreover, starting in Q1/23, selected financials of the Fresenius Group are reported excluding Fresenius Medical Care to better reflect #FutureFresenius.
Structural productivity improvements
Under the cost and efficiency program, ~€130 million of structural cost savings at EBIT level were already achieved in Q1/23, that is around 25% of the planned savings for 2023. In the same period, one-time costs of ~€50 million incurred to achieve these savings. These are treated as special items. Thereof, Fresenius Medical Care invested €26 million and realized ~€60 million of cost savings.
FY/23 Group guidance confirmed
For 2023, Fresenius expects Group organic revenue1 to grow in a low- to mid-single-digit percentage range. Group constant currency EBIT2 is expected to remain broadly flat or decline up to a high-single-digit percentage rate.
Excluding Fresenius Medical Care constant currency EBIT3 is expected to remain broadly flat or decline up to a mid-single-digit percentage rate.
Fresenius expects the net debt/EBITDA4 ratio to be slightly above the 2023 level by the end of 2022 (December 31, 2022: 3.65x5), depending on divestment activities. The self-imposed target corridor for the leverage ratio remains unchanged at 3.0x to 3.5x.
1 FY/22 base: €40,840 million
2 FY/22 base: €3,727 million, before special items, excl. PRF; FY/23: before special items
3 FY/22 base: €2,187 million, before special items; FY/23: before special items
4 At LTM average exchange rates for both net debt and EBITDA; pro forma closed acquisitions/divestitures; excluding further potential acquisitions/divestitures; before special items; including lease liabilities
5 At LTM average exchange rates for both net debt and EBITDA; pro forma closed acquisitions/divestitures; before special items; including lease liabilities
For a detailed overview of special items please see the reconciliation tables on pages 18-23 in the PDF.
Assumptions for guidance FY/23
For 2023, Fresenius assumes no further escalations of geopolitical tensions and challenges from COVID-19, and supply chain constraints continuing to ease. Fresenius expects that the general cost inflation and labor shortages will have a more significant negative effect on its business than in 2022 due to the annualization effect of cost increases occurred in H2/2022.
Fresenius will continue to closely monitor the potential further consequences of the overall heightened volatility and muted visibility, including balance sheet valuations.
For Fresenius Medical Care’s contribution to the Group’s financial figures, the assumptions for Fresenius Medical Care’s FY/23 guidance are also fully applicable to Fresenius Group’s FY/23 guidance. In 2022, Fresenius Medical Care’s EBIT was supported by €277 million of Provider Relief Funding from the U.S. government (at current currency). There is no additional governmental support assumed for 2023.
All of these assumptions are subject to considerable uncertainty.
5% revenue increase in constant currency
Group revenue increased by 5% (5% in constant currency) to €10,225 million (Q1/22: €9,720 million). Organic growth was 5%. Acquisitions/divestitures contributed net 0% to growth. In total, currency translation had no effect on revenue growth. Excluding Fresenius Medical Care, Group revenue increased by 7% (7% in constant currency) to €5,546 million (Q1/22: €5,192 million).
10 %1 EBIT2 decline in constant currency – in line with expectations
Group EBITDA before special items decreased by 5% (-6% in constant currency) to €1,585 million (Q1/222: €1,662 million). Reported Group EBITDA was €1,491 million (Q1/22: €1,595 million).
Group EBIT before special items decreased by 9% (-11%/-10%1 in constant currency) to €908 million (Q1/222: €1,000 million). The decrease was mainly driven by the expected annualization of inflationary effects such as cost increases for personnel, material, logistics, and energy. This is due to the fact that H2/2022 showed stronger cost inflation compared to H1/2022. Moreover, a very negative performance at Fresenius Vamed weighed on Group EBIT. The EBIT margin before special items was 8.9% (Q1/222: 10.3%). Reported Group EBIT was €787 million (Q1/22: €902 million). Excluding Fresenius Medical Care, Group EBIT before special items decreased by 7% (-7% in constant currency) to €554 million (Q1/222: €593 million). The EBIT margin excluding Fresenius Medical Care before special items was 10.0% (Q1/222: 11.4%).
Group net interest before special items was -€170 million (Q1/222: -€119 million) mainly due to financing activities in a higher interest rate environment. Reported Group net interest was -€170 million (Q1/22: -€118 million).
Group tax rate before special items increased to 24.9% (Q1/222: 22.7%) mainly due to an increase in the proportionate share of non-tax-deductible expenses compared to taxable income at Fresenius Medical Care as well as the non-recognition of increased tax loss carryforwards. Reported Group tax rate was 25.0% (Q1/22: 23.6%).
Noncontrolling interests before special items were -€165 million (Q1/222: -€218 million) of which 93% were attributable to the noncontrolling interests in Fresenius Medical Care. Reported noncontrolling interests were -€117 million (Q1/22: -€186 million).
1 According to FY/23 guidance, excluding Provider Relief Fund (PRF) at Fresenius Medical Care
2 Before special items
For a detailed overview of special items please see the reconciliation tables on pages 18-23 in the PDF.
Group net income1 before special items decreased by 16% (-17% in constant currency) to €389 million (Q1/222: €463 million). The decrease was driven by cost inflation and the negative earnings development at Fresenius Vamed. Moreover, rising interest costs and a higher tax rate weighed on the net income development. Reported Group net income1 before special items decreased to €346 million (Q1/22: €413 million). Excluding Fresenius Medical Care, Group net income1 before special items decreased by 14% (-16% in constant currency) to €341 million (Q1/222: €397 million).
Earnings per share1 before special items decreased by 17% (-18% in constant currency) to €0.69 (Q1/222: €0.83). Reported earnings per share1 were €0.61 (Q1/22: €0.74).
1 Net income attributable to shareholders of Fresenius SE & Co. KGaA
2 Before special items
Investments
Spending on property, plant and equipment was €353 million corresponding to 3% of revenue (Q1/22: €338 million; 3% of revenue). These investments served primarily for the modernization and expansion of dialysis clinics, production facilities as well as hospitals and day clinics. Excluding Fresenius Medical Care, spending on property, plant and equipment was €211 million corresponding to 4% of revenue (Q1/22: €176 million; 3% of revenue).
Total acquisition spending was €68 million (Q1/22: €162 million) mainly for investments in debt instruments and the purchase of dialysis clinics.at Fresenius Medical Care. Excluding Fresenius Medical Care, total acquisition spending was €18 million (Q1/22: €79 million).
Cash flow development
Group operating cash flow increased to €175 million (Q1/22: €101 million) driven by the governmental support on energy costs at Fresenius Helios in Germany. Significantly higher working capital at Fresenius Kabi in particular receivables and inventory weighed on cash flow. Furthermore, the earnings development at Fresenius Vamed had a negative impact. The first quarter is traditionally a softer cash flow quarter due to phasing effects with catch-up effects over the course of the year. Group operating cash flow margin was 1.7% (Q1/22: 1.0%). Free cash flow before acquisitions and dividends increased to -€177 million (Q1/22: -€255 million). Free cash flow after acquisitions and dividends increased to -€281 million (Q1/22: -€403 million).
The cash conversion rate (CCR), which is defined as the ratio of adjusted free cash flow1 to EBIT before special items, was 0.3 (LTM: 1.1). As the first quarter is traditionally a softer cash flow quarter due to phasing effects a catch-up over the course of the year is expected.
1 Cash flow before acquisitions and dividends; before interest, tax, and special items
Solid balance sheet structure
Group total assets remained nearly unchanged compared to FY/22 (1% in constant currency) at €76,553 million (Dec. 31, 2022: €76,415 million) given the expansion of business activities which, however, was offset by currency translation effects. Current assets increased by 5% (6% in constant currency) to €19,102 million (Dec. 31, 2022: €18,279 million), mainly driven by the increase of trade account receivables. Non-current assets decreased by 1% (0% in constant currency) to €57,451 million (Dec. 31, 2022: €58,136 million).
Total shareholders’ equity decreased by 0% (2% in constant currency) to €32,173 million (Dec. 31, 2022: €32,218 million). The equity ratio was 42.0% (Dec. 31, 2022: 42.2%).
Group debt increased by 0% (1% in constant currency) to €27,765 million (Dec. 31, 2022: € 27,763 million). Group net debt increased by 2% (2% in constant currency) to € 25,444 million (Dec. 31, 2022: € 25,014 million).
As of March 31, 2023, the net debt/EBITDA ratio was 3.79x2,3 (Dec. 31, 2022: 3.65x1,2) mainly driven by lower EBITDA contribution and higher net debt. Excluding Fresenius Medical Care, the net debt/EBITDA ratio was 3.96x1,2 (Dec. 31, 2022: 3.80x1,2).
In Q1/23, ROIC was 4.8% due to the lower EBIT (Q4/22: 5.1%). Excluding Fresenius Medical Care, the ROIC was 5.2% (Q4/22: 5.6%).
1 Cash flow before acquisitions and dividends; before interest, tax, and special items
2 At LTM average exchange rates for both net debt and EBITDA; pro forma closed acquisitions/divestitures
3 Before special items
For a detailed overview of special items please see the reconciliation tables on pages 18-23 in the PDF.
Business Segments – Operating Companies
Fresenius Kabi
Fresenius Kabi specializes in products for the therapy and care of critically and chronically ill patients. The portfolio includes biopharmaceuticals, clinical nutrition, MedTech products, intravenously administered generic drugs (generic IV drugs), and IV fluids.

- Strong organic revenue growth in all three growth vectors
- Biopharma with ongoing strong momentum
- EBIT margin1 within structural margin band despite significantly increased year-over-year inflationary headwinds
- Enhanced transparency by change of financial disclosure from a geographic to a product segment view
1 Before special items
2 Net income attributable to shareholders of Fresenius SE & Co. KGaA
For a detailed overview of special items please see the reconciliation tables on pages 18-23 in the PDF.
Revenue increased by 8% (8% in constant currency) to €1,991 million (Q1/22: €1,847 million) mainly driven by the strong business development of all growth vectors. Organic growth was 7%.
Revenue in MedTech increased by 11% (organic growth: 9%) to €378 million (Q1/22: €342 million) mainly driven by the good business development in Latin America.
Revenue in Nutrition increased by 4% (organic growth: 8%) to €602 million (Q1/22: €577 million) mainly driven by the good business development in Latin America and Europe.
Revenue in Biopharma increased by 207% (organic growth: 57%) to €71 million (Q1/22: €23 million) mainly driven by the good business development in Latin America.
Revenue of the Growth Vectors (MedTech, Nutrition and Biopharma) increased by 12% (organic growth: 10%) to €1,051 million (Q1/22: €942 million).
Revenue in the Pharma (IV Drugs & Fluids) business increased by 4% (organic growth: 3%) to €940 million (Q1/22: €905 million). The good business development in Europe and North America was dampened by offsetting effects in China.
EBIT1 decreased by 1% (-4% in constant currency) to €289 million (Q1/22: €293 million) due to the annualization of cost inflation effects. EBIT margin1 was 14.5% (Q1/22: 15.9%) and thus within the structural EBIT margin band. The positive sequential development is driven by the well progressing cost savings program as well as targeted pricing initiatives.
EBIT1 of the Growth Vectors (MedTech, Nutrition and Biopharma) decreased by 14% (-17% in constant currency) to €96 million (Q1/22: €112 million) due to the annualization of cost inflation effects. EBIT1 margin was 9.2% (Q1/22: 11.9%).
EBIT1 in the Pharma (IV Drugs & Fluids) business increased by 7% (4% in constant currency) to €197 million (Q1/22: €185 million) due to positive development in the North American region. EBIT1 margin was 21.0% (Q1/22: 20.4%).
Net income1,2 decreased by 5% (-7% in constant currency) to €191 million (Q1/22: €201 million).
Operating cash flow decreased to €21 million (Q1/22: €133 million) with a margin of 1.1% (Q1/22: 7.2%) mainly driven by phasing effects and working capital build-ups, in particular higher inventories.
For FY/23, Fresenius Kabi expects organic revenue3 growth in a low- to mid-single-digit percentage range. The EBIT margin4 is expected to be around one percentage point (pp) below the structural margin band of 14% to 17%.
1 Before special items
2 Net income attributable to shareholders of Fresenius SE & Co. KGaA.
3 FY/22 base: €7,850 million
4 FY/22 base: EBIT margin: 13.8%, before special items; FY/23 before special items
For a detailed overview of special items please see the reconciliation tables on pages 18-23 in the PDF.
Fresenius Helios
Fresenius Helios is Europe's leading private health care provider. The company comprises Helios Germany, Helios Spain and Helios Fertility. Helios Germany operates 87 hospitals, around 240 outpatient centers, 22 occupational health centers and 6 prevention centers. Helios Spain operates 50 hospitals, around 100 outpatient centers and around 300 occupational risk prevention centers. In addition, the company is active in Latin America with 8 hospitals and as a provider of medical diagnostics. Helios Fertility offers a wide spectrum of state-of-the-art services in the field of fertility treatments.

- Fresenius Helios with healthy organic revenue growth driven by ongoing admissions increase across all areas
- EBIT margin1 solid following successful measures to counter inflationary headwinds
- Helios Fertility recovering with increasing volumes
1 Before special items
2 Net income attributable to shareholders of Fresenius SE & Co. KGaA
For a detailed overview of special items please see the reconciliation tables on pages 18-23 in the PDF.
Revenue increased by 5% (5% in constant currency) to €3,066 million (Q1/22: €2,931 million). Organic growth was 5%. Acquisitions contributed 0% to revenue growth.
Revenue of Helios Germany increased by 3% (organic growth: 3%) to €1,828 million (Q1/22: €1,783 million), mainly driven by increasing admissions and positive mix effects.
Revenue of Helios Spain increased by 7% (9% in constant currency) to €1,170 million (Q1/22: €1,089 million). Organic growth of 8% was driven by ongoing patient demand. The clinics in Latin America also showed a good performance.
Revenue of Helios Fertility increased by 16% (18% in constant currency) to €66 million (Q1/22: €57 million) as patients are returning to demand fertility treatments.
EBIT1 increased by 2% (2% in constant currency) to €311 million (Q1/22: €306 million) with an EBIT margin1 of 10.1% (Q1/22: 10.4%).
EBIT1 of Helios Germany increased despite cost inflation by 1% to €155 million (Q1/22: €154 million) with an EBIT margin1 of 8.5% (Q1/22: 8.6%).
EBIT1 of Helios Spain increased due to the strong revenue growth and despite cost inflation by 3% (4% in constant currency) to €157 million (Q1/22: €153 million). The EBIT margin1 was 13.4% (Q1/22: 14.0%).
EBIT1 of Helios Fertility was €4 million (Q1/22: €4 million) with an EBIT margin1 of 6.1% (Q1/22: 7.0%).
Net income1,2 decreased by 3% (-2% in constant currency) to €190 million (Q1/22: €195 million).
Operating cash flow increased to €108 million (Q1/22: -€136 million) mainly due to governmental support measures to mitigate higher energy costs in Germany and an improved working capital management. The operating cash flow margin was 3.5% (Q1/22: -4.6%).
For FY/23, Fresenius Helios expects organic revenue3 growth in a mid-single-digit percentage range. The EBIT margin4 is expected to be within the structural margin band of 9% to 11%.
1 Before special items
2 Net income attributable to shareholders of Fresenius SE & Co. KGaA
3 FY/22 base: €11,716 million
4 FY/22 base: EBIT margin: 10.1%, before special items, FY/23 before special items
For a detailed overview of special items please see the reconciliation tables on pages 18-23 in the PDF.
Business Segments – Investment Companies
Fresenius Medical Care
(Financial data according to Fresenius Medical Care press release)
Fresenius Medical Care is the world's largest provider of products and services for individuals with renal diseases. As of March 31, 2023, Fresenius Medical Care was treating approximately 343,000 patients in 4,060 dialysis clinics. Dialyzers and dialysis machines are among the most important product lines. In addition, Fresenius Medical Care offers dialysis-related services.

- Both segments contributed to organic growth with improving volume trends in Care Delivery and strong critical care business in Care Enablement
- More moderate decline in operating income due to phasing, continued improvement in organic growth in line with expectations, easing labor shortage in the U.S., and progressing FME25 transformation
- First measures of legacy portfolio optimization delivered
Revenue increased by 3% to €4,704 million (+2% in constant currency, organic: +2%).
EBIT decreased by 25% to €261 million (-28% in constant currency), resulting in a margin of 5.5% (Q1/22: 7.6%). EBIT excluding special items and U.S. Provider Relief Funding (PRF) decreased by 9% to €354 million (-13% in constant currency), resulting in a margin of 7.5% (Q1/22: 8.6%).
Net income2 decreased by 45% to €86 million (-47% in constant currency). Excluding special items and PRF, net income decreased by 22% to €154 million ( 24% in constant currency).
In the first quarter, Fresenius Medical Care generated €143 million of operating cash flow (Q1/22: €159 million), resulting in a margin of 3.0% (Q1/22: 3.5%). The reduction was mainly due to the decrease in net income.
1 Before special items
2 Net income attributable to shareholders of Fresenius Medical Care AG & Co. KGaA
For a detailed overview of special items please see the reconciliation tables on pages 18-23 in the PDF.
Based on the results for the first quarter, Fresenius Medical Care confirms its financial targets for 2023. Fresenius Medical Care expects for 2023 revenue1 to grow at a low to mid-single digit percentage rate and EBIT2 to remain flat or decline by up to a high-single digit percentage rate3.
1 FY/22 base: €19,398 million
2 FY/22 base: €1,540 million
3 Revenue and EBIT, as referred to in the outlook, are both on a constant currency basis and excluding special items. Special items will be provided as separate KPI (“Revenue excluding special items”, “EBIT excluding special items”) to capture effects that are unusual in nature and have not been foreseeable or not foreseeable in size or impact at the time of giving guidance. These items are excluded to ensure comparability of the figures presented with the Company’s financial targets which have been defined excluding special items.
For FY 2022, special items included costs related to the FME25 program, the impact of the war in Ukraine, the impact of hyperinflation in Turkiye, the Humacyte investment remeasurement, and the net gain related to InterWell Health. Additionally, FY 2022 basis for Outlook 2023 and 2025 was adjusted for Provider Relief Funding.
For FY 2023, special items include costs related to the FME25 program, the Humacyte investment remeasurement, the costs associated with the legal conversion and effects from legacy portfolio optimization.
For further information, please see Fresenius Medical Care’s press release at www.freseniusmedicalcare.com.
Fresenius Vamed
Fresenius Vamed manages projects and provides services for hospitals and other health care facilities worldwide and is a leading post-acute care provider in Central Europe. The portfolio ranges along the entire value chain: from project development, planning, and turnkey construction, via maintenance and technical management to total operational management.

- Revenue growth driven by the technical services business and the European project business
- EBIT1 negatively impacted by project business and negative one-time effects
- Major restructuring program initiated
Revenue increased by 14% (13% in constant currency) to €583 million (Q1/22: €513 million). Organic growth was 13%.
Revenue in the service business increased by 8% (7% in constant currency) to €436 million (Q1/22: €405 million) due to better performance of technical services in Germany, Italy and United Kingdom. Revenue in the project business increased by 36% (36% in constant currency) to €147 million (Q1/22: €108 million). The good revenue performance is mainly attributable to higher revenue in European project business.
EBIT1 decreased to -€27 million (Q1/22: €8 million) with an EBIT margin1 of -4.6% (Q1/22: 1.6%). The weak development was related to the project business that partially did not have a contribution margin. Moreover, certain international business initiations did not materialize as planned. Significant negative one-time effects in the service business also impacted the EBIT development. To counteract the negative EBIT development, a major restructuring program was initiated.
Net income1,2 decreased to -€36 million (Q1/22: €4 million).
Order intake was €43 million (Q1/22: €263 million). As of March 31, 2023, order backlog was at €3,580 million (December 31, 2022: €3,689 million).
Operating cash flow decreased to -€68 million (Q1/22: -€45 million) with a margin of
-11.7% (Q1/22: -8.8%), due to the negative earnings and higher working capital.
For FY/2023, Fresenius Vamed expects organic revenue3 to grow in a low-to mid-single digit percentage range. The EBIT margin4 is expected to be clearly below the structural margin band of 4% to 6%.
1 Before special items
2 Net income attributable to shareholders of VAMED AG
3 FY/22 base: €2,359 million
4 FY/22 base: EBIT margin: 0.8%, before special items; FY/23 before special items
For a detailed overview of special items please see the reconciliation tables on pages 18-23 in the PDF.
Conference Call and Webcast
As part of the publication of the results for Q1/23, a conference call will be held on May 9, 2023 at 1:30 p.m. CEDT (7:30 a.m. EDT). All investors are cordially invited to follow the conference call in a live broadcast over the Internet at www.fresenius.com/investors. Following the call, a replay will be available on our website.
For additional information on the performance indicators used please refer to our website www.fresenius.com/alternative-performance-measures.
This release contains forward-looking statements that are subject to various risks and uncertainties. Future results could differ materially from those described in these forward-looking statements due to certain factors, e.g. changes in business, economic and competitive conditions, regulatory reforms, results of clinical trials, foreign exchange rate fluctuations, uncertainties in litigation or investigative proceedings, the availability of financing and unforeseen impacts of international conflicts. Fresenius does not undertake any responsibility to update the forward-looking statements in this release.