Fresenius SE & Co. KGaA's subscribed capital amounts to €563,237,277 and consists of 563,237,277 ordinary shares (last change as of 09.06.2022). The shares are notional no-par-value shares. Each share represents €1.00 of the capital stock.
Capitalization
Date
Capital-related measures
Subscribed Capital / Total number of ordinary Shares
09.06.2022
Issuance of new shares (scrip dividend)
€563,237,277 / 563,237,277
30.11.2021
Issuance of new shares from stock option plan
€558,502,143 / 558,502,143
31.10.2021
Issuance of new shares from stock option plan
€558,457,143 / 558,457,143
30.09.2021
Issuance of new shares from stock option plan
€558,454,143 / 558,454,143
31.08.2021
Issuance of new shares from stock option plan
€558,453,018 / 558,453,018
31.07.2021
Issuance of new shares from stock option plan
€558,437,193 / 558,437,193
30.06.2021
Issuance of new shares from stock option plan
€558,040,523 / 558,040,523
31.05.2021
Issuance of new shares from stock option plan
€557,716,248 / 557,716,248
30.04.2021
Issuance of new shares from stock option plan
€557,556,509 / 557,556,509
31.03.2021
Issuance of new shares from stock option plan
€557,541,659 / 557,541,659
Date
Capital-related measures
Subcribed Capital
Nominal Value
Total number of preference shares
Total number of ordinary shares
2021
Issuance of new shares from stock option plan
€ 558,502,143
558,502,143
2020
Issuance of new shares from stock option plan
€ 557,540,909
557,540,909
2019
Issuance of new shares from stock option plan
€ 557,379,979
557,379,979
2018
Issuance of new shares from stock option plan
€ 556,225,154
556,225,154
2017
Issuance of new shares from stock option plan
€ 554,710,473
554,710,473
31.01.2017
Capital increase from approved capital
€ 553,316,547
553,316,547
2016
Issuance of new shares from stock option plan
€ 547,208,371
547,208,371
2015
Issuance of new shares from stock option plan
€ 545,727,950
545,727,950
2014
Issuance of new shares from stock option plan
€ 541,532,600
541,532,600
01.08.2014
Stock split with Capital increase from company funds
€ 540,511,632
540,511,632
31.07.2014
Issuance of new shares from stock option plan
€ 180,170,544
180,170,544
31.07.2014
Issuance of new shares from stock option plan
€ 180,170,544
180,170,544
2013
Issuance of new shares from stock option plan
€ 179,694,829
179,694,829
2012
Issuance of new shares from stock option plan
€ 178,188,260
178,188,260
15.05.2012
Capital increase from approved capital
€ 177,166,002
177,166,002
30.04.2012
Issuance of new shares from stock option plan
€ 163,366,002
163,366,002
2011
Issuance of new shares from stock option plan
€ 163,237,336
163,237,336
28.01.2011
Unification of share classes
€ 162,450,090
162,450,090
2010
Issuance of new shares from stock option plan (P&O)
€ 162,450,090
81,225,045
81,225,045
2009
Issuance of new shares from stock option plan (P&O)
€ 161,315,376
80,657,688
80,657,688
2008
Issuance of new shares from stock option plan (P&O)
€ 161,143,734
80,571,867
80,571,867
Capital increase from approval capital
€ 160,863,550
80,426,775
80,426,775
Issuance of new shares from stock option plan (P&O)
€ 155,357,436
77,678,718
77,678,718
2007
Issuance of new shares from stock option plan (P&O)
€ 155,164,770
77,582,385
77,582,385
Share split with capital increase from the Company's funds4
€ 154,353,876
77,176,938
77,176,938
2006
Issuance of new shares from stock option plan (P&O)
€ 131,715,308
25,725,646
25,725,646
17.11.2006
Capital increase through contribution in kind (P&O)
€ 131.524.890
176,540
176,540
2005
Capital increase from approved capital 9:2 (P&O)
€ 129,849,037
25,361,140
25,361,140
2005
Issuance of new shares from stock option plan (P&O)
€ 105,785,037
20,661,140
20,661,140
2004
Issuance of new shares from stock option plan (P&O)
€ 104,885,857
20,485,519
20,485,519
2002
Issuance of new shares from stock option plan (P&O)
€ 104,882,391
20,484,842
20,484,842
2001
Issuance of new shares from stock option plan (P&O)
€ 104,882,043
20,484,774
20,484,774
Capital increase through contribution in kind (P&O)
€ 104,800,266
20,468,802
20,468,802
Capital increase from corporate funds by new share issue in the ratio 1:1 (P&O)
€ 102,477,865
20,015,208
20,015,208
Issuance of new shares from stock option plan (P&O)
€ 51,238,932
10,007,604
10,007,604
2000
Issuance of new shares from stock option plan (P&O)
€ 51,238,523
10,007,524
10,007,524
1999
Conversion of subscribed capital into € and introduction of non-par shares3
€ 51,200,000
10,000,000
10,000,000
1997
Capital increase (P)
DM 100,000,000
DM 5
10,000,000
10,000,000
1995
Change of nominal value from DM 50 to DM 5
DM 90,000,000
DM 5
8,000,000
10,000,000
1994
Capital increase (P)
DM 90,000,000
DM 50
800,000
1,000,000
1992
Capital increase / listing (O)2
DM 80,000,000
DM 50
600,000
1,000,000
1989
Capital increase (P)
DM 60,000,000
DM 50
600,000
600,000
1986
Listing at Frankfurt Stock Exchange (P)1
DM 45,000,000
DM 50
300,000
600,000
1 (P) = Preference Shares
2 (O) = Ordinary Shares
3 Par value per share € 2.56
4 Par value per share € 1.00
105,288,804 shares of total share capital are not listed.
Notification pursuant to Art. 2 (3) Sentence 2 DELEGATED REGULATION (EU) No 2016/1052
Employee participation in our corporate success has a long tradition at Fresenius. In 2023, the employee share program "Fresenius SHARE" was launched. Attached please find an overview of transactions in connection with our employee share program.
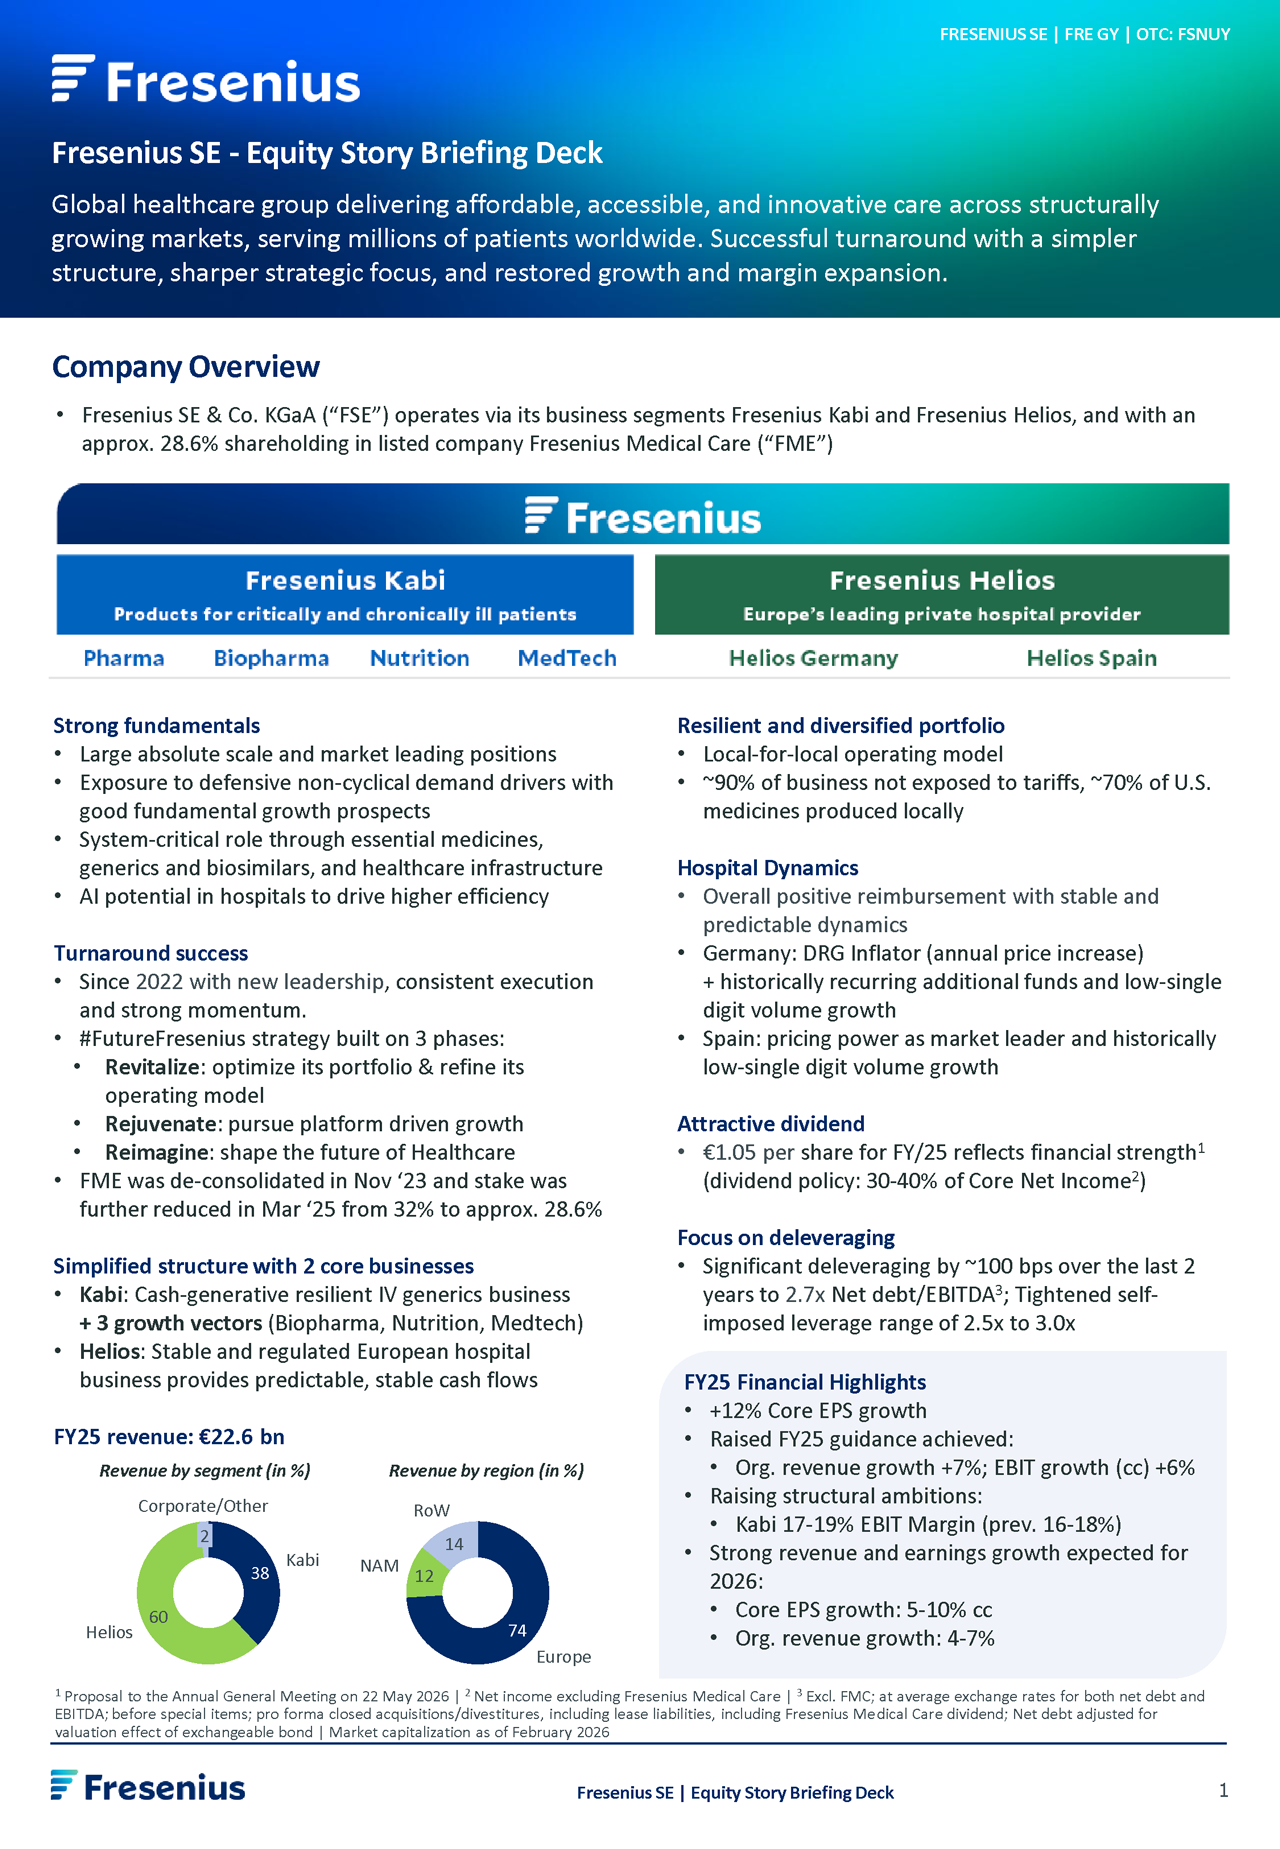
Dividend policy reflects capital allocation priorities: As part of the full year reporting in February 2025, Fresenius defined a new dividend policy designed to ensure attractive shareholder returns while maintaining strategic flexibility. Going forward, Fresenius will pay out 30 to 40% of its Group core net income excluding Fresenius Medical Care and before special items as dividend.
Dividend 2025
Fresenius remains fully commitment to delivering attractive shareholder returns. For fiscal year 2025, the Company will propose a dividend of €1.05 per share. This corresponds to a payout ratio of 37%, at the upper half of the 30 to 40% range of core net income1,2, as specified in the Fresenius Financial Framework.
1 Before special items 2 Excluding Fresenius Medical Care
Total Return Calculator
Fill out the fields and click "Show data". The Total Return Calculator will provide you with the current value of your Fresenius shares and the return. Moreover, the Calculator shows the share price performance during the selected period.
Contact
Florian Feick
Vice President Investor Relations
Deputy Head of Investor Relations
T: +49 (0) 6172 608-5167
florian.feick@fresenius.com
International financial analysts cover Fresenius SE & Co. KGaA and publish reports and updates on the development of its business and its shares. Once a quarter, VARA Research creates an up-to-date consensus from these various forecasts. An interactive and downloadable set of the consensus data for Fresenius SE & Co. KGaA can be found on Vara Research.
Contact
Florian Feick
Vice President Investor Relations
Deputy Head of Investor Relations
T: +49 (0) 6172 608-5167
florian.feick@fresenius.com
Trends towards a changing geopolitical order have been observable and are still continuing since the beginning of the 2025 fiscal year. The potential implications of this for customs duties, taxes, regulation, administration and political decision-making, for example, may have direct and indirect negative effects on the industry environment and the business activities of the Fresenius Group, although these cannot be estimated at present.
Fresenius will continue to closely monitor the potential impact of increased volatility and reduced visibility on its business and balance sheet.
Guidance for Fiscal Year 20261 reconfirmend
All of these assumptions are subject to considerable uncertainty. Assumptions to guidance: The company acknowledges that the prevailing trends of fast-moving macroeconomic and geopolitical environment continue, resulting in increased volatility and a higher level of operational uncertainty. The guidance does not take into account potential extreme scenarios that could affect the company, its peers, and the healthcare sector as a whole.
Fiscal year 2025 (base)
Targets 2026
Fresenius Group
Revenue growth (organic)2
€22,554 m
4–7%
Core EPS growth cc3
€2.87
5–10%
Operating Companies
Fresenius Kabi
Revenue growth (organic)2
€8,612 m
Mid-to high-single-digit percentage range
EBIT margin1
€1,413 m
16.5% to 17.0%
Fresenius Helios
Revenue growth (organic)
€13,550 m
Mid-single-digit percentage range
EBIT margin1
€1,328 m
10.0 to 10.5%
1 Before special items 2 Organic growth rate adjusted for accounting effects related to Argentina hyperinflation. 3 Excluding Fresenius Medical Care and Vitrea
#CommittedToLife: the health and well-being of patients is Fresenius’ top priority. For more than 100 years, we have been combining cutting-edge technology with a focus on patients, paving the way for the therapies of the future. We save and improve lives and health. We provide access to affordable and innovative medical products and clinical care of the highest quality.
Fresenius businesses geared towards driving forces in healthcare
The global healthcare sector is growing and changing rapidly in response to critical challenges driven by demographic shifts, technological advancements and evolving patient needs. These secular growth drivers are here to stay:
Ageing global population: The world’s population is aging significantly, increasing demand for healthcare services.
Higher prevalence of chronic diseases: Chronic conditions are driving higher healthcare spending worldwide.
Growing healthcare spending: Across geographies, healthcare spending as a share of GDP continues to rise. In the U.S., for example, spending approached nearing $5 trillion in 2023 based on CMS data. At +7.5%, this is the biggest increase in decades!
Technological advancements: Digital solutions and AI will play an increasingly role in quality and productivity.
Demand for highly-skilled workforce: Attracting top talent is essential to stay at the forefront of innovative healthcare.
Fresenius is part of the solution: We are a relevant, system-critical healthcare company combining innovative medicine, advanced medical technology, and the highest quality in clinical care to shape next-level therapies.
The healthcare sector is one of the world’s largest industries, offering exceptional growth opportunities. We geared our businesses towards these driving forces and are committed to staying at the forefront, ensuring our businesses remain system-relevant and future-ready.
Strong balance across system-critical businesses
Our unique strengths lie in our positioning: we cover the entire patient journey with a broad portfolio range – right at the critical spots in care – capable of advancing therapies on many levels. With Fresenius Kabi and Fresenius Helios, we address, lead and meet evolving patient needs across three therapy platforms:
(Bio)Pharma including clinical nutrition: This includes our broad range of essential IV Generics and IV Fluids, Enteral and Parenteral Clinical Nutrition, and our fast-growing Biosimilars business.
MedTech: We are addressing cutting-edge technology in Transfusion & Cell Therapies and the Infusion & Nutrition Systems space.
Care Provision: This is where we provide high-quality and innovative treatments through our market-leading networks of hospitals and outpatient facilities in Germany and Spain – treating 26 million patients every year!
With this strategy, we address the driving forces in healthcare that will change the pattern of growth. All business at Fresenius Kabi and Fresenius Helios have leading market positions in attractive markets and grow meaningfully organically. We are part of the solution of innovative healthcare and future therapies:
Health Equity: Providing affordable and accessible products and services
Integrated therapies: Driving multimodal therapies across three platforms
Digital solutions and AI: Enhancing clinical outcomes, quality and productivity
Human touch: From cutting-edge technology to human-to-human care
#FutureFresenius is clearly paying off
Since launching #FutureFresenius in October 2022, we have driven structural productivity and improved returns, creating a simpler, more focused, and stronger healthcare company – delivering clear impact for all stakeholders! Key milestones include deconsolidating Fresenius Medical Care, concluding several important strategic portfolio measures, and exiting Vamed.
In 2025, we kicked-off the next phase of #FutureFresenius - Rejuvenate – taking our performance to the next level! In this phase we focus on:
Upgrading our core businesses by doing what we are doing – even better! Through patient care, customer service, better processes and operations, we’re creating value day by day!
And scaling our three therapy platforms:
specialized (Bio)Pharma
targeted MedTech
holistic Care Provision
This means bringing new products and innovations to the market, focusing on the needs of patients and customers. We are investing in AI and digital transformation to enhance clinical decision-making, streamline workflows, and improve patient experiences. These next-generation capabilities will strengthen our leadership in medical quality and innovation.
Overview #FutureFresenius strategy:
RESET: First we simplified our group structure, optimized our financial management system, and created change momentum across the organization.
REVITALIZE: We then geared up for continuous portfolio optimization and the pursuit of growth verticals.
REJUVENATE: We are now driving platform-driven growth through product launches and add-ons, and creating value from investments.
REIMAGINE: Our further enhanced capabilities will allow us to actively shape the future of healthcare!
Contact
Nick Stone
Senior Vice President Investor Relations
Head of Investor Relations
T: +49 (0) 6172 608-97033
nick.stone@fresenius.com
Discover why investing in Fresenius means investing in long-term healthcare innovation. Fresenius is a relevant, system-critical healthcare company. We combine innovative medicine, advanced medical technology, and the highest quality in clinical care to shape next-level therapies.
Watch the video for a quick summary of the key reasons to invest in Fresenius.
6 reasons to invest
Across our therapy platforms, we deliver real impact for patients, professionals, and hospitals around the world. At the same time, we create long-term value for our shareholders.
Explore below a detailed overview of why Fresenius is both – a system-critical healthcare provider and a well-positioned company.
Global healthcare systems are facing critical challenges:
Longevity gap: Aging population and rising chronic diseases
Workforce gap: Rising shortage of medical specialists
Efficiency gap: Increasing healthcare spend
Fresenius is part of the solution: We are actively addressing these global gaps by:
driving affordable, innovative medicine and tailored nutrition
advancing integrated MedTech and digital ecosystems
strengthening our employer attractiveness!
Our unique strength lies in the strong balance between two system-critical businesses: Fresenius Kabi and Fresenius Helios:
Fresenius Kabi supplies healthcare products for critically and chronically ill patients (Pharma, Biopharma, Nutrition & MedTech)
Fresenius Helios is Europe’s leading private hospital operator (Helios Germany & Quirónsalud Spain)
Both businesses hold leading market positions in attractive segments and are set for strong, sustainable organic growth and margin expansion.
In October 2022, Fresenius launched its #FutureFresenius strategy. Since then, we have made significant financial and structural progress, making our companymore focused, adaptive, and performance driven.
All key financial metrics in Full-Year 2024 compared to Full-Year 2022 improved – a clear sign that our strategy is working.
Persistent macroeconomic volatility and emerging geopolitical tensions, Fresenius delivers consistent performance. This reflects the operating strength and continued execution of #FutureFresenius. While serving global markets, we foster a strong local presence. This way we are able to act quickly – also in uncertainties:
With our “Local for local” approach, we are closer to our customers. This means: in Europe for Europe, in Asia for Asia, in the U.S. for the U.S.
90% of Group revenues are not exposed to U.S. tariffs, and 70% of total revenues are generated in Europe.
The “More in America” initiative specifically strengthens our strong local presence in U.S. manufacturing.
In recent years, we have invested around 1 billion US dollars in production and logistics in the U.S. Around 70% of the medicines we sell in the U.S. are also manufactured there.
We kicked-off the next phase of #FutureFresenius – Rejuvenate – in 2025: Taking our performance to the next level!
This means upgrading our core businesses by doing what we are doing even better! Through patient care, customer service, better processes and operations, we’re creating value day by day!
And scaling our three therapy platforms:
specialized (Bio)Pharma
targeted MedTech
holistic Care Provision
Together they offer strong potential for future growth, innovation and digitalization and thus elevating performance.
Fresenius has transformed into a more focused, performance-driven organization with a strong culture of accountability. Our mission stand firm: to save and improve human lives with affordable, accessible, and innovative healthcare products and the highest quality in clinical care.
With over 100 years of experience, Fresenius has grown from a small business into a global healthcare company. Through #FutureFresenius, we’ve become simpler, more adaptive, and more competitive - delivering real impact to patients, caregivers, hospitals, employees, and shareholders alike. We are ready to lead and remain an employer of choice in today’s competitive healthcare landscape.