
- Fresenius Kabi with continued good growth in Q1/19
- Helios Germany stabilized; Helios Spain with continued dynamic growth
- Fresenius Medical Care with strong financial performance supported by agreements that materialized earlier than planned
- Growth investments on track
- Group guidance confirmed despite expected earnings dilution from NxStage
1 Adjusted for IFRS 16 effect
2 Q1/18 adjusted for divestitures of Care Coordination activities at FMC
3 Net income attributable to shareholders of Fresenius SE & Co. KGaA
Group guidance for 2019 confirmed
After closing the NxStage acquisition on February 21, the related sales and earnings contributions are now included in the Group guidance. Despite the expected earnings dilution from NxStage, Fresenius confirms its FY/19 guidance. Fresenius projects sales growth1 of 3% to 6% in constant currency. Net income2,3 growth is expected to be ~0% in constant currency.
Including the NxStage acquisition which is increasing the net debt/EBITDA ratio in 2019 by ~30 basis points and excluding IFRS 16, Fresenius now expects year-end 2019 net debt/EBITDA ratio to be at the upper-end of the original self-imposed target corridor of 2.5 to 3.0x.
Due to the adoption of the IFRS 16 accounting standard (“IFRS 16 effect”), Fresenius increases its self-imposed target corridor of 2.5x to 3.0x net debt/EBITDA to 3.0x to 3.5x.
1 On a comparable basis: FY/18 base: €33,009 million; FY/18 adjusted for divestitures of Care Coordination activities at FMC (H1/18); FY/19: adjusted for IFRS 16 effect
2 Net income attributable to shareholders of Fresenius SE & Co. KGaA
3 On a comparable basis: FY/18 base: €1,872 million; FY/18 before special items and adjusted for divestitures of Care Coordination activities at FMC (H1/18); FY/19: before special items (transaction-related expenses, expenses associated with the cost optimization program at FMC, revaluations of biosimilars contingent liabilities); adjusted for IFRS 16 effect
4 Both net debt and EBITDA calculated at expected annual average exchange rates; excluding further potential acquisitions
For a detailed overview of special items and adjustments please see the reconciliation tables on pages 19-22 of the PDF file.
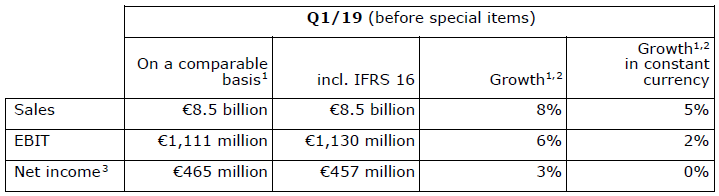
5% sales growth1 in constant currency
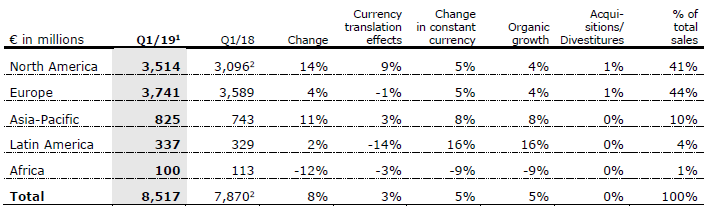
Group sales were €8,495 million including an IFRS 16 effect of -€22 million. Group sales1 on a comparable basis increased by 8% (5% in constant currency) to €8,517 million (Q1/18: €7,870 million). Organic sales growth was 5%. Acquisitions/divestitures contributed net 0% to growth. Positive currency translation effects of 3% were mainly driven by the appreciation of the U.S. dollar against the euro.
Group sales by region:
1 On a comparable basis: Q1/18 adjusted for divestitures of Care Coordination activities at FMC; Q1/19 adjusted for IFRS 16 effect
For a detailed overview of special items and adjustments please see the reconciliation tables on pages 19-22 of the PDF file.
Net income1,2 growth flat in constant currency
Group EBITDA before special items was €1,701 million including an IFRS 16 effect of €220 million. Group EBITDA2 on a comparable basis increased by 6% (3% in constant currency) to €1,481 million (Q1/18: €1,394 million).
Group EBIT before special items was €1,130 million including an IFRS 16 effect of €19 million. Group EBIT2 on a comparable basis increased by 6% (2% in constant currency) to €1,111 million (Q1/18: €1,050 million). The EBIT margin2 on a comparable basis was 13.0% (Q1/18: 13.3%). Reported Group EBIT was €1,115 million.
Group net interest before special items was -€181 million including an IFRS 16 effect of -€48 million. On a comparable basis, net interest2 improved to -€133 million (Q1/18: -€139 million) mainly due to lower rates for refinancing activities. Reported Group net interest was -€184 million.
Group tax rate before special items and adopting IFRS 16 was 23.3%. Group tax rate2 on a comparable basis was 23.4% (Q1/18: 20.9%). The prior-year was positively influenced by one-time effects related to the adoption of the U.S. tax reform.
Noncontrolling interest before special items was €271 million including an IFRS 16 effect of €13 million. Noncontrolling interest2 on a comparable basis was €284 million (Q1/18: €270 million), of which 94% was attributable to the noncontrolling interest in Fresenius Medical Care.
Group net income1 before special items was €457 million including an IFRS 16 effect of -€8 million. Group net income1,2 on a comparable basis increased by 3% (0% in constant currency) to €465 million (Q1/18: €451million). Reported Group net income1,3 was €453 million.
Earnings per share1 before special items was €0.82 including an IFRS 16 effect of -€0.02.
Earnings per share1 before special items was €0.82 including an IFRS 16 effect of -€0.02. Earnings per share1,2 on a comparable basis increased by 3% (0% in constant currency) to €0.84 (Q1/18: €0.81). Reported Earnings per share1,3 was €0.81.
1 Net income attributable to shareholders of Fresenius SE & Co. KGaA
2 On a comparable basis: Q1/19 before special items and adjusted for IFRS 16 effect; Q1/18 adjusted for divestitures of Care Coordination activities at FMC
3 After special items and including IFRS 16 effect
For a detailed overview of special items and adjustments please see the reconciliation tables on pages 19-22 of the PDF file.
Continued investment in growth
2019 is an investment year for the Fresenius Group. Fresenius is making good progress in all of its investment initiatives to secure long-term sustainable growth. Spending on property, plant and equipment was €441 million (Q1/18: €380 million), primarily for the modernization and expansion of dialysis clinics, production facilities as well as hospitals and day clinics. This corresponds to 5% of sales.
Total acquisition spending was €1,923 million (Q1/18: €192 million), mainly for the acquisition of NxStage.
Cash flow development
Group operating cash flow was €289 million including an IFRS 16 effect of €171 million. On a comparable basis, Group operating cash flow was €118 million (Q1/18: €236 million) with a margin of 1.4% (Q1/18: 2.9%). After a strong Q4/18, operating cash flow was impacted by working capital changes at Fresenius Kabi, for example by some phasing of payments and stockbuild to prepare for a possible Brexit. Moreover, as in previous years’ first quarters, operating cash flow was influenced by the seasonality in invoicing at Fresenius Medical Care North America. Fresenius does not expect these temporary effects to have a significant impact on FY/19 cash flow.
Given the effects described above in combination with increasing investments, free cash flow before acquisitions and dividends adjusted for IFRS 16 was -€339 million (Q1/18: - €155 million). Free cash flow after acquisitions and dividends adjusted for IFRS 16 was -€2,282 million (Q1/18: -€389 million). The IFRS 16 effect amounts to €171 million respectively. Correspondingly, cash flow from financing activities declined by €171 million.
Solid balance sheet structure
The Group’s total assets were €64,985 million including an IFRS 16 effect of €5,669 million. Adjusted for IFRS 16, Group total assets1 increased by 5% (3% in constant currency) to €59,316 million (Dec. 31, 2018: €56,703 million). Current assets1 grew by 1% (0% in constant currency) to €14,958 million (Dec. 31, 2018: €14,790 million). Non-current assets1 increased by 6% (5% in constant currency) to €44,358 million (Dec. 31, 2018: € 41,913 million).
Total shareholders’ equity was €25,830 million including an IFRS 16 effect of -€167 million. Adjusted for IFRS 16, total shareholders’ equity1 increased by 4% (2% in constant currency) to €25,997 million (Dec. 31, 2018: €25,008 million). The equity ratio was 39.7%. Adjusted for IFRS 16, the equity ratio was 43.8% (Dec. 31, 2018: 44.1%).
Group debt was €26,378 million including an IFRS 16 effect of €5,836 million. Adjusted for IFRS 16, Group debt1 increased by 8% to €20,542 million (8% in constant currency) (Dec. 31, 2018: € 18,984 million). Group net debt was €24,835 million including an IFRS 16 effect of €5,836 million. Adjusted for IFRS 16, Group net debt1 increased by 17% (16% in constant currency) to € 18,999 million (Dec. 31, 2018: € 16,275 million) mainly due to the acquisition of NxStage by Fresenius Medical Care and the negative free cash flow.
As of March 31, 2019, the net debt/EBITDA ratio increased to 3.091,2,3 (December 31, 2018: 2.712,3). Excluding the acquisition of NxStage the net debt/EBITDA ratio was 2.831,2,3 as of March 31, 2019. Including the IFRS 16 effect, the reported net debt/EBITDA ratio increased to 3.532,3.
1 Adjusted for IFRS 16 effect
2 At LTM average exchange rates for both net debt and EBITDA; pro forma closed acquisitions/divestitures
3 Before special items
For a detailed overview of special items and adjustments please see the reconciliation tables on pages 19-22 of the PDF file.
Business Segments
Fresenius Medical Care (Figures according to Fresenius Medical Care Investor News)
Fresenius Medical Care is the world's largest provider of products and services for individuals with renal diseases. As of March 31, 2019, Fresenius Medical Care was treating 336,716 patients in 3,971 dialysis clinics. Along with its core business, the company provides related medical services in the field of Care Coordination.
- 6% sales1,2 growth in constant currency
- Earnings supported by agreements that materialized earlier than planned
- Outlook confirmed
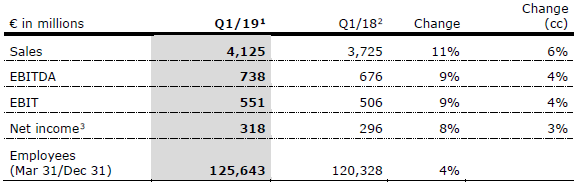
Adjusted for the Q1/18 contribution from the divested Care Coordination activities, the effect of the adoption of the IFRS 16 accounting standard (“IFRS 16 effect”) and the contribution from NxStage, sales increased by 11% (6% at constant currency) to €4,125 million (Q1/18: €3,725 million). Organic sales growth was 6%. Positive currency translation effects of 5% were mainly related to the appreciation of the U.S. dollar against the euro.
Health Care Services sales1,2 increased by 12% (6% at constant currency) to €3,316 million (Q1/18: €2,958 million). Health Care Products sales1,2 increased by 5% (4% at constant currency) to €809 million (Q1/18: €767 million).
In North America, sales1,2 increased by 14% (5% in constant currency) to €2,879 million (Q1/18: €2,523 million). Health Care Services sales1,2 increased by 14% (6% in constant currency) to €2,679 million (Q1/18: €2,339 million).
1 On an adjusted basis: before expenses associated with the cost optimization program, the IFRS 16 effect, excluding effects from NxStage transaction
2 Q1/18 adjusted for divestitures of Care Coordination activities
3 Net income attributable to shareholders of Fresenius Medical Care AG & Co. KGaA
For a detailed overview of special items and adjustments please see the reconciliation tables on pages 19-22 of the PDF file.
Sales2 outside North America increased by 4% (6% in constant currency) to €1,246 million (Q1/18: €1,202 million). Health Care Services sales2 increased by 3% (8% in constant currency) to €637 million (Q1/18: €619 million). Health Care Product sales2 adjusted increased by 4% (5% in constant currency) to €609 million (Q1/18: €583 million).
Fresenius Medical Care’s EBIT3 increased by 9% (4% in constant currency) to €551 million (Q1/18: €506 million). The EBIT margin3 decreased to 13.4% (Q1/18: 13.6%).
Net income1,3 increased by 8% (3% in constant currency) to €318 million (Q1/18: €296 million).
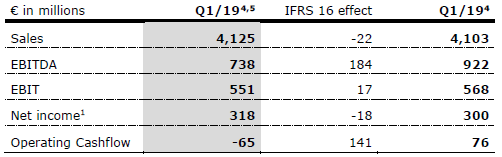
Operating cash flow was €76 million (Q1/18: -€45 million) with a margin of 1.8% (Q1/18: -1.1%). The increase was mainly driven by the adoption of the IFRS 16 accounting standard leading to a reclassification of the repayment portion of rent to financing activities (€141 million). Adjusted for the IFRS 16 effect, operating cash flow was -€65 million.
For FY/19, Fresenius Medical Care expects adjusted sales to grow by 3% to 7%2,6 in constant currency. Net income1 is expected to develop in the range of -2% to +2%3,7 in constant currency.
For further information, please see Fresenius Medical Care’s Investor News at www.freseniusmedicalcare.com.
1 Net income attributable to shareholders of Fresenius Medical Care AG & Co. KGaA
2 Q1/18 adjusted for divestitures of Care Coordination activities; Q1/19 adjusted for IFRS 16 effects, excluding effects from NxStage transaction
3 Q1/18 before special items and after adjustments; Q1/19 before special items (before transaction-related expenses, expenses associated with the cost optimization program), adjusted for IFRS 16 effect, excluding effects from NxStage transaction
4 Before special items (operating cash flow after special items)
5 Adjusted for IFRS 16 effect
6 FY/18 base: €16,026 million
7 FY/18 base: €1,341 million
For a detailed overview of special items and adjustments please see the reconciliation tables on pages 19-22 of the PDF file.
Fresenius Kabi
Fresenius Kabi offers intravenously administered generic drugs, clinical nutrition and infusion therapies for seriously and chronically ill patients in the hospital and outpatient environments. The company is also a leading supplier of medical devices and transfusion technology products. In the biosimilars business, Fresenius Kabi develops products with a focus on oncology and autoimmune diseases.
- 4% organic sales growth and 7% EBIT1 growth in constant currency
- High prior-year base impacts organic sales growth in North America
- FY/19 outlook confirmed
Sales increased by 6% (4% in constant currency) to €1,701 million (Q1/18: €1,603 million). Organic sales growth was 4%. Positive currency translation effects of 2% were mainly related to the appreciation of the U.S. dollar against the euro.
Sales in Europe grew by 3% (organic growth: 3%) to €573 million (Q1/18: €557 million). Sales in North America increased by 5% (decreased organically by 2% from a high prior-year basis) to €623 million (Q1/18: €591 million). Sales in Asia-Pacific increased by 13% (organic growth: 11%) to €341 million (Q1/18: €301 million). Sales in Latin America/Africa increased by 6% (organic growth: 18%) to €164 million (Q1/18: €154 million).
EBIT1 increased by 13% (7% in constant currency) to €303 million (Q1/18: €268 million) with an EBIT margin1 of 17.8% (Q1/18: 16.7%).
Net income1,2 increased by 19% (12% in constant currency) to €203 million (Q1/18: €170 million).
Operating cash flow3 was €132 million (Q1/18: €226 million). After a strong Q4/18, operating cash flow was impacted by working capital changes, for example by some phasing of payments and stockbuild to prepare for a possible Brexit. The cash flow margin was 7.8% (Q1/18: 14.1%).
Fresenius Kabi confirms its outlook for FY/19 and expects organic sales growth4 of 3% to 6% and EBIT growth5 in constant currency of 3% to 6%.
1 On a comparable basis: before special items and adjusted for IFRS 16 effect
2 Net income attributable to shareholders of Fresenius SE & Co. KGaA
3 Adjusted for IFRS 16 effect, before special items (operating cash flow after special items)
4 On a comparable basis: FY/18 base: €6,544 million; FY/19 before special items (acquisition-related expenses, revaluations of biosimilars contingent liabilities) and adjusted for IFRS 16 effect
5 On a comparable basis: FY/18 base: €1,139 million; FY/18 before special items; FY/19 before special items (acquisition-related expenses, revaluations of biosimilars contingent liabilities) and adjusted for IFRS 16 effect.
For a detailed overview of special items and adjustments please see the reconciliation tables on pages 19-22 of the PDF file.
Fresenius Helios
Fresenius Helios is Europe's leading private hospital operator. The company comprises Helios Germany and Helios Spain (Quirónsalud). Helios Germany operates 86 hospitals, ~125 outpatient centers and treats approximately 5.3 million patients annually. Quirónsalud operates 47 hospitals, 56 outpatient centers and around 300 occupational risk prevention centers, and treats approximately 13.3 million patients annually.
- 4% organic sales growth
- Helios Germany stabilized; Helios Spain with continued dynamic growth
- FY/19 outlook confirmed
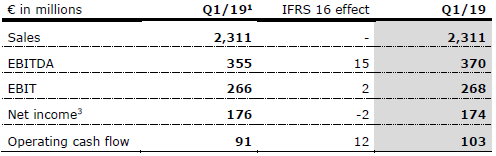
Sales decreased by 1% (increased by 4%1; organic growth: 4%) to €2,311 million (Q1/18: €2,331 million).
Sales of Helios Germany decreased by 6% (increased by 1%1; organic growth: 2%) to €1,485 million (Q1/18: €1,574 million). Sales were impacted by a decline in admissions in Germany, partially due to the transfer of the post-acute care business from Helios to Vamed, a shortage of nurses at selected intensive care units and a less pronounced flu season. The admission decline was more than compensated by positive price effects.
Helios Spain increased sales by 9% (organic growth: 9%) to €826 million (Q1/18: €757 million), mainly driven by the private sector. The occupational risk prevention business also had a valuable contribution. Performance in Q1/18 was impacted by the Easter holidays.
1 Adjusted for the post-acute care business transferred to Fresenius Vamed as of July 1, 2018
2 Adjusted for IFRS 16 effect
3 Net income attributable to shareholders of Fresenius SE & Co. KGaA
For a detailed overview of special items and adjustments please see the reconciliation tables on pages 19-22 of the PDF file.
EBIT1 of Fresenius Helios decreased by 4% (-3%2) to €266 million (Q1/18: €278 million) with an EBIT margin of 11.5% (Q1/18: 11.9%).
EBIT1 of Helios Germany decreased by 16% (-14%2) to €149 million (Q1/18: €177 million). The EBIT margin improved sequentially by 50 bps to 10.0% (Q4/18: 9.5%). The development of Helios Germany is impacted by the admissions decline and the investments for preparatory structural measures.
EBIT1 of Helios Spain increased by 16% to €119 million (Q1/18: €103 million), mainly due to the strong operating performance with an EBIT margin of 14.4% (Q1/18: 13.6%).
Net income1,3 decreased by 8% to €176 million (Q1/18: €191 million).
Operating cash flow1 was €91 million (Q1/18: €97 million) with a margin of 3.9% (Q1/18: 4.2%). The decrease is mainly attributable to the increase in days sales outstanding (DSO).
Fresenius Helios confirms its outlook for FY/19 and expects organic sales growth of 2% to 5% and an EBIT1 growth of -5% to -2%.
1 Adjusted for IFRS 16 effect
2 Adjusted for the post-acute care business transferred to Fresenius Vamed as of July 1, 2018
3 Net income attributable to shareholders of Fresenius SE & Co. KGaA
For a detailed overview of special items and adjustments please see the reconciliation tables on pages 19-22 of the PDF file.
Fresenius Vamed
Fresenius Vamed manages projects and provides services for hospitals and other health care facilities worldwide and is a leading post-acute care provider in Central Europe. The portfolio ranges along the entire value chain: from project development, planning, and turnkey construction, via maintenance and technical management to total operational management.
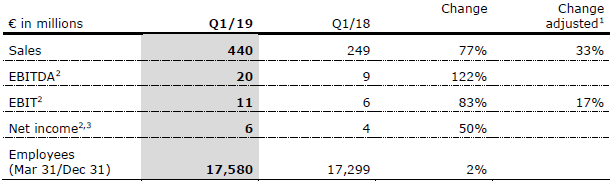
- Excellent organic sales growth of 31%
- Order backlog at all-time high ‒ strong foundation for future growth
- FY/19 outlook confirmed
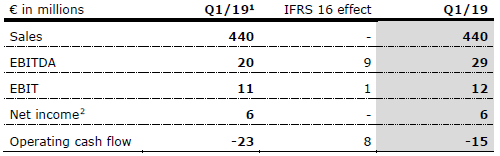
Sales increased by 77% (33%1) to €440 million (Q1/18: €249 million). Organic sales growth was 31%, acquisitions contributed 2% to growth. Both the project and the service business showed strong momentum. Sales of the project business increased by 17% to €108 million (Q1/18: €92 million). Sales in the service business grew by 111% (41%1) to €332 million (Q1/18: €157 million), supported by an intensified collaboration with Fresenius Helios.
In Q1/19, EBIT2 increased by 83% (83%2 in constant currency) to €11 million (Q1/18: €6 million) with an EBIT margin of 2.5% (Q1/18: 2.4%). EBIT2 additionally adjusted for the acquisition of the German post-acute care business was €7 million with an EBIT margin of 2.1%.
Net income2,3 increased by 50% to €6 million (Q1/18: €4 million).
Order intake increased by 47% to €383 million (Q1/18: €260 million). As of March 31, 2019, order backlog reached a new all-time high of €2,698 million (Dec 31, 2018: €2,420 million).
Operating cash flow2 increased by 45% to €-23 million (Q1/18: €-42 million) with a margin of -5.2% (Q1/18: -16.9%).
Fresenius Vamed confirms its outlook for FY/19 and expects organic sales growth of ~10% and EBIT growth2 of 15% to 20%.
1 Adjusted for German post-acute care business acquired from Fresenius Helios as of July 1, 2018
2 Adjusted for IFRS 16 effect
3 Net income attributable to shareholders of VAMED AG
For a detailed overview of special items and adjustments please see the reconciliation tables on pages 19-22 of the PDF file.
Conference Call
As part of the publication of the results for the first quarter 2019, a conference call will be held on May 2, 2019 at 1:30 p.m. CET (7:30 a.m. EST). All investors are cordially invited to follow the conference call in a live broadcast over the Internet at www.fresenius.com/investors. Following the call, a replay will be available on our website.
For additional information on the performance indicators used please refer to our website www.fresenius.com/alternative-performance-measures.
This release contains forward-looking statements that are subject to various risks and uncertainties. Future results could differ materially from those described in these forward-looking statements due to certain factors, e.g. changes in business, economic and competitive conditions, regulatory reforms, results of clinical trials, foreign exchange rate fluctuations, uncertainties in litigation or investigative proceedings, and the availability of financing. Fresenius does not undertake any responsibility to update the forward-looking statements in this release.
- Delivered on FY/18 Group targets
- Fresenius Kabi to show continued growth
- Helios Germany impacted by regulatory changes and initiatives to secure medium-term growth; Helios Spain to show continuous dynamic growth
- 26th consecutive dividend increase proposed
- Healthy growth targets for 2020 – 2023; consistent with expectations from December 2018
1 Growth rate adjusted for IFRS 15 adoption and divestitures of Care Coordination activities (Q4/17 base: €8,290 million; FY/17 base: €32,841 million)
2 Before special items and after adjustments
3 Net income attributable to shareholders of Fresenius SE & Co. KGaA
For a detailed overview of special items and adjustments please see the reconciliation tables on pages 21-24 of the pdf file.
Group expectations for FY/19 confirmed
For FY/19, Fresenius projects sales growth1 of 3% to 6% in constant currency. Net income2,3 growth is expected to be ~0% in constant currency. NxStage is not included in this guidance because the acquisition is not closed yet and Fresenius does not expect a significant impact on its Group guidance metrics. This guidance is in line with the expectations announced on December 6, 2018.
Fresenius expects its year-end 2019 net debt/EBITDA4 ratio to be broadly stable over the year-end 2018 figure.
Fresenius intends to further increase its dividend for FY 2019.
Healthy growth targets5 for 2020 – 2023
Based on the expected financial results for FY/19, Group sales are projected to grow organically with a compounded annual growth rate (CAGR) of 4% to 7% in 2020 to 2023. Group net income2 is projected to increase organically with a CAGR of 5% to 9% in 2020 to 2023. Fresenius expects its launched and contemplated sales growth and efficiency improvement initiatives as well as the expected break-even of Fresenius Kabi’s biosimilars business to drive an acceleration of Group earnings growth over that period. Small and medium-sized acquisitions are expected to contribute an incremental CAGR of approx. 1%-point to both sales and net income growth.
1 FY/18 base: €33,009 million; FY/18 adjusted for divestitures of Care Coordination activities at FMC (H1/18); FY/19: adjusted for IFRS 16 effects; excluding effects from pending acquisition of NxStage by FMC
2 Net income attributable to shareholders of Fresenius SE & Co. KGaA
3 FY/18 base: €1,872 million; FY/18 before special items and after adjustments; FY/19 before special items (transcation-related expenses, expenses associated with the cost optimization program at FMC, revaluations of biosimilars contingent liabilities); adjusted for IFRS 16 effects; excluding effects from pending acquisition of NxStage by FMC
4 Both net debt and EBITDA calculated at expected annual average exchange rates; excluding effects from pending acquisition of NxStage by FMC; excluding further potential acquisitions; adjusted for IFRS 16 effects
5 Before special items
For a detailed overview of special items and adjustments please see the reconciliation tables on pages 21-24 of the pdf file.
26th consecutive dividend increase proposed
Consistent with Fresenius’ stated dividend policy, the Management Board will propose to the Supervisory Board a 7% increase in the dividend for FY/18 to €0.80 per share (2017: €0.75). The proposed total dividend payout to Fresenius SE & Co. KGaA shareholders amounts to €445 million.
6% sales growth in constant currency1
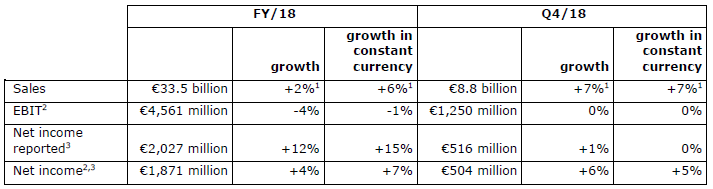
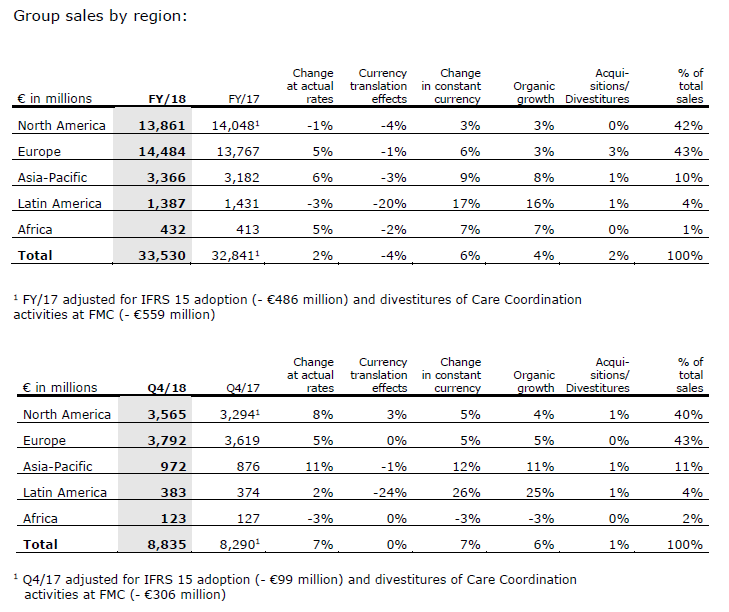
Group sales1 increased by 2%1 (6%1 in constant currency) to €33,530 million (FY/17: €32,841 million). Organic sales growth was 4%1. Acquisitions/divestitures contributed net 2%1 to growth. Negative currency translation effects of 4%1 were mainly driven by the devaluation of the U.S. dollar and the Argentinian peso against the euro.
In Q4/18, Group sales1 increased by 7%1 (7%1 in constant currency) to €8,835 million (Q4/17: €8,290 million). Organic sales1 growth was 6%1. Acquisitions/divestitures contributed net 1%1 to growth. There were no meaningful currency translation effects.
7% net income1,2 growth in constant currency
Group EBITDA2 decreased by 3%2 (0%2 in constant currency) to €5,991 million (FY/17: €6,174 million). Group EBIT2 decreased by 4%2 (-1%2 in constant currency) to €4,561 million (FY/17: €4,746 million). The EBIT margin2 was 13.6% (FY/17: 14.5%). Group EBIT2 before expenses for the further development of the biosimilars business decreased by 2%2 (increased by 1%2 in constant currency) to €4,727 million. In FY/17, the compensation for treatments of U.S. war veterans (“VA agreement”) had contributed €87 million as a one-time effect. Group EBIT2 excluding the VA agreement and expenses for the further development of the biosimilars business increased by 3% in constant currency.
In Q4/18, Group EBIT2 was broadly stable year-over-year2 (broadly stable2 in constant currency) at €1,250 million (Q4/17: €1,244 million), with an EBIT margin2 of 14.1% (Q4/17: 15.0%). Group EBIT2 excluding the prior-year VA agreement and expenses for the further development of the biosimilars business was also broadly stable year-over-year2 in constant currency.
Group net interest2 was -€570 million (FY/17: -€630 million). The decrease was mainly driven by refinancings at lower rates, lower debt, currency effects as well as proceeds from the divestitures of Care Coordination activities at Fresenius Medical Care.
The decrease of the Group tax rate2 to 22.0% (FY/17: 27.9%) was mainly due to the U.S. tax reform and some related one-time effects at Fresenius Medical Care and Fresenius Kabi. In Q4/18, the Group tax rate2 was 22.6% (Q4/17: 28.0%).
Noncontrolling interest2 was €1,240 million (2017: €1,164 million), of which 94% was attributable to the noncontrolling interest in Fresenius Medical Care.
1Net income attributable to shareholders of Fresenius SE & Co. KGaA
2Before special items and after adjustments
Group net income1,2 increased by 12% (15% in constant currency) to €2,027 million (FY/17: €1,814 million), mainly due to gains related to divestitures of Care Coordination activities at Fresenius Medical Care. Earnings per share1,2 increased by 12% (15% in constant currency) to €3.65 (FY/17: €3.27). In Q4/18, Group net income1,2 increased by 1% (0% in constant currency) to €516 million (Q4/17: €511 million). Earnings per share1,2 increased by 1% (0% in constant currency) to €0.93 (Q4/17: €0.92).
Group net income1,3 before special items increased by 3% (6% in constant currency) to €1,871 million (FY/17: €1,816 million). Earnings per share1,3 increased by 3% (6% in constant currency) to €3.37 (FY/17: €3.28). In Q4/18, Group net income1,3 increased by 3% (3% in constant currency) to €504 million (Q4/17: €487 million). Earnings per share1,3 increased by 3% (3% in constant currency) to €0.91 (Q4/17: €0.88).
Group net income1,4 before special items and after adjustments increased by 4% (7% in constant currency) to €1,871 million (FY/17: €1,804 million). Earnings per share1,4 increased by 3% (6% in constant currency) to €3.37 (FY/17: €3.26). In Q4/18, Group net income1,4 increased by 6% (5% in constant currency) to €504 million (Q4/17: €477 million). Earnings per share1,4 increased by 6% (5% in constant currency) to €0.91 (Q4/17: €0.86).
Group net income1,4,5 before expenses for the further development of the biosimilars business increased by 8% (11% in constant currency) to €1,991 million (2017: €1,847 million). Earnings per share1,4,5 increased by 8% (11% in constant currency) to €3.58 (2017: €3.33). In Q4/18, Group net income1,4,5 increased by 6% (6% in constant currency) to €542 million (Q4/17: €510 million). Earnings per share1,4,5 increased by 5% (5% in constant currency) to €0.97 (Q4/17: €0.92).
1Net income attributable to shareholders of Fresenius SE & Co. KGaA
2After special items
3Before special items
4Before special items and after adjustments
5Before expenses for the further development of the biosimilar business
Continued investment in growth
Spending on property, plant and equipment was €2,163 million (FY/17: €1,828 million), primarily for the modernization and expansion of dialysis clinics, production facilities as well as hospitals and day clinics. This corresponds to 6% of sales.
Total acquisition spending was €1,086 million (FY/17: €6,852 million). FY/17 spending had included the acquisition of Quirónsalud as well as the acquisition of the biosimilars business of Merck KGaA.
Cash flow development
Group operating cash flow decreased by 5% to €3,742 million (FY/17: €3,937 million) with a margin of 11.2% (FY/17: 11.6%). In FY/17 Fresenius Medical Care had received a ~€200 million payment under the VA agreement. The FY/18 cash flow was impacted by a change in working capital items at Fresenius Helios, the earnings decrease at Helios Germany and negative currency translation effects. Operating cash flow in Q4/18 increased by 7% to €1,193 million (Q4/17: €1,116 million) with a margin of 13.5% (Q4/17: 12.8%).
Given the effects described above in combination with growing investments, free cash flow before acquisitions and dividends decreased to €1,665 million (FY/17: €2,232 million). Free cash flow after acquisitions and dividends was €1,374 million (FY/17: -€4,557 million).
Solid balance sheet structure
The Group’s total assets increased by 7% (5% in constant currency) to €56,703 million (Dec. 31, 2017: €53,133 million). Current assets grew by 17% (17% in constant currency) to €14,790 million (Dec. 31, 2017: €12,604 million). Non-current assets increased by 3% (2% in constant currency) to €41,913 million (Dec. 31, 2017: €40,529 million).
Total shareholders’ equity increased by 15% (13% in constant currency) to €25,008 million (Dec. 31, 2017: €21,720 million). The equity ratio increased to 44.1% (Dec. 31, 2017: 40.9%).
Group debt was broadly stable (decreased by 2% in constant currency) at €18,984 million (Dec. 31, 2017: €19,042 million). Group net debt decreased by 6% (-8% in constant currency) to €16,275 million (Dec. 31, 2017: €17,406 million) mainly due to the proceeds from divestitures of Care Coordination activities at Fresenius Medical Care.
As of December 31, 2018, the net debt/EBITDA ratio was 2.711,2 (December 31, 2017: 2.841,2). Excluding the proceeds from divestitures of Care Coordination activities the net debt/EBITDA ratio was 2.911,2.
1At LTM average exchange rates for both net debt and EBITDA; pro forma closed acquisitions/divestitures, excluding effects from pending acquisition of NxStage by FMC
2Before special items
Business Segments
Fresenius Medical Care
Fresenius Medical Care is the world's largest provider of products and services for individuals with renal diseases. As of December 31, 2018, Fresenius Medical Care was treating 333,331 patients in 3,928 dialysis clinics. Along with its core business, the company provides related medical services in the field of Care Coordination.
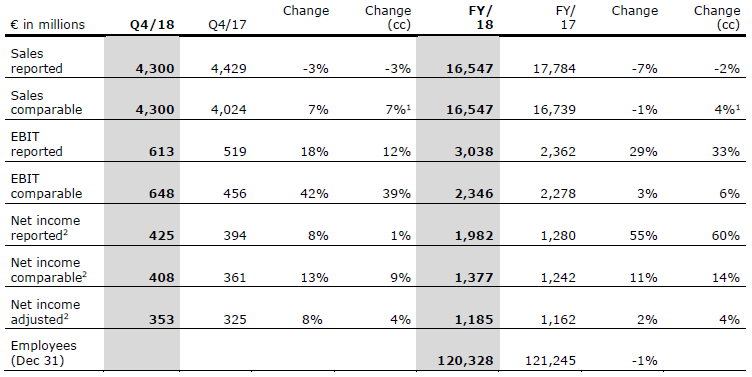
- 7% comparable sales growth in constant currency in Q4/18
- 9% comparable2 net income increase in constant currency in Q4/18
- Attractive share buyback program for 2019 and 2020
- Outlook for FY/19 (in constant currency): 3% to 7% adjusted sales growth3 and adjusted net income development4 in range of -2% to +2% expected
1Excluding VA agreement Q4/18: 6%; FY/18: 4%
2Net income attributable to shareholders of Fresenius Medical Care AG & Co. KGaA
3FY/18 base: €16,026 million; FY/18 adjusted for divestitures of Care Coordination activities; FY/19 adjusted for IFRS 16 effects, excluding effects from pending NxStage transaction
4FY/18 base: €1,341 million; FY/18 before special items and after adjustments; FY/19 before special items (before transcation-related expenses, expenses associated with the cost optimization program), adjusted for IFRS 16 effects, excluding effects from pending NxStage transaction
Sales decreased by 7% (-2% in constant currency) to €16,547 million (FY/17: €17,784 million). Organic sales growth was 4%. Currency translation effects reduced sales by 5%. The adoption of IFRS 15 reduced sales by 3%.
With the FY/17 base additionally adjusted for divestitures of Care Coordination activities, sales decreased by 1% (increased by 4% in constant currency).
In Q4/18, sales decreased by 3% (-3% in constant currency) to €4,300 million (Q4/17: €4,429 million). Organic sales growth was 6%. The adoption of IFRS 15 reduced sales by 2%. Q4/17 base additionally adjusted for divestitures of Care Coordination activities, sales in Q4/18 increased by 7% (7% in constant currency).
Health Care services sales1 (dialysis services and care coordination) decreased by 2% (increased by 4% in constant currency) to €13,264 million (FY/17: €13,487 million). Health Care product sales increased by 1% (5% in constant currency) to €3,283 million (FY/17: €3,252 million).
In North America, sales1 decreased by 2% (increased by 2% in constant currency) to €11,570 million (FY/17: €11,834 million). Health Care services sales1 decreased by 2% (increased by 2% in constant currency) to €10,725 million (FY/17: €10,991 million). Excluding the FY/17 effect from the VA Agreement (€94 million), Health Care services sales1 increased by 3% in constant currency. Health Care product sales of €845 million (FY/17: €843 million) were on the prior-year level (increased by 5% in constant currency).
1On a comparable basis
Sales outside North America increased by 1% (8% in constant currency) to €4,962 million (FY/17: €4,890 million). Health Care services sales increased by 2% (11% in constant currency) to €2,539 million (FY/17: €2,496 million). Health Care product sales increased by 1% (5% in constant currency) to €2,423 million (FY/17: €2,394 million).
Fresenius Medical Care’s EBIT increased by 29% (33% in constant currency) to €3,038 million (FY/17: €2,362 million), mainly driven by gains related to divestitures of Care Coordination activities. The EBIT margin increased to 18.4% (FY/17: 13.3%). EBIT on a comparable basis increased by 6% in constant currency and EBIT margin increased to 14.2% (FY/17: 13.6%).
In Q4/18, EBIT increased by 18% (12% in constant currency) to €613 million (Q4/17: €519 million). The EBIT margin increased to 14.3% (Q4/17: 11.7%). EBIT on a comparable basis increased by 42% (increased by 39% in constant currency) and EBIT margin increased to 15.1% (Q4/17: 11.3%).
Net income1 increased by 55% (60% in constant currency) to €1,982 million (FY/17: €1,280 million). Net income1 growth on a comparable basis was 14% in constant currency. Adjusted net income1 growth was 4% in constant currency.
In Q4/18, net income1 increased by 8% (1% in constant currency) to €425 million (Q4/17: €394 million). Net income1 growth on a comparable basis was 9% in constant currency. Adjusted net income1 growth was 4% in constant currency.
Operating cash flow was €2,062 million (FY/17: €2,192 million). The cash flow margin increased to 12.5% (FY/17: 12.3%). In Q4/18, operating cash flow was €698 million (Q4/17: €528 million). The cash flow margin increased to 16.2% (Q4/17: 11.9%).
For FY/19, Fresenius Medical Care expects adjusted sales to grow by 3% to 7%2 in constant currency. Net income1 is expected to develop in the range of -2% to +2%3 in constant currency in 2019.
For 2020, Fresenius Medical Care expects adjusted sales as well as adjusted net income to grow at a mid to high single digit rate, both at constant currency.
For further information, please see Fresenius Medical Care’s Press Release at www.freseniusmedicalcare.com.
1Net income attributable to shareholders of Fresenius Medical Care AG & Co. KGaA
2FY/18 base: €16,026 million; FY/18 adjusted for divestitures of Care Coordination activities (H1/18); FY/19 adjusted for IFRS 16 effects, excluding effects from pending NxStage transaction
3FY/18 base: €1,341 million; FY/18 before special items and after adjustments; FY/19 before special items (before transaction-related expenses, expenses associated with the cost optimization program), adjusted for IFRS 16 effects, excluding effects from pending NxStage transaction
Fresenius Kabi
Fresenius Kabi offers intravenously administered generic drugs, clinical nutrition and infusion therapies for seriously and chronically ill patients in the hospital and outpatient environments. The company is also a leading supplier of medical devices and transfusion technology products. In the biosimilars business, we are developing products with a focus on oncology and autoimmune diseases.
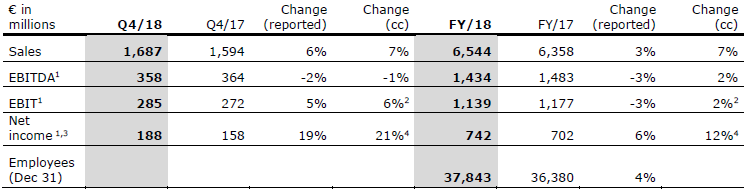
- 7% organic sales growth and 10% EBIT1 growth in constant currency (excl. biosimilars expenses) in FY/18
- Operating cash flow at all-time high
- FY/19 outlook: 3% to 6% organic sales growth5 and 3% to 6% EBIT6 growth in constant currency expected
1Before special items
2Before expenses for the further development of the biosimilars business: Q4/18: 8%; FY/18: 10%
3Net income attributable to shareholders of Fresenius SE & Co. KGaA
4Before expenses for the further development of the biosimilars business: Q4/18: 20%; FY/18: 21%
5FY/18 base: €6,544 million; FY/19 adjusted for IFRS 16 effects
6FY/18 base: €1,139 million; FY/18 before special items including expenditures for further development of biosimilars business (€120 million after tax); FY/19 before special items (before transaction-related expenses, revaluations of biosimilars contingent liabilities), adjusted for IFRS 16 effects
Sales increased by 3% (7% in constant currency) to €6,544 million (FY/17: €6,358 million). Organic sales growth was 7%. Strong negative currency translation effects of 4% were mainly related to the devaluation of the U.S. dollar, the Argentinian peso and the Brazilian real against the euro. In Q4/18, sales increased by 6% (7% in constant currency) to €1,687 million (Q4/17: €1,594 million). Organic sales growth was 7%.
Sales in Europe grew by 2% (organic growth: 3%) to €2,248 million (FY/17: €2,214 million). In Q4/18, sales in Europe increased by 2% (organic growth: 3%) to €590 million.
Sales in North America increased by 3% (organic growth: 8%) to €2,359 million (FY/17: €2,290 million). In Q4/18, sales increased by 8% (organic growth: 5%) to €599 million (Q4/17: €554 million).
Sales in Asia-Pacific increased by 9% (organic growth: 12%) to €1,300 million (FY/17: €1,196 million). In Q4/18, sales increased by 11% (organic growth: 13%) to €336 million (Q4/17: €302 million).
Sales in Latin America/Africa decreased by 3% (increased organically by 13%) to €637 million (FY/17: €658 million). In Q4/18, sales increased by 2% (organical growth: 18%) to €162 million (Q4/17: €159 million).
EBIT1 decreased by 3% (increased by 2% in constant currency) to €1,139 million (FY/17: €1,177 million) with an EBIT margin1 of 17.4% (FY/17: 18.5%). In Q4/18, EBIT1 increased by 5% (6% in constant currency) to €285 million (Q4/17: €272 million) with an EBIT margin1 of 16.9% (Q4/17: 17.1%).
EBIT1 before expenses for the further development of the biosimilars business increased by 5% (10% in constant currency) to €1,305 million (FY/17: €1,237 million) with an EBIT margin1 of 19.9% (FY/17: 19.5%). In Q4/18, EBIT1 before expenses for the further development of the biosimilars business increased by 6% (8% in constant currency) to €338 million (Q4/17: €318 million) with an EBIT margin1 of 20.0% (Q4/17: 19.9%).
Net income1,2 increased by 6% (12% in constant currency) to €742 million (FY/17: €702 million). In Q4/18, net income1,2 increased by 19% (21% in constant currency) to €188 million (Q4/17: €158 million).
Operating cash flow increased by 3% to on an all-time-high of €1,040 million (2017: €1,010 million), mainly driven by a strong operational performance. The cash flow margin was 15.9% (2017: 15.9%).
For FY/19, Fresenius Kabi expects organic sales growth3 of 3% to 6% and EBIT growth4 in constant currency of 3% to 6%.
1Before special items
2Net income attributable to shareholders of Fresenius SE & Co. KGaA
3FY/18 base: €6,544 million; FY/19 adjusted for IFRS 16 effects
4FY/18 base: €1,139million; FY/18 before special items including expenditures for further development of biosimilars business (€120 million after tax); FY/19 before special items (before acquisition-related expenses, revaluations of biosimilars contingent liabilities), adjusted for IFRS 16 effects
Fresenius Helios
Fresenius Helios is Europe's leading private hospital operator. The company comprises Helios Germany and Helios Spain (Quirónsalud). Helios Germany operates 86 hospitals, ~125 outpatient centers and treats approximately 5.3 million patients annually. Quirónsalud operates 47 hospitals, 57 outpatient centers and around 300 occupational risk prevention centers, and treats approximately 13.3 million patients annually.
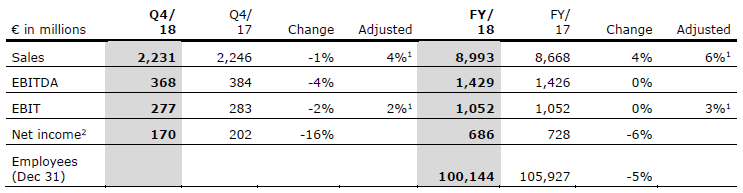
- 4% organic sales growth in Q4/18
- DRG catalogue effects and preparatory initiatives for regulatory changes continue to weigh on Helios Germany
- Helios Spain with dynamic growth
- FY/19 outlook3: 2% to 5% organic sales growth and EBIT decline of -5% to -2% expected
As of July 1, 2018 Fresenius Helios transferred its German post-acute care business to Fresenius Vamed. To allow a like-for-like comparison, we also provide sales and EBIT growth rates adjusted for the effects of this transaction.
Fresenius Helios increased sales by 4% (6%1) to €8,993 million (FY/17: €8,668 million). Organic sales growth was 3%. In Q4/18, sales decreased by 1% (increased by 4%1; organic growth: 4%) to €2,231 million (Q4/17: €2,246 million).
Sales of Helios Germany decreased by 2% (increased by 2%1; organic growth: 2%) to €5,970 million (FY/17: €6,074 million). In Q4/18, sales decreased by 5% (increased by 3%1; organic growth: 3%) to €1,439 million (Q4/17: €1,512 million). Sales were impacted by a decline in admissions, inter alia due to an unexpectedly high fluctuation among doctors and a shortage of nursing staff as well as a trend towards outpatient treatments. The volume decline was offset by DRG inflator increases and better results from the negotiations with our payors.
Helios Spain increased sales by 17% (organic growth: 6%) to €3,023 million (FY/17: €2,594 million), mainly due to an excellent operating performance and an additional month of consolidation (Quirónsalud is consolidated since February 1, 2017). In Q4/18 Helios Spain increased sales by 8% (organic growth: 7%) to €792 million (Q4/17: €734 million).
Fresenius Helios EBIT remained unchanged (increased by 3%1) at €1,052 million (FY/17: €1,052 million) with a margin of 11.7% (FY/17: 12.1%). In Q4/18, EBIT decreased by 2% (increased by 2%1) to €277 million (Q4/17: €283 million) with a margin of 12.4% (Q4/17: 12.6%).
EBIT of Helios Germany decreased by 14% (-10%1) to €625 million (FY/17: €725 million) with a margin of 10.5% (FY/17: 11.9%). In Q4/18, EBIT decreased by 22% (-15%1) to €137 million (Q4/17: €176 million) with a margin of 9.5% (Q4/17: 11.6%). The significant fixed cost base in the hospital business has a strong operating leverage effect on EBIT as market dynamics and sales development slow down. The development of Helios Germany is impacted by additional catalogue effects, preparatory structural measures for expected regulatory requirements (e.g. clustering) and a lack of privatization opportunities in the German market. An unexpectedly high fluctuation among doctors and a shortage of nursing staff have an additional negative impact on the earnings development.
EBIT of Helios Spain increased by 26% to €413 million (FY/17: €327 million), mainly due to the strong operating performance and the additional month of consolidation, with a margin of 13.7% (FY/17: 12.6%). In Q4/18, EBIT increased by 19% to €127 million (Q4/17: €107 million) with a margin of 16.0% (Q4/17: 14.6%).
Net income2 of Fresenius Helios decreased by 6% to €686 million (FY/17: €728 million). In Q4/18, net income2 decreased by 16% to €170 million (Q4/17: €202 million).
Operating cash flow was €554 million (FY/17: €733 million) with a margin of 6.2% (FY/17: 8.5%). The decrease is mainly attributable to the earnings decrease at Helios Germany and the changes in working capital.
For FY/19, Fresenius Helios expects organic sales growth of 2% to 5% and an EBIT3 decline of -5% to -2%.
1Adjusted for German post-acute care business transferred to Fresenius Vamed
2Net income attributable to shareholders of Fresenius SE & Co. KGaA
3Adjusted for IFRS 16 effects
Fresenius Vamed
Fresenius Vamed manages projects and provides services for hospitals and other health care facilities worldwide and is a leading post-acute care provider in Central Europe. The portfolio ranges along the entire value chain: from project development, planning, and turnkey construction, via maintenance and technical management to total operational management.
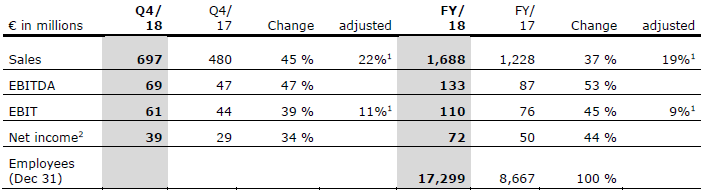
- Excellent organic sales growth of 16% in FY/18
- Order intake at all-time high - strong foundation for future growth
- FY/19 outlook: ~10% organic sales growth and 15% to 20% EBIT growth3 expected
As of July 1, 2018 Fresenius Helios transferred its German post-acute care business to Fresenius Vamed. To allow for a like-for-like comparison, we also provide sales and EBIT growth rates adjusted for the effects of this transaction.
Sales increased by 37% (19%1) to €1,688 million (FY/17: €1,228 million). Organic sales growth was 16% with a strong momentum in both the project and service businesses as well as increased sales from services for Fresenius Helios. Sales of the project business increased by 17% to €712 million (FY/17: €606 million). Sales in the service business grew by 57% (20%1) to €976 million (FY/17: €622 million). In Q4/18, sales increased by 45% (22%1; organic growth: 20%) to €697 million (Q4/17: €480 million).
EBIT increased by 45% (9%1) to €110 million (FY/17: €76 million) with a margin of 6.5% (FY/17: 6.2%). In Q4/18, EBIT increased by 39% (11%1) to €61 million (Q4/17: €44 million) with a margin of 8.8% (Q4/17: 9.2%).
Net income2 increased by 44% to €72 million (FY/17: €50 million). In Q4/18, net income2 increased by 34% to €39 million (FY/17: €29 million).
Order intake increased by 12% to €1,227 million (FY/17: €1,096 million) and reached a new all-time high. As of December 31, 2018, order backlog was €2,420 million (December 31, 2017: €2,147 million).
For FY/19, Fresenius Vamed expects organic sales growth in the range of ~10% and EBIT growth3 of 15% to 20%.
1Without German post-acute care business acquired from Fresenius Helios
2Net income attributable to shareholders of VAMED AG
3Including the German post-acute care business acquired from Fresenius Helios, adjusted for IFRS 16 effects
Conference Call
As part of the publication of the results for fiscal year 2018, a conference call will be held on February 20, 2019 at 2 p.m. CET (8 a.m. EST). All investors are cordially invited to follow the conference call in a live broadcast over the Internet at www.fresenius.com/investors. Following the call, a replay will be available on our website.
This release contains forward-looking statements that are subject to various risks and uncertainties. Future results could differ materially from those described in these forward-looking statements due to certain factors, e.g. changes in business, economic and competitive conditions, regulatory reforms, results of clinical trials, foreign exchange rate fluctuations, uncertainties in litigation or investigative proceedings, and the availability of financing. Fresenius does not undertake any responsibility to update the forward-looking statements in this release.
Current Group expectations for FY 2019
Based on the current status of the Group’s budget process and its FY 2018 guidance, Fresenius expects mid-single digit organic sales growth for FY 2019. Group net income1,2, however, is expected to be broadly stable over FY 2018. Fresenius continues to seek both sales growth and efficiency improvement initiatives in order to enhance these expectations.
Current business segment expectations for FY 20193
For FY 2019, Fresenius Medical Care currently broadly assumes solid comparable4 sales growth and the comparable4 net income to be around the level of FY 2018.
Given its outstanding financial performance in FY 2018, Fresenius Kabi will enter 2019 from a tough comparison basis. In general anticipation of easing drug shortage benefits and meaningful expenses for the further development of its biosimilars portfolio Fresenius Kabi expects mid-single digit organic sales growth and low- to mid-single digit EBIT5 growth in constant currency.
Within Fresenius Helios’ expectation of low- to mid-single digit organic sales growth, Helios Spain continues to grow faster than Helios Germany. Helios Spain’s expected mid-single-digit EBIT growth will not fully offset the headwinds at Helios Germany resulting from regulatory changes and already started countermeasures. Thus, in aggregate, Fresenius Helios currently expects EBIT contraction at a low- to mid-single digit rate.
Fresenius Vamed expects underlying6 growth rates similar to previous years.
Current Group medium-term expectations
Given its current expectations for FY 2018 and FY 2019, Fresenius now believes its ambitious Group targets for 2020 will not be met.
From 2020 onwards, Fresenius now expects sustainable organic Group sales growth in the mid-single digits. Group net income7 is expected to grow organically slightly faster than sales. Upon Fresenius Kabi’s biosimilars business breaking even, Fresenius expects an acceleration of Group earnings growth. Unlike previous mid-term targets, these expectations exclude the effect of small- to medium-sized acquisitions.
In addition to the significant R&D and business development investments in FY 2017 and FY 2018, Fresenius expects record investments in 2019 in both, capex and opex. These investments will further strengthen the basis for sustainable mid-term growth and are testament to Fresenius’ confidence in the dynamic growth opportunities in all of its business segments and end-markets.
Stephan Sturm, CEO of Fresenius, said: “We remain highly confident that Fresenius is on track to continue growing healthily over the medium and long term. Our updated expectations reflect the significant changes made to our portfolio over the last two years. They do not reflect acquisitions, which, however, will remain an important source of growth going forward. Further strengthened by the investments we will make in our businesses next year, Fresenius will be even better positioned for the coming decade.”
Acquisitions
Current expectations include the NxStage acquisition by Fresenius Medical Care and exclude any effects related to Akorn, Inc. While mid-term expectations exclude the effects of small- to medium-sized acquisitions, Fresenius will continue to pursue its strategy of selective acquisitions in order to complement organic growth.
Growing dividend
For FY 2018, Fresenius expects to propose a dividend increase in line with earnings growth8, consistent with its stated dividend policy. The Company intends to further increase its dividend for FY 2019.
Next steps
Fresenius will announce detailed FY 2019 financial guidance and mid-term targets with the release of its FY 2018 results on February 20, 2019.
Conference Call
A conference call will be held on December 7, 2018 at 8 a.m. CET (2 a.m. EDT). All investors are cordially invited to follow the conference call in a live broadcast over the Internet at www.fresenius.com/investors. Following the call, a replay will be available shortly on our website.
# # #
For additional information on the performance indicators used please refer to our website at https://www.fresenius.com/alternative-performance-measures.
# # #
1In constant currency, before special items and effects of IFRS 16, incl. expenses for the further development of the biosimilars business, H1/18 adjusted for divestitures of Care Coordination activities. 2019 including NxStage operating results.
2Net income attributable to shareholders of Fresenius SE & Co. KGaA
3Business segment expectations before effects of IFRS 16
4“comparable” is on a constant currency basis and reflects an adjustment for those effects that are as per FMC’s view not related to FMC’s operating business performance such as, for example, the effects of IFRS 16, sizeable portfolio changes like the divestiture of Sound Inpatient Physicians Holdings or the pending acquisition of NxStage Medical Inc. or other effects of one-time nature like FCPA-related charges or the cost of the 2018 U.S. ballot initiatives. For the preliminary indicative 2019 guidance the “comparable” 2018 basis translates roughly at current currencies for sales in a range of €15,850 – 16,050 million and for net income in a range of €1,350 – 1,365 million. This is subject to fluctuations in the currency rates in the fourth quarter of 2018.
5Before special items, including expenses for the further development of the biosimilars business
6Before transfer of German post-acute care business from Fresenius Helios
7Net income attributable to shareholders of Fresenius SE & Co. KGaA; before special items
8Net income attributable to shareholders of Fresenius SE & Co. KGaA; in constant currency, before special items, incl. expenses for the further development of the biosimilars business, H2/17 adjusted for divestitures of Care Coordination activities
This release contains forward-looking statements that are subject to various risks and uncertainties. Future results could differ materially from those described in these forward-looking statements due to certain factors, e.g. changes in business, economic and competitive conditions, regulatory reforms, results of clinical trials, foreign exchange rate fluctuations, uncertainties in litigation or investigative proceedings, and the availability of financing. Fresenius does not undertake any responsibility to update the forward-looking statements in this release.
- Excellent performance of Fresenius Kabi across all regions and product categories
- Fresenius Medical Care’s sales and earnings growth below the Company’s expectations
- Preparatory initiatives for expected regulatory requirements and decline in admissions impact Helios Germany; Helios Spain with steady yet dynamic growth
- Strong momentum in both Vamed’s project and service businesses
Group guidance for 2018 confirmed and narrowed
As announced on October 16, 2018 Fresenius confirms and narrows its Group guidance1 for FY/18. This is mainly driven by an excellent development of Fresenius Kabi, which partially offset the lower than expected sales and earnings contributions of Fresenius Medical Care and Helios Germany. Group sales are expected to increase at the low end of the original 5% to 8%2 guidance range (in constant currency). Fresenius expects net income1,3,4 growth at the low end of the original 6% to 9% guidance range (in constant currency). Excluding expenditures for the further development of the biosimilars business, net income1,3,5 growth is projected at the low end of the original ~10% to 13% guidance range (in constant currency).
1 2018 before special items (excluding effects related to the Akorn and NxStage transactions, gains from divestitures of Care Coordination activities and increase of FCPA provision)
2 FY/17 base adjusted for IFRS 15 adoption (-€486 million) and divestitures of Care Coordination activities (-€558 million) at Fresenius Medical Care
3 Net income attributable to shareholders of Fresenius SE & Co. KGaA
4 FY/17 base: €1,804 million; FY/18 before special items; including contributions to the campaigns in the U.S. opposing state ballot initiatives at Fresenius Medical Care; including expenditures for further development of the biosimilars business at Fresenius Kabi (€43 million after tax in FY/17 and ~€120 million after tax in FY/18)
5 FY/17 base: €1,847 million; FY/18 before special items; including contributions to the campaigns in the U.S. opposing state ballot initiatives at Fresenius Medical Care; excluding expenditures for further development of the biosimilars business at Fresenius Kabi (€43 million after tax in FY/17 and ~€120 million after tax in FY/18)
If no timeframe is specified, information refers to Q1-3/18
Q3/18:
- Sales: €8.2 billion (+3%1, +4% in constant currency1)
- EBIT2: €1,112 million (+0%, +0% in constant currency)
- EBIT2 (excl. biosimilars business): €1,153 million (+3%, +2% in constant currency)
- Net income2,3: €445 million (+8%, +8% in constant currency)
- Net income2,3 (excl. biosimilars business): €474 million (+13%, +13% in constant currency)
Q1-3/18:
- Sales: €24.7 billion (+1%1, +5% in constant currency1)
- EBIT2: €3,311 million (-5%, -1% in constant currency)
- EBIT2 (excl. biosimilars business): €3,424 million (-3%, +2% in constant currency)
- Net income2,3: €1,367 million (+3%, +7% in constant currency)
- Net income2,3 (excl. biosimilars business): €1,449 million (+8%, +12% in constant currency)
1 Growth rates adjusted for IFRS 15 adoption and divestitures of Care Coordination activities (Q3/17 base: €7,927 million; Q1-3/17 base: €24,551 million)
2 Before special items (before expenses related to the Akorn transaction, gains from divestitures of Care Coordination activities and increase of FCPA provision); growth rates: 2017 base adjusted for divestitures of Care Coordination activities
3 Net income attributable to shareholders of Fresenius SE & Co. KGaA
For a detailed overview of special items please see the reconciliation tables on pages 19-20 in the PDF document.
5% sales growth in constant currency1
Group sales increased by 1%1 (5%1 in constant currency) to €24,695 million (Q1-3/17: €25,191 million). Organic sales growth was 4%. Acquisitions/divestitures contributed net 1% to growth. Negative currency translation effects of 4% were mainly driven by the devaluation of the U.S. dollar and the Chinese yuan against the euro. In Q3/18, Group sales increased by 3%1 (4%1 in constant currency) to €8,192 million (Q3/17: €8,297 million). Organic sales growth was 4%. Acquisitions/divestitures had no net contribution to growth. Currency translation effects reduced sales by 1%.
1 Growth rates adjusted for IFRS 15 adoption and divestitures of Care Coordination activities at Fresenius Medical Care (Q1-3/17 base: €24,551 million; Q3/17 base: €7,927 million)
Group sales by region:

7% net income1,2,3 growth in constant currency
Group EBITDA2 decreased by 4%3 (0%3 in constant currency) to €4,375 million (Q1-3/17: €4,579 million). Group EBIT2 decreased by 5%3 (-1%3 in constant currency) to €3,311 million (Q1-3/17: €3,522 million). The EBIT margin2 was 13.4% (Q1 3/17: 14.0%). Group EBIT2 before expenses for the further development of the biosimilars business decreased by 3%3 (increased 2%3 in constant currency) to €3,424 million. In the prior-year period the compensation for treatments of U.S. war veterans (“VA agreement”) contributed €88 million as a one-time effect. Group EBIT2 excluding the VA agreement and expenses for the further development of the biosimilars business increased by 4% in constant currency.
In Q3/18, Group EBIT3 was broadly stable year-over-year3 (broadly stable3 in constant currency) at €1,112 million (Q3/17: €1,129 million), with an EBIT margin2 of 13.6% (Q3/17: 13.6%). Group EBIT2 excluding the prior-year VA agreement and expenses for the further development of the biosimilars business increased by 2%3 in constant currency.
Group net interest2 was -€436 million (Q1-3/17: -€484 million). The decrease is mainly driven by currency effects as well as refinancing activities and the divestitures of Care Coordination activities.
The decrease of the Group tax rate before special items to 22.0% (Q1-3/17: 28.1%) was mainly due to the U.S. tax reform and some one time effects in Q3 at Fresenius Medical Care and Fresenius Kabi. In Q3/18, the Group tax rate2 was 21.4% (Q3/17: 27.4%).
Noncontrolling interest2 was €876 million (Q1-3/17: €854 million), of which 95% was attributable to the noncontrolling interest in Fresenius Medical Care.
1 Net income attributable to shareholders of Fresenius SE & Co. KGaA
2 Before special items
3 Base 2017 base adjusted for divestitures of Care Coordination activities
For a detailed overview of special items please see the reconciliation tables on pages 19-20 in the PDF document.
Group net income1,2 increased by 3%3 (7%3 in constant currency) to €1,367 million (Q1 3/17: €1,329 million). Earnings per share1,2 increased by 3%3 (7%3 in constant currency) to €2.46 (Q1-3/17: €2.40). In Q3/18, Group net income1,2 increased by 8%3 (8%3 in constant currency) to €445 million (Q3/17: €413 million). Earnings per share1,2 increased by 7%3 (7%3 in constant currency) to €0.80 (Q3/17: €0.75).
Group net income1,2,4 before expenses for the further development of the biosimilars business increased by 8%3 (12%3 in constant currency) to €1,449 million (Q1-3/17: €1,339 million). Earnings per share1,2,4 increased by 8%3 (12%3 in constant currency) to €2.61 (Q1-3/17: €2.42). In Q3/18, Group net income1,2,4 increased by 13%3 (13%3 in constant currency) to €474 million (Q3/17: €423 million). Earnings per share1,2,4 increased by 12%3 (12%3 in constant currency) to €0.85 (Q3/17: €0.77).
Group net income2,5 after special items increased by 16% (by 21% in constant currency) to €1,511 million (Q1-3/17: €1,303 million), mainly due to gains related to divestitures in Care Cordination activities at Fresenius Medical Care. Earnings per share2,5 increased by 16% (21% in constant currency) to €2.72 (Q1-3/17: €2.35). In Q3/18, Group net income2,5 increased by 6% (4% in constant currency) to €419 million (Q3/17: €396 million). Earnings per share2,5 increased by 6% (4% in constant currency) to €0.75 (Q3/17: €0.71).
1 Before special items
2 Net income attributable to shareholders of Fresenius SE & Co. KGaA
3 2017 base adjusted for divestitures of Care Coordination activities
4 Before expenses for the further development of the biosimilars business
5 After special items
For a detailed overview of special items please see the reconciliation tables on pages 19-20 in the PDF document.
Continued investment in growth
Spending on property, plant and equipment was €1,370 million (Q1-3/17: €1,137 million), primarily for the modernization and expansion of dialysis clinics, production facilities as well as hospitals and day clinics. This corresponds to 5.5% of sales.
Total acquisition spending was €876 million (Q1-3/17: €6,662 million). The prior-year period included the acquisition of Quirónsalud.
Cash flow development
Group operating cash flow decreased by 15% to €2,405 million (Q1-3/17: €2,821 million) with a margin of 9.7% (Q1-3/2017: 11.2%). The decrease is mainly due to two effects at Fresenius Medical Care in North America: Receipt of a ~€200 million payment under the VA agreement in the prior-year period as well as increased accounts receivable related to the addition of calcimimetics into the Medicare ESRD payment bundle. In addition, negative currency translation effects weighed on the cash flow development in Q1-3/18. Operating cash flow in Q3/18 increased by 1% to €1,149 million (Q3/17: €1,138 million), with a margin of 14.0% (Q3/17: 13.7%).
Given the effects described above and growing investments, free cash flow before acquisitions and dividends decreased to €1,049 million (Q1-3/17: €1,705 million). Free cash flow after acquisitions and dividends was €1,172 million (Q1-3/17: -€5,233 million).
Solid balance sheet structure
The Group’s total assets increased by 5% (4% in constant currency) to €55,723 million (Dec. 31, 2017: €53,133 million). Current assets grew by 16% (16% in constant currency) to €14,593 million (Dec. 31, 2017: €12,604 million). Non-current assets increased by 1% (broadly stable in constant currency) to €41,130 million (Dec. 31, 2017: € 40,529 million).
Total shareholders’ equity increased by 10% (9% in constant currency) to €23,998 million (Dec. 31, 2017: €21,720 million). The equity ratio increased to 43.1% (Dec. 31, 2017: 40.9%).
Group debt was broadly stable unchanged (decreased by 1% in constant currency) at €18,961 million (Dec. 31, 2017: € 19,042 million). Group net debt decreased by 5% (-6% in constant currency) to € 16,505 million (Dec. 31, 2017: € 17,406 million) mainly due to the proceeds from divestitures of Care Coordination activities.
As of September 30, 2018, the net debt/EBITDA ratio was 2.751,2 (December 31, 2017: 2.841,2). Excluding the proceeds from divestitures of Care Coordination activities the net debt/EBITDA ratio was 2.961,2. At year-end 2018, Fresenius now expects the FY/18 net debt/EBITDA1,2 ratio to be on a comparable level to year-end 2017.
1 At LTM average exchange rates for both net debt and EBITDA; pro forma closed acquisitions/divestitures, excluding Akorn and NxStage transactions
2 Before special items
Business Segments
Fresenius Medical Care
Fresenius Medical Care is the world's largest provider of products and services for individuals with renal diseases. As of September 30, 2018, Fresenius Medical Care was treating 329,085 patients in 3,872 dialysis clinics. Along with its core business, the company provides related medical services in the field of Care Coordination.

- 3% comparable1 sales growth in constant currency in Q3
- -2% adjusted4,6 net income decrease in constant currency in Q3
- Outlook for FY/18 adjusted
Sales decreased by 8% (-2% in constant currency) to €12,247 million (Q1-3/17: €13,355 million). Organic sales growth was 3%. Currency translation effects reduced sales by 7%. The adoption of IFRS 15 reduced sales by 3%. Q1-3/17 base additionally adjusted for divestitures of Care Coordination activities, sales decreased by 4% (increased by 3% in constant currency).
1 Adjusted for IFRS 15 implementation; base adjusted for divested Care Coordination activities
2 Excluding VA agreement Q3: 3%; Q1-3: 4%
3 Excluding gains from divestitures of Care Coordination activities, increase of FCPA provision, ballot initiatives, divested Care Coordination activities in Q3/2017; including Natural disaster costs and VA agreement
4 Net income attributable to shareholders of Fresenius Medical Care AG & Co. KGaA
5 Consistent with guidance, i.e. excluding gains from divestitures of Care Coordination activities, increase of FCPA provision, ballot initiatives, , divested Care Coordination activities; including Natural disaster costs, the effect of the U.S. Tax Reform and including VA agreement
6 Consistent with guidance, i.e. excluding gains from divestitures of Care Coordination activities, the effect of the U.S. Tax Reform, VA agreement, FCPA provision, ballot initiatives, divested Care Coordination activities, Natural disaster costs
In Q3/18, sales decreased by 6% (-6% in constant currency) to €4,058 million (Q3/17: €4,336 million). Organic sales growth was 3%. The adoption of IFRS 15 reduced sales by 3%. Q3/17 base additionally adjusted for divestitures of Care Coordination activities, sales in Q3/18 increased by 2% (increased by 3% in constant currency).
Health Care services sales (dialysis services and care coordination) decreased by 4%1 (increased by 3%1 in constant currency) to €9,852 million (Q1-3/17: €10,950 million). With €2,395 million (Q1-3/17: €2,405 million), Health Care product sales were on prior-year’s level (increased by 5% in constant currency).
In North America, sales decreased by 5%1 (increased by 1%1 in constant currency) to €8,589 million (Q1-3/17: €9,715 million). Health Care services sales decreased by 6%1 (increased by 1%1 in constant currency) to €7,978 million (Q1-3/17: €9,086 million). Excluding the 2017 effect from the VA Agreement (€96 million), Health Care services sales increased by 2%1 in constant currency. Health Care product sales decreased by 3% (increased by 4% in constant currency) to €610 million (Q1-3/17: €629 million).
Sales outside North America increased by 1% (7% in constant currency) to €3,648 million (Q1-3/17: €3,628 million).
Health Care services sales increased by 1% (9% in constant currency) to €1,873 million (Q1-3/17: €1,864 million). Health Care product sales increased by 1% (5% in constant currency) to €1,774 million (Q1-3/17: €1,764 million).
Fresenius Medical Care’s EBIT increased by 32% (39% in constant currency) to €2,425 million (Q1-3/17: €1,843 million), driven by the divestitures of Care Coordination activities. The EBIT margin increased to 19.8% (Q1-3/17: 13.8%). EBIT on a comparable basis decreased by 2% in constant currency and EBIT margin was 13.9% (Q1-3/17: 14.3%).
In Q3/18, EBIT decreased by 13% (-20% in constant currency) to €527 million (Q3/17: €609 million). The EBIT margin decreased to 13.0% (Q3/17: 14.0%). EBIT on a comparable basis increased by 5% (increased by 4% in constant currency) and EBIT margin increased to 15.1% (Q3/17: 14.8%).
1 Growth rate adjusted for IFRS 15 implementation and divested Care Coordination activities
Net income1 increased by 76% (86% in constant currency) to €1,557 million (Q1-3/17: €886 million). Adjusted net income1 growth was 4% in constant currency. Net income1 growth on a comparable basis was 16% in constant currency.
In Q3/18, net income1 decreased by 8% (-17% in constant currency) to €285 million (Q3/17: €309 million). Adjusted net income1 growth was -2% in constant currency. Net income1 growth on a comparable basis was 19% in constant currency.
Operating cash flow was €1,220 million (Q1-3/17: €1,664 million). The cash flow margin was 10.0% (Q1-3/17: 12.5%). The decrease is mainly due to two effects in North America: Receipt of a ~€200 million payment under the VA agreement in the prior-year period as well as increased accounts receivable related to the addition of calcimimetics into the Medicare ESRD payment bundle. In Q3/18, operating cash flow was €609 million (Q3/17: €612 million), mainly driven by higher tax payments and discretionary contributions to pension plan assets in the U.S., almost fully offset by decreases in accounts receivable. The cash flow margin was 15.0% (Q3/17: 14.1%).
Fresenius Medical Care revised its outlook for FY/18 as the business development in Q3/18 was below the company’s expectations. Fresenius Medical Care now expects sales growth of 2% to 3%2 in constant currency (previously: 5% to 7%2). On a comparable basis3, Fresenius Medical Care now expects FY/18 net income1 to increase by 11% to 12%3 in constant currency (previously: 13% to 15%3). On an adjusted basis4, Fresenius Medical Care now expects FY/18 net income1 to increase by 2% to 3%4 in constant currency (previously: 7% to 9%4).
For further information, please see Fresenius Medical Care’s Investor News at www.freseniusmedicalcare.com.
1 Net income attributable to shareholders of Fresenius Medical Care AG & Co. KGaA
2 2017 base: €16,739 million (adjusted for IFRS 15 adoption (-€486 million) and divestitures of Care Coordination activities (-€558 million))
3 2017 base: €1,242 million, excluding H2/17 net income of divestited Care Coordination activities (-€38 million); 2018 including benefits of the U.S. tax reform but excluding gains from divestitures of Care Coordination activities, contributions to the campaigns in the U.S. opposing state ballot initiatives at Fresenius Medical Care and FCPA provision
4 2017 base: €1,162 million, excluding H2/17 net income of divested Care Coordination activities (-€38 million), the effect of the U.S. tax reform, natural disaster costs, FCPA provision and effects of the agreement with the U.S. Departments of Veterans Affairs and Justice (VA agreement); 2018 excluding benefits of the U.S. tax reform, gains from divestitures of Care Coordination activities, contributions to the campaigns in the U.S. opposing state ballot initiatives and FCPA provision
Fresenius Kabi
Fresenius Kabi offers intravenously administered generic drugs, clinical nutrition and infusion therapies for seriously and chronically ill patients in the hospital and outpatient environments. The company is also a leading supplier of medical devices and transfusion technology products. In the biosimilars business, we are developing products with a focus on oncology and autoimmune diseases.

- 8% organic sales growth and 14% EBIT1 growth in constant currency (excl. biosimilars expenses) in Q3
- Sales outlook confirmed and strengthened: top end of 4% to 7% organic sales growth expected
- EBIT outlook raised: 1% to 3%5 EBIT growth in constant currency expected (~9% to 11%6 excl. biosimilars expenses)
Sales increased by 2% (increased by 7% in constant currency) to €4,857 million (Q1-3/17: €4,764 million). Organic sales growth was 7%. Strong negative currency translation effects (-5%) were mainly related to the devaluation of the U.S. dollar, the Brazilian real and the Argentinian peso against the euro. In Q3/18, sales increased by 6% (8% in constant currency) to €1,650 million (Q3/17: €1,562 million). Organic sales growth was 8%.
Sales in Europe grew by 1% (organic growth: 3%) to €1,658 million (Q1-3/17: €1,635 million). In Q3/18, sales were unchanged (organic growth: 1%) at €538 million.
1 Before special items
2 Before expenses for the further development of the biosimilars business: Q3/18: 14%; Q1-3/18: 11%
3 Net income attributable to shareholders of Fresenius SE & Co. KGaA
4 Before expenses for the further development of the biosimilars business: Q3/18: 31%; Q1-3/18: 22%
5 FY/17 base: €1,177 million; before special items, including expenditures for the further development of the biosimilars business (€60 million in FY/17 and ~€160 million in FY/18)
6 FY/17 base: €1,237 million; before special items, excluding expenditures for the further development of the biosimilars business (€60 million in FY/17 and ~€160 million in FY/18)
For a detailed overview of special items please see the reconciliation tables on page 19 - 20 in the PDF document.
Sales in North America increased by 1% (organic growth: 8%) to €1,760 million (Q1-3/17: €1,736 million). In Q3/18, sales increased by 13% (organic growth: 12%) to €620 million (Q3/17: €549 million).
Sales in Asia-Pacific increased by 8% (organic growth: 12%) to €964 million (Q1-3/17: €894 million). In Q3/18, sales increased by 8% (organic growth: 9%) to €337 million (Q3/17: €312 million). Sales in Latin America/Africa decreased by 5% (organic growth: 11%) to €475 million (Q1-3/17: €499 million). In Q3/18, sales decreased by 5% (organic growth increased by 13%) to €155 million (Q3/17: €163 million).
EBIT1 decreased by 6% (increased by 1% in constant currency) to €854 million (Q1-3/17: €905 million) with an EBIT margin1 of 17.6% (Q1-3/17: 19.0%). In Q3/18, EBIT1 increased by 5% (5% in constant currency) to €297 million (Q3/17: €283 million) with an EBIT margin1 of 18.0% (Q3/17: 18.1%).
EBIT1 before expenses for the further development of the biosimilars business increased by 5% (11% in constant currency) to €967 million (Q1-3/17: €919 million) with an EBIT margin1 of 19.9% (Q1-3/17: 19.3%). In Q3/18, EBIT1 before expenses for the further development of the biosimilars business increased by 14% (14% in constant currency) to €338 million (Q3/17: €297 million) with an EBIT margin1 of 20.5% (Q3/17: 19.0%).
Net income1,2 increased by 2% (9% in constant currency) to €554 million (Q1-3/17: €544 million). In Q3/18, net income1,2 increased by 21% (21% in constant currency) to €199 million (Q3/17: €165 million).
Operating cash flow increased by 28% to €820 million (Q1-3/17: €640 million). The cash flow margin grew to 16.9% (Q1-3/17: 13.4%). In Q3/18, operating cash flow increased by 49% to €366 million (Q3/17: €245 million) with a cash flow margin of 22.2% (Q3/2017: 15.7%) mainly driven by a strong operational performance and working capital improvements.
1 Before special items
2 Net income attributable to shareholders of Fresenius SE & Co. KGaA
For a detailed overview of special items please see the reconciliation tables on page 19 - 20 of the PDF document.
Based on the strong development in Q3/18 Fresenius Kabi confirms and strengthens its organic sales growth guidance of 4% to 7% and now expects to reach the top end of this range.
Fresenius Kabi has increased its FY/18 EBIT outlook and now expects 1% to 3%1 growth in constant currency (previously: -2% to +1%1). The increase is driven by a strong development across all product lines and regions with North America standing out. FY/18 EBIT excluding expenditures for the further development of the biosimilars business is now expected to grow by ~9% to 11%2 in constant currency (previously: ~6% to 9%2).
1 2017 base: €1,177 million; before special items, including expenditures for the further development of the biosimilars business (€60 million in FY/17 and ~€160 million in FY/18)
2 2017 base: €1,237 million; before special items, excluding expenditures for the further development of the biosimilars business (€60 million in FY/17 and ~€160 million in FY/18)
For a detailed overview of special items please see the reconciliation tables on page 19 - 20 of the PDF document.
Fresenius Helios
Fresenius Helios is Europe's leading private hospital operator. The company comprises Helios Germany and Helios Spain (Quirónsalud). Helios Germany operates 87 hospitals, 89 outpatient centers and treats approximately 5.2 million patients annually. Quirónsalud operates 46 hospitals, 56 outpatient centers and around 300 occupational risk prevention centers, and treats approximately 11.6 million patients annually.

- 2% organic sales growth in Q3
- Preparatory initiatives for expected regulatory requirements and decline in admissions impact financial performance of Helios Germany
- Helios Spain with steady yet dynamic growth
- 2018 sales outlook confirmed and narrowed, EBIT outlook adjusted: 0% to 2% (previously: 5% to 8%)
As of July 1, 2018 Fresenius Helios transferred its German post-acute care business to Fresenius Vamed and adjusted its outlook accordingly. For a like-for-like comparison, we also provide sales and EBIT growth rates adjusted for the effects of this transaction.
Fresenius Helios increased sales by 5% (7%1) to €6,762 million (Q1-3/17: €6,422 million). Organic sales growth was 3%. In Q3/18, sales decreased by 4% (increased by 2%1; organic growth: 2%) to €2,088 million (Q3/17: €2,166 million).
Sales of Helios Germany decreased by 1% (grew 2%1; organic growth: 2%) to €4,531 million (Q1-3/17: €4,562 million). In Q3/18, sales decreased by 7% (0%1; organic growth: 0%) to €1,410 million (Q3/17: €1,524 million). Sales are impacted by a decline in admissions, inter alia due to a trend towards outpatient treatments. To counter this trend, Helios Germany is expanding outpatient services offerings in a separate division. Helios Spain increased sales by 20% (organic growth: 5%) to €2,231 million (Q1-3/17: €1,860 million), mainly due to the additional month of consolidation compared to the prior-year period (Quirónsalud is consolidated since February 1, 2017). In Q3/18 Helios Spain increased sales by 6% (organic growth: 5%) to €678 million (Q3/17: €642 million).
1 Adjusted for German post-acute care business transferred to Fresenius Vamed
2 Net income attributable to shareholders of Fresenius SE & Co. KGaA
Fresenius Helios grew EBIT by 1% (3%1) to €775 million (Q1-3/17: €769 million) with a margin of 11.5% (Q1-3/17: 12.0%). In Q3/18, EBIT decreased by 12% (-6%1) to €204 million (Q3/17: €232 million) with a margin of 9.8% (Q3/17: 10.7%).
EBIT of Helios Germany decreased by 11% (-8%1) to €488 million (Q1-3/17: €549 million) with a margin of 10.8% (Q1-3/17: 12.0%). In Q3/18, EBIT decreased by 25% (-17%1) to €143 million (Q3/17: €190 million) with a margin of 10.1% (Q3/17: 12.5%). Given a significant fixed cost base, top line performance impacs EBIT over-proportionately. Additionally, EBIT development of Helios Germany is negatively affected by catalogue effects, preparatory initiatives for expected regulatory requirements (i.e. clustering) as well as a lack of privatization opportunities in the German market.
EBIT of Helios Spain increased by 30% to €286 million (Q1-3/17: €220 million), mainly due to the strong operating performance and the additional month of consolidation compared to the prior-year period, with a margin of 12.8% (Q1-3/17: 11.8%). In Q3/18, from a moderate base, EBIT increased by 40% to €59 million (Q3/17: €42 million) with a margin of 8.7% (Q3/17: 6.5%).
Net income2 of Fresenius Helios decreased by 2% to €516 million (Q1-3/17: €526 million). In Q3/18, net income2 decreased by 16% to €128 million (Q3/17: €153 million).
Operating cash flow was €387 million (Q1-3/17: €560 million) with a margin of 5.7% (Q1-3/17: 8.7%).
Fresenius Helios confirmed and narrowed its FY/18 organic sales growth outlook, and now projects growth at the low end of the original 3% to 6% range. Based on the Q3/18 business development in Germany, Fresenius Helios adjusts its FY/18 EBIT outlook and now expects 0% to 2% growth (previously: 5% to 8%).
1 Adjusted for German post-acute care business transferred to Fresenius Vamed
2 Net income attributable to shareholders of Fresenius SE & Co. KGaA
Fresenius Vamed
Fresenius Vamed manages projects and provides services for hospitals and other health care facilities worldwide and is a post-acute care provider in Central Europe. The portfolio ranges along the entire value chain: from project development, planning, and turnkey construction, via maintenance and technical management, to total operational management.

- Excellent organic sales growth of 30% in Q3/18
- Both service and project businesses contributed to strong growth in Q3/18
- FY/18 outlook confirmed
As of July 1, 2018 Fresenius Helios transferred the post-acute care business to Fresenius Vamed. Fresenius Vamed adjusted its outlook accordingly. For a like-for-like comparison, we also provide sales and EBIT growth rates adjusted for the effects of this transaction.
Sales increased by 32% (17%1; 33% in constant currency) to €991 million (Q1-3/17: €748 million). Organic sales growth was 14% with a strong momentum in both the project and service businesses as well as increased sales from services for Fresenius Helios. Sales of the project business increased by 17% to €352 million (Q1-3/17: €301 million). Sales in the service business grew by 43% (17%1) to €639 million (Q1-3/17: €447 million). In Q3/18, sales increased by 110% (32%1; organic growth: 24%) to €315 million (Q3/17: €150 million).
EBIT increased by 53% (6%1) to €49 million (Q1-3/17: €32 million) with a margin of 4.9% (Q1-3/17: 4.3%). In Q3/18, EBIT increased by 107% (7%1) to €31 million (Q3/17: €15 million) with a margin of 6.5% (Q3/17: 5.6%).
Net income2 increased by 57% to €33 million (Q1-3/17: €21 million). In Q3/18, net income2 increased by 120% to €22 million (Q1-3/17: €10 million).
Order intake decreased by 19% to €567 million (Q1-3/17: €697 million). As of September 30, 2018, order backlog was €2,315 million (December 31, 2017: €2,147 million).
Fresenius Vamed has confirmed its outlook for 2018 and expects organic sales growth in the range of 5% to 10% and EBIT growth of 32% to 37%.
1 Without German post-acute care business transferred from Fresenius Helios
2 Net income attributable to shareholders of VAMED AG
Conference Call
As part of the publication of the results for the third quarter / first nine months of 2018, a conference call will be held on October 30, 2018 at 2 p.m. CET (9 a.m. EDT). All investors are cordially invited to follow the conference call in a live broadcast over the Internet at www.fresenius.com/investors. Following the call, a replay will be available on our website.
For additional information on the performance indicators used please refer to our website www.fresenius.com/alternative-performance-measures.
This release contains forward-looking statements that are subject to various risks and uncertainties. Future results could differ materially from those described in these forward-looking statements due to certain factors, e.g. changes in business, economic and competitive conditions, regulatory reforms, results of clinical trials, foreign exchange rate fluctuations, uncertainties in litigation or investigative proceedings, and the availability of financing. Fresenius does not undertake any responsibility to update the forward-looking statements in this release.
Fresenius confirms and narrows its Group guidance1 for FY/18. Group sales are expected to increase at the low end of the original 5% to 8%2 guidance range (in constant currency). Fresenius expects net income3,4 growth at the low end of the original 6% to 9% guidance range (in constant currency). Excluding expenditures for the further development of the biosimilars business, net income3,5 growth is projected at the low end of the original ~10% to 13% guidance range (in constant currency). Narrowing the Group guidance ranges is due to updated expectations at Fresenius Medical Care, Fresenius Kabi and Fresenius Helios.
Fresenius Medical Care adjusts its outlook for FY/18 as the business development in Q3/18 was below the company’s expectations. Fresenius Medical Care now expects sales growth of 2% to 3%6 in constant currency (previously: 5% to 7%6). Whilst Fresenius Kabi confirms its guidance of 4% to 7% organic sales growth, it now expects to reach the top end of this range. Fresenius Kabi sees a strong development across all product lines and regions with North America standing out. Fresenius Helios confirms and narrows its FY/18 organic sales growth outlook, and now projects growth at the low end of the original 3% to 6% range. The business development in Germany in Q3/18 was below the company’s expectations mainly due to a decline in admissions and additional catalogue effects. In line with market development in Germany, Fresenius Helios sees a trend towards outpatient treatments leading to fewer admissions in its hospitals.
On a comparable basis8, Fresenius Medical Care now expects FY/18 net income7 to increase by 11% to 12%8 in constant currency (previously: 13% to 15%8). On an adjusted basis9, Fresenius Medical Care now expects FY/18 net income7 to increase by 2% to 3%9 in constant currency (previously: 7% to 9%9). Fresenius Kabi increases its FY/18 EBIT outlook and now expects 1% to 3%10 growth in constant currency (previously: -2% to +1%10). The increase is driven by a strong development across all product lines and regions with North America standing out. FY/18 EBIT excluding expenditures for the further development of the biosimilars business is now expected to grow by ~9% to 11%11 in constant currency (previously: ~6% to 9%11). Fresenius Helios adjusts its FY/18 EBIT outlook and now expects 0% to 2% growth (previously: 5% to 8%), driven by lower sales growth in Germany. Moreover, preparatory structural activities for anticipated regulatory requirements (e.g. clustering), as well as a lack of privatization opportunities in the German market continue to weigh on earnings growth.
Fresenius Vamed confirms its outlook for FY/18 and expects organic sales growth in the range of 5% to 10% and FY/18 EBIT growth of 32% to 37%. The integration of the inpatient post-acute care business acquired from Helios Germany is fully on track.
Q3/2018 preliminary financial results
In Q3/18, Fresenius Group sales increased by ~3%12 (~4%12 in constant currency) to ~€8.2 billion (Q3/2017: €8.297 billion). Group net income3 before special items13 increased by ~8% (~8% in constant currency) to ~€445 million (Q3/2017: €413 million). Fresenius Medical Care has increased the provision for the FCPA (Foreign Corrupt Practices Act) related charge by €75 million (not tax deductible). As in 2017, this charge is treated as a special item. Group net income3 before special items13 and before expenses for the further development of the biosimilars business increased by ~13% (~13% in constant currency) to ~€474 million (Q3/2017: €423 million).
Fresenius will publish its detailed Q3/18 and Q1-Q3/18 financial results on October 30, 2018.
----------------------------------------
1Excluding effects related to the Akorn and NxStage transactions, gains from divestitures of Care Coordination activities and FCPA provision
22017 base adjusted for IFRS 15 adoption (deduction of €486 million at Fresenius Medical Care) and divestitures of Care Coordination activities (deduction of €558 million at Fresenius Medical Care)
3Net income attributable to shareholders of Fresenius SE & Co. KGaA
42017 base: €1,804 million; 2018 before special items (i.e. expenses related to the Akorn and NxStage transactions, gains from divestitures of Care Coordination activities and FCPA provision; including contributions to the campaigns in the U.S. opposing state ballot initiatives at Fresenius Medical Care and including expenditures for further development of the biosimilars business at Fresenius Kabi (€43 million after tax in FY/17 and ~€120 million after tax in FY/18))
52017 base: €1,847 million; 2018 before special items (i.e. expenses related to the Akorn and NxStage transactions, gains from divestitures of Care Coordination activities and FCPA provision; including contributions to the campaigns in the U.S. opposing state ballot initiatives at Fresenius Medical Care excluding the expenditures for further development of the biosimilars business at Fresenius Kabi (€43 million after tax in FY/17 and ~€120 million after tax in FY/18))
62017 base: €16,739 million (adjusted for IFRS 15 adoption (-€486 million) and divestitures of Care Coordination activities (-€558 million))
7Net income attributable to shareholders of Fresenius Medical Care AG & Co. KGaA
82017 base: €1,242 million, excluding H2/17 net income of divestitures of Care Coordination activities (-€38 million); 2018 including benefits of the U.S. tax reform but excluding gains from divestitures of Care Coordination activities, contributions to the campaigns in the U.S. opposing state ballot initiatives at Fresenius Medical Care and FCPA provision
92017 base: €1,162 million, excluding divestitures of Care Coordination activities (-€38 million), the effect of the U.S. tax reform, natural disaster costs, FCPA provision and effects of the agreement with the U.S. Departments of Veterans Affairs and Justice (VA agreement)
102017 base: €1,177 million; 2017 & 2018 before special items, including expenditures for the further development of the biosimilars business (€60 million in FY/17 and ~€160 million in FY/18)
112017 base: €1,237 million; 2017 & 2018 before special items, excluding expenditures for the further development of the biosimilars business (€60 million in FY/17 and ~€160 million in FY/18)
12Growth rates adjusted for IFRS 15 adoption and divestitures of Care Coordination activities (Q3/17 base: €7,927 million)
13Before expenses related to the Akorn transaction, gains from divestitures of Care Coordination activities and FCPA provision, but including contributions to the campaigns in the U.S. opposing state ballot initiatives at Fresenius Medical Care
This release contains forward-looking statements that are subject to various risks and uncertainties. Future results could differ materially from those described in these forward-looking statements due to certain factors, e.g. changes in business, economic and competitive conditions, regulatory reforms, results of clinical trials, foreign exchange rate fluctuations, uncertainties in litigation or investigative proceedings, and the availability of financing. Fresenius does not undertake any responsibility to update the forward-looking statements in this release.
If no timeframe is specified, information refers to H1/2018
Q2/2018:
- Sales: €8.4 billion (-2%, +5% in constant currency2 )
- EBIT2: €1,145 million (-3%, +2% in constant currency)
- EBIT2 (excl. biosimilars business): €1,182 million (0%, +5% in constant currency)
- Net income2,3: €472 million (+3%, +7% in constant currency)
- Net income2,3 (excl. biosimilars business): €499 million (+9%, +12% in constant currency)
H1/2018:
- Sales: €16.5 billion (-2%, +6% in constant currency1)
- EBIT2: €2,199 million (-8%, -2% in constant currency)
- EBIT2: (excl. biosimilars business) €2,271 million (-5%, +1% in constant currency)
- Net income2,3: €922 million (+1%, +7% in constant currency)
- Net income2,3 (excl. biosimilars business): €975 million (+6%, +12% in constant currency)
1 Growth rate adjusted for IFRS 15 adoption (Q2/17 base: €8,401 million; H1/2017 base: €16,624 million)2 Before special items (i.e., expenses related to the Akorn transaction, gains related to divestitures of Care Coordination activities) 3 Net income attributable to shareholders of Fresenius SE & Co. KGaA
For a detailed overview of special items please see the reconciliation tables on pages 18-19 in the PDF document.
Group guidance1 for 2018 confirmed
Fresenius confirms its guidance for 2018. Group sales are expected to increase by 5% to 8%2 in constant currency. Net income3,4 is expected to grow by 6% to 9% in constant currency. Excluding expenditures for the further development of the biosimilars business, net income3,5 is expected to grow by ~10% to 13% in constant currency.
Fresenius expects to further reduce its net debt/EBITDA ratio6 by year-end 2018.
6% sales growth in constant currency7
Group sales decreased by 1%7 (increased by 6%7 in constant currency) to €16,503 million (H1/2017: €16,894 million). Organic sales growth was 4%. Acquisitions/divestitures contributed net 2% to growth. Negative currency translation effects (7%) were mainly driven by the devaluation of the U.S. dollar and the Chinese yuan against the euro. In Q2/2018, Group sales were nearly unchanged7 (increased 5%7 in constant currency) at €8,382 million (Q2/2017: €8,532 million). Organic sales growth was 4%. Acquisitions/divestitures contributed net 1% to growth.
1 Excluding expenses related to the Akorn and NxStage transactions and gains from divestitures of Care Coordination activities2 2017 base adjusted for IFRS 15 adoption (deduction of €486 million at Fresenius Medical Care) and divestitures of Care Coordination activities (deduction of €558 million at Fresenius Medical Care)3 Net income attributable to shareholders of Fresenius SE & Co. KGaA4 2017 base: €1,804 million; 2018 before special items; including expenditures for further development of biosimilars business (€43 million after tax in FY/17 and ~€120 million after tax in FY/18) 5 2017 base: €1,847 million; 2018 before special items 6 Calculated at expected annual average exchange rates for both net debt and EBITDA; excluding effects of the Akorn and NxStage transactions and gains from divestitures of Care Coordination activities; excluding further potential acquisitions; at current IFRS rules 7 Growth rates adjusted for IFRS 15 adoption (H1/17 base: €16,624 million; Q2/17 base: €8,401 million)

7% net income1,2 growth in constant currency
Group EBITDA2 decreased by 6% (0% in constant currency) to €2,912 million (H1/2017: €3,098 million). Group EBIT2 decreased by 8% (-2% in constant currency) to €2,199 million (H1/2017: €2,393 million). The prior-year period saw the compensation for treatments of U.S. war veterans (“VA agreement”) contributing €91 million as a one-time effect. Excluding the VA agreement, EBIT2 increased by 2% in constant currency in H1/2018. The EBIT margin2 was 13.3% (13.1% before IFRS 15; H1/17: 14.2%). Group EBIT2 before expenses for the further development of the biosimilars business decreased by 5% (increased 1% in constant currency) to €2,271 million. Group EBIT2 excluding the VA agreement and expenses for the biosimilars business increased by 5% in constant currency.
In Q2/2018, Group EBIT2 decreased by 3% (increased 2% in constant currency) to €1,145 million (Q2/2017: €1,177 million), with an EBIT margin2 of 13.7% (13.4% before IFRS 15; Q2/2017: 13.8%). Group EBIT2 excluding expenses for the biosimilars business increased by 5% in constant currency.
1 Net income attributable to shareholders of Fresenius SE & Co. KGaA 2 Before special itemsFor a detailed overview of special items please see the reconciliation tables on pages 18-19 in the PDF document.
Group net interest2 was -€297 million (H1/2017: -€326 million). The decrease is mainly driven by currency effects and reduced interest following refinancing activities.
The decrease of the Group tax rate before special items to 22.3% (H1/2017: 28.5%) was mainly due to the U.S. tax reform. In Q2/2018, the Group tax rate2 was 23.4% (Q2/2017: 27.9%).
Noncontrolling interest2 was €556 million (H1/2017: €562 million), of which 95% was attributable to the noncontrolling interest in Fresenius Medical Care.
Group net income1,2 increased by 1% (7% in constant currency) to €922 million (H1/2017: €916 million). Earnings per share1,2 increased by 1% (7% in constant currency) to €1.66 (H1/2017: €1.65). In Q2/2018, Group net income1,2 increased by 3% (7% in constant currency) to €472 million (Q2/2017: €459 million). Earnings per share1,2 increased by 3% (7% in constant currency) to €0.85 (Q2/2017: €0.82).
Group net income1,2 before expenses for the further development of the biosimilars business increased by 6% (12% in constant currency) to €975 million (H1/2017: €916 million). Earnings per share1,2 before expenses for the further development of the biosimilars business increased by 6% (12% in constant currency) to €1.76 (H1/2017: €1.65). In Q2/2018, Group net income1,2 before expenses for the further development of the biosimilars business increased by 9% (12% in constant currency) to €499 million (Q2/2017: €459 million). Earnings per share1,2 before expenses for the further development of the biosimilars business increased by 9% (12% in constant currency) to €0.90 (Q2/2017: €0.82).
Group net income1 after special items increased by 20% (29% in constant currency) to €1,092 million (H1/2017: €907 million), mainly due to gains related to divestitures in Care Cordination activities at Fresenius Medical Care. Earnings per share1 after special items increased by 20% (29% in constant currency) to €1.97 (H1/2017: €1.64). In Q2/2018, Group net income1 after special items increased by 45% (54% in constant currency) to €652 million (Q2/2017: €450 million). Earnings per share1 after special items increased by 45% (54% in constant currency) to €1.18 (Q2/2017: €0.81).
1 Net income attributable to shareholders of Fresenius SE & Co. KGaA2 Before special itemsFor a detailed overview of special items please see the reconciliation tables on pages 18-19 in the PDF document.
Continued investment in growth
Spending on property, plant and equipment was €831 million (H1/2017: €709 million), primarily for the modernization and expansion of dialysis clinics, production facilities as well as hospitals and day clinics. This corresponds to 5.0% of sales.
Total acquisition spending was €386 million (H1/2017: €6,421 million). The prior-year period included the acquisition of Quirónsalud.
Cash flow development
Operating cash flow decreased by 25% to €1,256 million (H1/2017: €1,683 million) with a margin of 7.6% (H1/2017: 10.0%). The decrease is mainly due to two effects at Fresenius Medical Care in North America: Receipt of a ~€200 million payment under the VA agreement in the prior-year period as well as increased accounts receivable related to the addition of calcimimetics into the Medicare ESRD payment bundle. Moreover negative currency translation effects weighed on the cash flow development in H1/2018. Operating cash flow in Q2/2018 decreased by 15% to €1,020 million (Q2/2017: €1,207 million), with a margin of 12.2% (Q2/2017: 14.1%). Negative currency translation effects weighed on the cash flow development in Q2/2018.
Given the effects described above and growing investments, free cash flow before acquisitions and dividends decreased to €425 million (H1/2017: €998 million). Free cash flow after acquisitions and dividends was €942 million (H1/2017: -€5,645 million).
Solid balance sheet structure
The Group’s total assets increased by 3% (3% in constant currency) to €54,982 million (Dec. 31, 2017: €53,133 million). Current assets grew by 13% (13% in constant currency) to €14,287 million (Dec. 31, 2017: €12,604 million). Non-current assets were nearly unchanged (decreased by 1% in constant currency) at €40,695 million (Dec. 31, 2017: €40,529 million).
Total shareholders’ equity increased by 7% (6% in constant currency) to €23,269 million (Dec. 31, 2017: €21,720 million). The equity ratio increased to 42.3% (Dec. 31, 2017: 40.9%).
Group debt was nearly unchanged (decreased by 1% in constant currency) at €18,989 million (Dec. 31, 2017: €19,042 million). Group net debt decreased by 4% (-5% in constant currency) to €?16,722 million (Dec. 31, 2017: €?17,406 million) mainly due to the proceeds from divestitures of Care Coordination activities.
As of June 30, 2018, the net debt/EBITDA ratio was 2.801,2 (December 31, 2017: 2.841,2). Excluding the proceeds from divestitures of Care Coordination activities the net debt/EBITDA ratio was 3.021,2.
1 At LTM average exchange rates for both net debt and EBITDA; pro forma closed acquisitions/divestitures, excluding Akorn and NxStage transactions2 Before special itemsFor a detailed overview of special items please see the reconciliation tables on pages 18-19 in the PDF document.
Business Segments
Fresenius Medical Care
Fresenius Medical Care is the world's largest provider of products and services for individuals with renal diseases. As of June 30, 2018, Fresenius Medical Care was treating 325,188 patients in 3,815 dialysis clinics. Along with its core business, the company provides related medical services in the field of Care Coordination.

- Q2/2018 reported results significantly positively influenced by divestitures of Care Coordination activities
- 5% adjusted1,2 sales growth in constant currency in Q2
- 6% adjusted4,6 net income growth in constant currency in Q2
- 22% net income growth in constant currency on a comparable basis4,7 in Q2
Reported sales were strongly impacted by headwinds from foreign exchange rates and by the already anticipated decline in Fresenius Medical Care North America’s pharmacy business. Sales decreased by 9% (increased by 3%1 in constant currency) to €8,189 million (H1/2017: €9,019 million). Organic sales growth was 3%. Currency translation effects reduced sales by 9%. Adoption of IFRS 15 reduced sales by 3%. Excluding the VA agreement in the prior-year quarter, sales growth1 was 4% in constant currency.
1 Growth rate adjusted for IFRS 15 implementation (Q2/17 base: €4,340 million; H1/17 base: €8,749 million) 2 Excluding VA agreement: Q2/2018: 5%; H1/2018: 4%3 Adjusted for gains from divestitures of Care Coordination activities: Q2/2018: 4%; H1/2018: -5% 4 Net income attributable to shareholders of Fresenius Medical Care AG & Co. KGaA 5 Adjusted for gains from divestitures of Care Coordination activities and the effect of the U.S. Tax Reform: Q2/2018: 8%; H1/2018: -3% 6 Consistent with guidance, i.e. excluding gains from divestitures of Care Coordination activities, excluding the effect of the U.S. Tax Reform and excluding VA agreement 7 Consistent with guidance, i.e. excluding gains from divestitures of Care Coordination activities, including the effect of the U.S. Tax Reform and including VA agreement
In Q2/2018, sales decreased by 6% (increased 5%1 in constant currency) to €4,214 million (Q2/2017: €4,471 million). Organic sales growth was 4%. Currency translation effects reduced sales by 8%. Adoption of IFRS 15 reduced sales by 3%.
Health Care services sales (dialysis services and care coordination) decreased by 8%1 (increased by 3%1 in constant currency) to €6,594 million (H1/2017: €7,418 million). With €1,595 million (H1/2017: €1,601 million), Health Care product sales were on prior-year’s level (increased by 6% in constant currency).
In North America, sales decreased by 9%1 (increased by 1%1 in constant currency) to €5,746 million (H1/2017: €6,600 million). Health Care services sales decreased by 9%1 (increased by 1%1 in constant currency) to €5,351 million (H1/2017: €6,182 million). Excluding the 2017 effect from the VA Agreement (€98 million), Health Care services sales increased by 3%1 in constant currency. Health Care product sales decreased by 5% (increased by 6% in constant currency) to €395 million (H1/2017: €418 million).
Sales outside North America increased by 1% (8% in constant currency) to €2,436 million (H1/2017: €2,410 million). Health Care services sales increased by 1% (10% in constant currency) to €1,243 million (H1/2017: €1,236 million). Health Care product sales increased by 2% (7% in constant currency) to €1,193 million (H1/2017: €1,174 million).
Fresenius Medical Care’s EBIT increased by 54% (68% in constant currency) to €1,898 million (H1/2017: €1,235 million), driven by the divestitures of Care Coordination activities in Q2/18. The EBIT margin increased to 23.2% (H1/2017: 13.7%). Adjusted for the implementation of IFRS 15 and excluding the gains from divestitures of Care Coordination activities and the VA agreement in the prior-year period, EBIT increased by 3% in constant currency and EBIT margin was 13.2% (H1/2017: 13.2%). In Q2/2018, EBIT increased by 140% (increased by 162% in constant currency) to €1,401 million (Q2/2017: €583 million). The EBIT margin increased to 33.3% (Q2/2017: 13.0%). Adjusted for the adoption of IFRS 15 and excluding the gains from divestitures of Care Coordination activities, EBIT increased by 4% in constant currency and EBIT margin increased to 13.5%.
1 Growth rate adjusted for IFRS 15 implementation (Q2/17: -€131 million; H1/17: -€270 million)
Net income1 increased by 121% (141% in constant currency) to €1,273 million (H1/2017: €577 million). Consistent with full-year guidance, i.e. excluding the gains from divestitures of Care Coordination activities, the effect of the U.S. Tax Reform and the VA agreement in the prior-year period, net income growth1 was 7% in constant currency. Net income1 growth on a comparable basis, i.e. excluding the gains from divestitures of Care Coordination activities, but including the effect of the U.S. Tax Reform and the VA agreement in the prior-year period, was 13% in constant currency.
In Q2/2018, net income1 grew by 270% (303% in constant currency) to €994 million (Q2/2017: €269 million). Consistent with full-year guidance, i.e. excluding the gains from divestitures of Care Coordination activities, the effect of the U.S. Tax Reform and the VA agreement in the prior-year period, net income growth1 was 6% in constant currency. Net income1 growth on comparable basis, i.e. excluding the gains from divestitures of Care Coordination activities, but including the effect of the U.S. Tax Reform and the VA agreement in the prior-year period was 22% in constant currency.
Operating cash flow was €611 million (H1/2017: €1,052 million). The cash flow margin was 7.5% (H1/2017: 11.7%). The decrease is mainly due to two effects in North America: Receipt of a ~€200 million payment under the VA agreement in the prior-year period as well as increased accounts receivable related to the addition of calcimimetics into the Medicare ESRD payment bundle. In Q2/2018, operating cash flow was €656 million (Q2/2017: €882 million) with a cash flow margin of 15.6% (Q2/2017: 19.7%).
Fresenius Medical Care confirms its outlook for 2018 and expects sales growth of 5 to 7%2 in constant currency and net income1 comparable growth of 13% to 15%3 in constant currency (7% to 9%4 adjusted net income growth).
The 2018 growth targets are based on 2017 figures and exclude effects from the planned acquisition of NxStage Medical and gains from divestitures of Care Coordination activities.
For further information, please see Fresenius Medical Care’s Press Release at www.freseniusmedicalcare.com.
1 Net income attributable to shareholders of Fresenius Medical Care AG & Co. KGaA
2 2017 base: €16,739 million (adjusted for IFRS 15 adoption (-€486 million) and excluding Sound´s revenue for H2/2017 (-€558 million))
3 2017 base: €1,242 million, excluding Sound´s H2/17 net income (-€38 million); 2018 including benefits from U.S. tax reform but excluding gains from divestitures of Care Coordination activities
4 Excluding gains from divestitures of Care Coordination activities, excluding the effect of the U.S. Tax Reform natural disaster, FCPA related charge and excluding VA agreement
Fresenius Kabi
Fresenius Kabi offers intravenously administered generic drugs, clinical nutrition and infusion therapies for seriously and chronically ill patients in the hospital and outpatient environments. The company is also a leading supplier of medical devices and transfusion technology products. In the biosimilars business, we are developing products with a focus on oncology and autoimmune diseases.

- 6% organic sales growth and 11% EBIT1 growth in constant currency (excluding biosimilars business) in Q2
- European Commission confirms marketing authorizations of HES subject to the implementation of risk minimization measures
- Sales outlook confirmed: 4% to 7% organic sales growth expected
- EBIT outlook raised: -2% to +1%5 EBIT growth in constant currency expected (~6% to 9%6 excl. biosimilars expenses)
Sales of €3,207 million (H1/2017: €3,202 million) were on prior-year level (increased by 7% in constant currency). Organic sales growth was 7%. Strong negative currency translation effects (-7%) were mainly related to the devaluation of the U.S. dollar, the Brazilian real and the Chinese yuan against the euro. In Q2/2018, sales of €1,604 million were nearly unchanged (increased by 6% in constant currency) from the prior-year level (Q2/2017: €1,598 million). Organic sales growth was 6%.
Sales in Europe grew by 2% (organic growth: 3%) to €1,120 million (H1/2017: €1,097 million). In Q2/2018, sales increased by 2% (organic growth: 3%) to €563 million (Q2/2017: €553 million).
Sales in North America decreased by 4% (organic growth: 7%) to €1,140 million (H1/2017: €1,187 million). In Q2/2018, sales decreased by 3% (organic growth: 4%) to €549 million (Q2/2017: €568 million).
1 Before special items 2 Before expenses for the further development of the biosimilars business: Q2/2018: 11%; H1/2018: 10% 3 Net income attributable to shareholders of Fresenius SE & Co. KGaA 4 Before expenses for the further development of the biosimilars business: Q2/2018: 19%; H1/2018: 17%5 2017 base: €1,177 million; 2017 & 2018 before special items, including expenditures for the further development of the biosimilars business (€60 million in FY/17, and expected expenditures of ~€160 million in FY/18)6 2017 base: €1,237 million; 2017 & 2018 before special items
For a detailed overview of special items please see the reconciliation tables on pages 18-19 in the PDF document.
Sales in Asia-Pacific increased by 8% (organic growth: 13%) to €627 million (H1/2017: €582 million). In Q2/2018, sales increased by 8% (organic growth: 11%) to €326 million (Q2/2017: €302 million). Sales in Latin America/Africa decreased by 5% (organic growth: 10%) to €320 million (H1/2017: €336 million). In Q2/2018, sales decreased by 5% (organic growth: 10%) to €166 million (Q2/2017: €175 million).
EBIT1 decreased by 10% (-1% in constant currency) to €557 million (H1/2017: €622 million) with an EBIT margin1 of 17.4% (H1/2017: 19.4%). In Q2/2018, EBIT1 decreased by 6% (-1% in constant currency) to €289 million (Q2/2017: €309 million) with an EBIT margin1 of 18.0% (Q2/2017: 19.3%).
EBIT1 before expenses for the further development of the biosimilars business increased by 1% (10% in constant currency) to €629 million (H1/2017: €622 million) with an EBIT margin1 of 19.6% (H1/2017: 19.4%). In Q2/2018, EBIT1 before expenses for the further development of the biosimilars business increased by 6% (11% in constant currency) to €326 million (Q2/2017: €309 million) with an EBIT margin1 of 20.3% (Q2/2017: 19.3%).
Net income1,2 decreased by 6% (increased by 4% in constant currency) to €355 million (H1/2017: €379 million). In Q2/2018, net income1,2 decreased by 2% (increased by 5% in constant currency) to €185 million (Q2/2017: €188 million).
Operating cash flow increased by 15% to €454 million (H1/2017: €395 million). The cash flow margin grew to 14.2% (H1/2017: 12.3%). In Q2/2018, operating cash flow increased by 12% to €228 million (Q2/2017: €203 million) with a cash flow margin of 14.2% (Q2/2017: 12.7%).
1 Before special items 2 Net income attributable to shareholders of Fresenius SE & Co. KGaA
For a detailed overview of special items please see the reconciliation tables on pages 18-19 in the PDF document.
Based on the strong development of Fresenius Kabi in H1/2018 and the reversal of some HES1 associated risk adjustments, Fresenius Kabi raises its EBIT outlook for 2018 by 4%-points and now expects EBIT growth in constant currency of -2% to +1%2 (previously: -6% to -3%2 in constant currency). Excluding expenditures for the further development of the biosimilars business, EBIT is now expected to grow by ~6% to 9%3 in constant currency (previously: ~2% to 5%3 in constant currency). Fresenius Kabi confirms its sales guidance of 4% to 7% organic growth.
1 Hydroxyethyl starch (HES) 2 2017 base: €1,177 million; 2017 & 2018 before special items, including expenditures for the further development of the biosimilars business (€60 million in FY/17 and expected expenditures of ~€160 million in FY/18) 3 2017 base: €1,237 million; 2017 & 2018 before special items
For a detailed overview of special items please see the reconciliation tables on pages 19-20 in the PDF document.
Fresenius Helios
Fresenius Helios is Europe's leading private hospital operator. The company comprises Helios Germany and Helios Spain (Quirónsalud). Helios Germany operates 87 acute care hospitals, 89 outpatient centers and treats approximately 5.2 million patients annually. Quirónsalud operates 45 hospitals, 56 outpatient centers and around 300 occupational risk prevention centers, and treats approximately 11.6 million patients annually.

- 4% organic sales growth in Q2
- DRG catalogue effects and preparatory structural activities for anticipated regulatory measures weigh on financial performance of Helios Germany
- Helios Spain with accelerated growth: 8% organic sales growth and 19% EBIT growth in Q2
- 2018 outlook confirmed
Fresenius Helios increased sales by 10% to €4,674 million (H1/2017: €4,256 million). Organic sales growth was 4%. In Q2/2018, sales increased by 5% (organic growth: 4%) to €2,343 million (Q2/2017: €2,238 million).
Sales of Helios Germany increased by 3% (organic growth: 3%) to €3,121 million (H1/2017: €3,038 million). In Q2/2018, sales increased by 2% (organic growth: 3%) to €1,547 million (Q2/2017: €1,510 million). Helios Spain increased sales by 28% (organic growth: 5%) to €1,553 million (H1/2017: €1,218 million), mainly due to the additional month of consolidation compared to the prior-year period (Quirónsalud is consolidated since February 1, 2017). In Q2/2018 Helios Spain increased sales by 9% (organic growth: 8%) to €796 million (Q2/2017: €728 million).
Fresenius Helios grew EBIT by 6% to €571 million (H1/2017: €537 million) with a margin of 12.2% (H1/2017: 12.6%). In Q2/2018, EBIT increased by 4% to €293 million (Q2/2017: €282 million) with a margin of 12.5% (Q2/2017: 12.6%).
EBIT of Helios Germany decreased by 4% to €345 million (H1/2017: €359 million) with a margin of 11.1% (H1/2017: 11.8%). The decline is mainly due to additional catalogue effects, preparatory structural activities for anticipated regulatory requirements (i.e. clustering) as well as a lack of privatization opportunities in the German market. In Q2/2018, EBIT decreased by 6% to €168 million (Q2/2017: €178 million) with a margin of 10.9% (Q2/2017: 11.8%).
EBIT of Helios Spain increased by 28% to €227 million (H1/2017: €178 million), mainly due to the additional month of consolidation compared to the prior-year period, with a margin of 14.6% (H1/2017: 14.6%). In Q2/2018, EBIT increased by 19% to €124 million (Q2/2017: €104 million) with a margin of 15.6% (Q2/2017: 14.3%).
Net income1 of Fresenius Helios increased by 4% to €388 million (H1/2017: €373 million). In Q2/2018, net income1 increased by 3% to €197 million (Q2/2017: €192 million).
Operating cash flow was €259 million (H1/2017: €304 million) with a margin of 5.5% (H1/2017: 7.1%).
The already announced transfer of the in-patient post-acute care business from Fresenius Helios to Fresenius Vamed has become effective as of July 1, 2018. As a consequence, Fresenius Helios’ EBIT growth outlook for 2018 was adjusted to 5% to 8% (previously: 7% to 10%).
Fresenius Helios confirms its outlook for 2018 and expects organic sales growth of 3% to 6% and EBIT growth of 5% to 8%.
1 Net income attributable to shareholders of Fresenius SE & Co. KGaA
Fresenius Vamed
Fresenius Vamed manages projects and provides services for hospitals and other health care facilities worldwide and is a post-acute care provider in Central Europe. The portfolio ranges along the entire value chain: from project development, planning, and turnkey construction, via maintenance and technical management, to total operational management.

- Service business with continued good momentum: 11% sales growth in Q2
- Project business with good order intake of €195 million in Q2
- Transfer of inpatient post-acute care business from Helios Germany to Vamed as of July 1, 2018
- 2018 outlook confirmed
Sales increased by 7% (7% in constant currency) to €515 million (H1/2017: €481 million). Organic sales growth was 5%. Sales in the project business increased by 4% to €191 million (H1/2017: €184 million). Sales in the service business grew by 9% to €324 million (H1/2017: €297 million). In Q2/2018, sales increased by 3% (organic growth: 1%) to €266 million (Q2/2017: €258 million).
EBIT increased by 6% to €18 million (H1/2017: €17 million) with a margin of 3.5% (H1/2017: 3.5%). In Q2/2018, EBIT increased by 9% to €12 million (Q2/2017: €11 million) with a margin of 4.5% (Q2/2017: 4.3%).
Net income1 of €11 million was unchanged from prior-year’s level. In Q2/2018, net income1 was also unchanged at €7 million.
Order intake increased by 10% to €455 million (H1/2017: €412 million). As of June 30, 2018, order backlog was €2,372 million (December 31, 2017: €2,147 million).
The already announced transfer of the in-patient post-acute care business from Fresenius Helios to Fresenius Vamed has become effective as of July 1, 2018. As a consequence, Fresenius Vamed’s EBIT growth outlook for 2018 was adjusted to 32% to 37% (previously: 5% to 10%).
Fresenius Vamed confirms its outlook for 2018 and expects organic sales growth in the range of 5% to 10% and EBIT growth of 32% to 37%.
1 Net income attributable to shareholders of VAMED AG
Conference Call
As part of the publication of the results for the second quarter / first half of 2018, a conference call will be held on July 31, 2018 at 2 p.m. CET (8 a.m. EST). All investors are cordially invited to follow the conference call in a live broadcast over the Internet at www.fresenius.com/investors. Following the call, a replay will be available on our website.
For additional information on the performance indicators used please refer to our website https://www.fresenius.com/alternative-performance-measures
This release contains forward-looking statements that are subject to various risks and uncertainties. Future results could differ materially from those described in these forward-looking statements due to certain factors, e.g. changes in business, economic and competitive conditions, regulatory reforms, results of clinical trials, foreign exchange rate fluctuations, uncertainties in litigation or investigative proceedings, and the availability of financing. Fresenius does not undertake any responsibility to update the forward-looking statements in this release.
More than a year after closing its acquisition of the Spanish hospital operator Quirónsalud, Fresenius Helios foresees strong prospects for further international growth. At a Capital Markets Day in Berlin today, Fresenius provided investors and analysts with an overview of the progress made in the cooperation between Helios Germany and Quirónsalud, which is opening up new growth opportunities in many areas.
Fresenius Helios confirmed the medium-term target for synergies of €50 million annually. Cooperating in laboratory services and joint purchasing has already achieved cost savings in the current business year that should increase to €30 million per year in the medium term. Annual sales synergies of about €20 million are expected from knowledge transfers in medicine, new models for patient care, and digitalization, among other measures.
Quirónsalud has already begun to implement the system developed by Helios Germany for measuring and assessing data on medical quality. To increase transparency and spur individual hospitals to compete on quality, Helios Germany publishes treatment data on the most important and common medical indications for each hospital in direct comparison with national averages compiled by Germany’s Federal Statistical Office. Quirónsalud has already adapted most of these quality indicators. It has also launched peer reviews, collegial exchanges in which the responsible physicians from the individual hospitals advise and consult with each other on questions concerning treatment quality. These exchanges have already led to significant quality improvements at Helios Germany.
The knowledge transfer also extends to digitalization: Quirónsalud’s advanced know-how in patient-oriented uses includes the development of apps, while Helios Germany is particularly strong in IT processes.
Stephan Sturm, CEO of Fresenius, said: “Helios Germany and Quirónsalud are bundling their respective strengths across national borders, exchanging experience and knowledge. This benefits our patients, in Spain as well as in Germany. And it is creating, step by step, the economic prerequisites for the further internationalization of our hospital business. The driving force behind our business success is, and will remain, our clear focus on the well-being of patients. So wherever and whenever we can do more for our patients through closer cooperation between our business segments, we will seize that opportunity.”
Fresenius Helios will also profit from combining the experience gained from the very different health care systems of Spain and Germany. The Spanish system, for its part, allows a great deal of flexibility in care provision models. In Madrid, for example, Quirónsalud has been given responsibility for providing health care to publicly funded patients in designated parts of the city in return for a set reimbursement rate. For patients, however, treatment quality remains the decisive criterion, and assigned patients are still free to choose another hospital. If they do, the cost must be assumed by the hospital that was originally assigned to their care. This increased competition stimulates continuous improvement in areas that are of crucial importance to patients – such as medical quality, service and shorter waiting times. All of these are core competencies of Quirónsalud.
Another area where Fresenius Helios can now draw on its experience from two different health care systems is in classifications of inpatient and outpatient care. The two are strictly separated in Germany, but less so in Spain: Many treatments and after-care procedures that Germans undergo as inpatients are provided to their Spanish counterparts on an outpatient basis – often resulting in significantly shorter hospital stays.
Dr. Francesco de Meo, who is responsible for Fresenius Helios on the Fresenius Management Board, said: “Helios Germany and Quirónsalud are leaders in their home markets, each of which has different reimbursement and care models and health insurance systems. In response, each company has developed its own strengths, which excellently complement each other and can be used to their mutual advantage. We expect this will contribute to higher medical quality and more efficiency, and bring us closer to patients. Thus, together we are building a common base of knowledge and experience that will help us to enter new markets.”
Cooperation with Fresenius Vamed is also being intensified – for example, in procurement, where Fresenius Helios and Fresenius Vamed are now jointly purchasing certain products. In addition, Fresenius Vamed has started providing Quirónsalud hospitals in Spain with technical services and medical technology, as it was already doing for Helios Germany. In Germany, meanwhile, Fresenius Helios and Fresenius Vamed will combine their know-how in hospital construction in order to bundle their competencies in construction and project management.
Earlier this week, the two companies agreed that Fresenius Helios’ inpatient rehabilitation business in Germany will be transferred to Fresenius Vamed on July 1, 2018. This will put Fresenius Helios on a stronger growth footing, with an even clearer focus on the acute-care hospital business and its further internationalization.
Webcast of the event:
Fresenius Helios Capital Markets Day will be available as a webcast on the Internet under: www.fresenius.com/investors-new-developments
This release contains forward-looking statements that are subject to various risks and uncertainties. Future results could differ materially from those described in these forward-looking statements due to certain factors, e.g. changes in business, economic and competitive conditions, regulatory reforms, results of clinical trials, foreign exchange rate fluctuations, uncertainties in litigation or investigative proceedings, and the availability of financing. Fresenius does not undertake any responsibility to update the forward-looking statements in this release.
Q1/2018:
- Sales: €8.1 billion (-1%, +7% in constant currency1)
- EBIT2: €1,054 million (-13%, -5% in constant currency)
- EBIT2: €1,089 million (-10%, -2% in constant currency) (excluding biosimilars business)
- Net income2,3: €450 million (-2%, +7% in constant currency)
- Net income2,3: €476 million (+4%, +12% in constant currency) (excluding biosimilars business)
1 Growth rates adjusted for IFRS 15 adoption (Q1/17 base: €8,223 million) 2 Before special items (i.e., expenses related to (i) the Akorn transaction, and (ii) the re-valuation of Sound Physicians’ share-based payment program caused by its announced divestiture) 3 Net income attributable to shareholders of Fresenius SE & Co. KGaA
For a detailed overview of special items please see the reconciliation table on page 16 of the PDF.
Fresenius terminates merger agreement with Akorn
Fresenius decided on April 22, 2018, to terminate the company’s merger agreement with Akorn, due to Akorn’s failure to fulfill several closing conditions. Fresenius’ decision is based on, among other factors, material breaches of FDA (Food and Drug Administration) data integrity requirements relating to Akorn’s operations found during Fresenius’ independent investigation. Fresenius had offered to delay its decision in order to allow Akorn additional opportunity to complete its own investigation and present any information it wished Fresenius to consider, but Akorn declined that offer.
Akorn disagrees with Fresenius’ position and has filed a corresponding complaint. Fresenius in turn has filed a counterclaim on April 30, 2018.
Group guidance1 for 2018 confirmed
Fresenius confirms its guidance for 2018. Group sales are expected to increase by 5% to 8%2 in constant currency. Net income3,4 is expected to grow by 6% to 9% in constant currency. Excluding expenditures for the further development of the biosimilars business, net income3,5 is expected to grow by ~10% to 13% in constant currency.
Fresenius expects to further reduce its net debt/EBITDA6 ratio by year-end 2018.
7% sales growth in constant currency7
Group sales decreased by 1%7 (increased by 7%7 in constant currency) to €8,121 million (Q1/2017: €8,362 million). Organic sales growth was 4%. Acquisitions/divestitures contributed net 3% to growth. Sales growth was impacted by the anticipated decline in the pharmacy business within Care Coordination at Fresenius Medical Care North America. Also at Fresenius Medical Care, the prior-year quarter saw the compensation for treatments of U.S. war veterans in previous years ("VA agreement"), contributing €100 million as a one-time effect. Negative currency translation effects (8%) were mainly driven by the devaluation of the U.S. dollar and the Chinese yuan against the euro.
1 Excluding effects of the Akorn, NxStage and Sound Physicians transactions2 2017 base adjusted for IFRS 15 adoption (deduction of €486 million at Fresenius Medical Care) 3 Net income attributable to shareholders of Fresenius SE & Co. KGaA 4 2017 base: €1,816 million; 2018 before special items (i.e., transaction-related effects); including expenditures for further development of biosimilars business (€43 million after tax in FY/17 and ~€120 million after tax in FY/18) 5 2017 base: €1,859 million; 2018 before special items (i.e., transaction-related effects) 6 Calculated at expected annual average exchange rates, for both net debt and EBITDA; excluding effects of the Akorn, NxStage and Sound Physicians transactions; excluding further potential acquisitions; at current IFRS rules 7 Growth rates adjusted for IFRS 15 adoption (Q1/17 base: €8,223 million)
Group sales by region:

1 2017 adjusted for IFRS 15 adoption (deduction of €139 million at Fresenius Medical Care)
7% net income1,2 growth in constant currency
Group EBITDA2 decreased by 10% (-2% in constant currency) to €1,403 million (Q1/2017: €1,560 million). Group EBIT2 decreased by 13% (-5% in constant currency) to €1,054 million (Q1/2017: €1,216 million). The prior-year quarter was strongly influenced by a positive one-time effect: the VA agreement contributed €99 million, or 10%, to EBIT growth in constant currency in Q1/17. The EBIT margin2 was 13.0% (12.7% before IFRS 15; Q1/2017: 14.5%). Group EBIT2 before expenses for the further development of the biosimilars business decreased by 10% (-2% in constant currency) to €1,089 million. Group EBIT2 before VA agreement and excluding the expenses for the biosimilars business increased by 6% in constant currency.
Group net interest2 was -€146 million (Q1/2017: -€157 million). The decrease is mainly driven by currency effects and positive refinancing activities.
The decrease of the Group tax rate before special items to 21.0% (Q1/2017: 29.1%) was mainly due to the U.S. tax reform and a one-time tax effect at Fresenius Medical Care.
Noncontrolling interest2 was €267 million (Q1/2017: €294 million), of which 95% was attributable to the noncontrolling interest in Fresenius Medical Care.
Group net income1,2 decreased by 2% (increased by 7% in constant currency) to €450 million (Q1/2017: €457 million). Earnings per share1,2 decreased by 2% (increased by 6% in constant currency) to €0.81 (Q1/2017: €0.83).
Group net income1,2 before expenses for the further development of the biosimilars business increased by 4% (12% in constant currency) to €476 million (Q1/2017: €457 million). Earnings per share1,2 before expenses for the further development of the biosimilars business increased by 4% (11% in constant currency) to €0.86 (Q1/2017: €0.83).
Group net income1 after special items decreased by 4% (increased by 4% in constant currency) to €440 million (Q1/2017: €457 million). Earnings per share1 after special items decreased by 5% (increased by 4% in constant currency) to €0.79 (Q1/2017: €0.83).
1 Net income attributable to shareholders of Fresenius SE & Co. KGaA 2 Before special items
For a detailed overview of special items please see the reconciliation table on page 16 of the PDF.
Continued investment in growth
Spending on property, plant and equipment was €380 million (Q1/2017: €328 million), primarily for the modernization and expansion of dialysis clinics, production facilities as well as hospitals and day clinics. This corresponds to 4.7% of sales.
Total acquisition spending was €192 million (Q1/2017: €6,083 million). The prior-year quarter included the acquisition of Quirónsalud.
Cash flow development
Operating cash flow decreased by 50% to €236 million (Q1/2017: €476 million) with a margin of 2.9% (Q1/2017: 5.7%). The decrease is mainly attributable to prior years’ received payment under the VA agreement of ~€200 million as well as to the seasonality in invoicing at Fresenius Medical Care North America, which is not expected to impact full year 2018 cash flow.
Free cash flow before acquisitions and dividends decreased to -€155 million (Q1/2017: €148 million). Free cash flow after acquisitions and dividends was -€389 million (Q1/2017: -€5,393 million).
Solid balance sheet structure
The Group’s total assets increased by 1% (2% in constant currency) to €53,502 million (Dec. 31, 2017: €53,133 million). Current assets grew by 6% (8% in constant currency) to €13,409 million (Dec. 31, 2017: €12,604 million). Non-current assets decreased by 1% (0% in constant currency) to €40,093 million (Dec. 31, 2017: € 40,529 million).
Total shareholders’ equity increased by 1% (3% in constant currency) to €22,020 million (Dec. 31, 2017: €21,720 million). The equity ratio increased to 41.2% (Dec. 31, 2017: 40.9%).
Group debt increased by 1% (2% in constant currency) to €19,200 million (Dec. 31, 2017: € 19,042 million). Group net debt increased by 2% (3% in constant currency) to € 17,716 million (Dec. 31, 2017: € 17,406 million).
As of March 31, 2018, the net debt/EBITDA ratio was 2.98 , (December 31, 2017: 2.841,2).
1 At LTM average exchange rates for both net debt and EBITDA; pro forma closed acquisitions, excluding Akorn, NxStage and Sound Physicians transactions 2 Before special items
For a detailed overview of special items please see the reconciliation table on page 16 of the PDF.
Business Segments
Fresenius Medical Care
Fresenius Medical Care is the world's largest provider of products and services for individuals with renal diseases. As of March 31, 2018, Fresenius Medical Care was treating 322,253 patients in 3,790 dialysis clinics. Along with its core business, the company provides related medical services in the field of Care Coordination.

- Q1/2018 growth impacted by significant currency headwinds and positive one-time effect in prior years’ quarter
- 2018 outlook of net income growth4,7 of 13 to 15% in constant currency confirmed
- 2018 sales growth8 target adjusted to 5 to 7% at constant currency (previously ~8%), mainly due to recent reduction in dosing of calcimimetic drugs in the U.S.
Reported sales were strongly impacted by headwinds from foreign exchange rates and by the anticipated decline in the pharmacy business within Care Coordination at Fresenius Medical Care North America. Sales decreased by 10%1 (increased by 2%1 in constant currency) to €3,976 million (Q1/2017: €4,548 million). Organic sales growth was 3%. Acquisitions/divestitures and the VA agreement in the prior-year quarter decreased sales by 1%. Currency translation effects reduced sales by 12%. Excluding the VA agreement in the prior-year quarter, sales growth1 was 4% in constant currency.
1 Growth rate adjusted for IFRS 15 adoption (Q1/17 base: €4,409 million) 2 Excluding VA agreement: 4% 3 Adjusted for re-valuation of Sound Physicians’ share-based payment program and excluding VA agreement: 3% 4 Net income attributable to shareholders of Fresenius Medical Care AG & Co. KGaA 5 Adjusted for re-valuation of Sound Physicians’ share-based payment program, the effect of the U.S. Tax Reform and excluding VA agreement: 8% 6 Consistent with guidance, adjusted for re-valuation of Sound Physicians’ share-based payment program, including the effect of the U.S. Tax Reform and including VA agreement 7 2017 base: €1,280 million; 2018 including benefits from U.S. tax reform and adjusted for the Sound valuation impact 8 2017 reported sales: €17,784 million, adjusted for IFRS 15 adoption (deduction of €486 million)
Health Care services sales (dialysis services and care coordination) decreased by 12%1 (increased by 1%1 in constant currency) to €3,209 million (Q1/2017: €3,769 million). Health Care product sales decreased by 2% (increased by 6% in constant currency) to €767 million (Q1/2017: €779 million).
In North America, sales decreased by 14%1 (-1%1 in constant currency) to €2,774 million (Q1/2017: €3,375 million). Health Care services sales decreased by 14%1 (-1%1 in constant currency) to €2,590 million (Q1/2017: €3,165 million) mainly due to the prior-year VA agreement (€100 million). Excluding the 2017 effect from the VA Agreement Health Care services sales increased by 2%1 in constant currency. Health Care product sales decreased by 12% (increased by 1% in constant currency) to €184 million (Q1/2017: €210 million).
Sales outside North America increased by 2% (10% in constant currency) to €1,198 million (Q1/2017: €1,169 million). Health Care services sales increased by 2% (12% in constant currency) to €619 million (Q1/2017: €604 million). Health Care product sales increased by 3% (8% in constant currency) to €579 million (Q1/2017: €564 million).
Fresenius Medical Care’s EBIT decreased by 24% (-15% in constant currency) to €497 million (Q1/2017: €651 million). The EBIT margin was 12.5% (Q1/2017: 14.3%). Adjusted for the effect of the implementation of IFRS 15, the re-valuation of Sound Physicians’ share-based payment program in connection with the announced divestiture of Sound Physicians and for the positive effect of the VA Agreement in Q1/2017, EBIT was up by 3% in constant currency and EBIT margin was stable at 12.8%.
Net income2 of Fresenius Medical Care decreased by 10% (0% in constant currency) to €279 million (Q1/2017: €308 million). Consistent with guidance, i.e. adjusted for the re-valuation of Sound Physicians’ share-based payment program, net income growth2 was 5% in constant currency. Adjusted for the re-valuation of Sound Physicians’ share-based payment program and the effect of the U.S. Tax Reform in 2018 and for the positive effect of the VA agreement, net income growth2 was 8% in constant currency.
1 Growth rate adjusted for IFRS 15 adoption (Q1/17: deduction of €139 million)2 Net income attributable to shareholders of Fresenius Medical Care AG & Co. KGaA
Operating cash flow was -€45 million (Q1/2017: €170 million). The cash flow margin was 1.1% (Q1/2017: 3.7%). The decrease is mainly attributable to prior years’ payment under the VA agreement of ~€200 million as well as to the seasonality in invoicing at Fresenius Medical Care North America, which is not expected to impact full year 2018 cash flow.
Mainly driven by the change in dosing of calcimimetic drugs, Fresenius Medical Care expects sales to grow by 5 to 7%1 (previously: ~8%1 ) in constant currency. Fresenius Medical Care expects net income2 growth of 13% to 15%3 in constant currency and excluding special items of 7% to 9%4.
The 2018 targets are based on 2017 figures adjusted for the adoption of IFRS 15 implementation and exclude effects from the planned acquisition of NxStage Medical and the announced divestiture of Sound Physicians.
1 2017 reported sales: €17,784 million, adjusted for IFRS 15 adoption (deduction of €486 million) 2 Net income attributable to shareholders of Fresenius Medical Care AG & Co. KGaA 3 2017 base: €1,280 million; 2018 including benefits from U.S. tax reform and adjusted for the Sound valuation impact 4 VA Agreement, Natural Disaster Costs, FCPA related charge, U.S. Tax Reform
For further information, please see Fresenius Medical Care’s Investor News at www.freseniusmedicalcare.com.
Fresenius Kabi
Fresenius Kabi offers intravenously administered generic drugs, clinical nutrition and infusion therapies for seriously and chronically ill patients in the hospital and outpatient environments. The company is also a leading supplier of medical devices and transfusion technology products. In the biosimilars business, we are developing products with a focus on oncology and autoimmune diseases.

- Excellent start to 2018
- 9% organic sales growth; 10% EBIT1 growth in constant currency (excluding biosimilars business)
- Strong negative currency translation effects
- Strong operating cash flow
- 2018 outlook confirmed
With €1,603 million (Q1/2017: €1,604 million), sales of Fresenius Kabi were on prior years level (increased by 9% in constant currency). Organic sales growth was 9%. Strong negative currency translation effects (-9%) were mainly related to the devaluation of the U.S. dollar and the Chinese yuan against the euro.
Sales in Europe grew by 2% (organic growth: 3%) to €557 million (Q1/2017: €544 million).
Sales in North America decreased by 5% (organic growth: 10%) to €591 million (Q1/2017: €619 million).
Sales in Asia-Pacific increased by 8% (organic growth: 15%) to €301 million (Q1/2017: €280 million). Sales in Latin America/Africa decreased by 4% (organic growth: 10%) to €154 million (Q1/2017: €161 million).
EBIT1 decreased by 14% (-2% in constant currency) to €268 million (Q1/2017: €313 million). The EBIT margin1 was 16.7% (Q1/2017: 19.5%).
1 Before special items 2 Before expenses for the further development of the biosimilars business: 10% 3 Net income attributable to shareholders of Fresenius SE & Co. KGaA4 Before expenses for the further development of the biosimilars business: 16%
For a detailed overview of special items please see the reconciliation table on page 16 of the PDF.
EBIT1 before expenses for the further development of the biosimilars business decreased by 3% (increased by 10% in constant currency) to €303 million (Q1/2017: €313 million). The EBIT margin1 before expenses for the further development of the biosimilars business was 18.9% (Q1/2017: 19.5%).
Net income1,2 decreased by 11% (increased by 3% in constant currency) to €170 million (Q1/2017: €191 million).
Operating cash flow increased by 18% to €226 million (Q1/2017: €192 million). The cash flow margin was 14.1% (Q1/2017: 12.0%).
Fresenius Kabi confirms its outlook for 2018 and expects organic sales growth of 4% to 7% and EBIT growth in constant currency of -3% to -6%3. Excluding expenditures for the further development of the biosimilars business, EBIT is expected to grow by ~2% to 5%4 in constant currency.
1 Before special items 2 Net income attributable to shareholders of Fresenius SE & Co. KGaA 3 2017 base: €1,177 million; 2018 before special items (i.e., transaction-related expenses), including expenditures for the further development of the biosimilars business (€60 million in FY/17 and expected expenditures of ~€160 million in FY/18) 4 2017 base: €1,237 million; 2018 before special items (i.e., transaction-related expenses)
For a detailed overview of special items please see the reconciliation table on page 16 of the PDF.
Fresenius Helios
Fresenius Helios is Europe's leading private hospital operator. The company comprises Helios Germany and Helios Spain (Quirónsalud). Helios Germany operates 111 hospitals, thereof 88 acute care clinics and 23 post-acute care clinics, and treats more than 5.3 million patients annually. Quirónsalud operates 45 hospitals, 55 outpatient centers and around 300 occupational risk prevention centers, and treats approximately 11.6 million patients per year.

- 3% organic sales growth
- 9% EBIT increase
- 2018 outlook confirmed
Fresenius Helios increased sales by 16% to €2,331 million (Q1/2017: €2,018 million). Organic sales growth was 3%. The acquisition of Quirónsalud contributed 13% to sales growth. Helios Spain (Quirónsalud) has been consolidated since February 1, 2017.
Sales of Helios Germany increased by 3% (organic growth: 3%) to €1,574 million (Q1/2017: €1,528 million). Helios Spain increased sales by 54% (organic growth: 1%) to €757 million (Q1/2017: €490 million), mainly due to the additional month of consolidation compared to the prior-year quarter.
Fresenius Helios grew EBIT by 9% to €278 million (Q1/2017: €255 million). The EBIT margin was 11.9% (Q1/2017: 12.6%).
EBIT of Helios Germany decreased by 2% to €177 million (Q1/2017: €181 million) with a margin of 11.2% (Q1/2017: 11.8%). The decline is due to preparatory measures for anticipated regulatory structural requirements for minimum staffing as well as catalogue effects. The anticipated regulatory requirements will be countered by clustering.
EBIT of Helios Spain increased by 39% to €103 million (Q1/2017: €74 million), mainly due to the additional month of consolidation compared to prior-year quarter. The EBIT margin was 13.6% (Q1/2017: 15.1%).
Net income1 of Fresenius Helios increased by 6% to €191 million (Q1/2017: €181 million).
Operating cash flow was €97 million (Q1/2017: €184 million). The margin was 4.2% (Q1/2017: 9.1%).
Fresenius Helios confirms its outlook for 2018 and expects organic sales growth of 3% to 6% and EBIT growth of 7% to 10%.
1 Net income attributable to shareholders of Fresenius SE & Co. KGaA
Fresenius Vamed
Fresenius Vamed manages projects and provides services for hospitals and other health care facilities worldwide. The portfolio ranges along the entire value chain: from project development, planning, and turnkey construction, via maintenance and technical management, to total operational management.

- 9% organic sales growth
- Order backlog of €2,391 million at all-time high
- 2018 outlook confirmed
Sales increased by 12% (12% in constant currency) to €249 million (Q1/2017: €223 million). Organic sales growth was 9%. Sales in the project business increased by 19% to €92 million (Q1/2017: €77 million). Sales in the service business grew by 8% to €157 million (Q1/2017: €146 million).
EBIT of €6 million was unchanged from the prior-year level.
Net income1 of €4 million was also unchanged from prior-year level.
Order intake was €260 million (Q1/2017: €220 million). As of March 31, 2018, order backlog was €2,391 million (December 31, 2017: €2,147 million).
For 2018, Fresenius Vamed expects organic sales growth in the range of 5% to 10% and EBIT growth of 5% to 10%.
1 Net income attributable to shareholders of VAMED AG
Conference Call
As part of the publication of the results for the first quarter 2018, a conference call will be held on May 3, 2018 at 2 p.m. CET (8 a.m. EST). All investors are cordially invited to follow the conference call in a live broadcast over the Internet at www.fresenius.com/investors. Following the call, a replay will be available on our website.
For additional information on the performance indicators used please refer to www.fresenius.com/alternative-performance-measures.
This release contains forward-looking statements that are subject to various risks and uncertainties. Future results could differ materially from those described in these forward-looking statements due to certain factors, e.g. changes in business, economic and competitive conditions, regulatory reforms, results of clinical trials, foreign exchange rate fluctuations, uncertainties in litigation or investigative proceedings, and the availability of financing. Fresenius does not undertake any responsibility to update the forward-looking statements in this release.
If no timeframe is specified, information refers to fiscal year 2017.
Fiscal year 2017:
- Sales €33.9 billion (+15%, +16% in constant currency)
- EBIT1 (adjusted) €4,890 million (+14%, +15% in constant currency)
- Net income2,3 (adjusted) €1,859 million (+19%, +21% in constant currency)
- Net income3 (before special items) €1,816 million (+16%, +18% in constant currency)
- Net income3 €1,814 million (+16%, +18% in constant currency)
- Dividend proposal €0.75 per share (+21%)
Q4/2017:
- Sales €8.7 billion (+11%, +17% in constant currency)
- EBIT1 (adjusted) €1,354 million (+9%, +14% in constant currency)
- Net income2,3 (adjusted) €520 million (+18%, +22% in constant currency)
- Net income3 (before special items) €487 million (+10%, +15% in constant currency)
- Net income3 €511 million (+16%, +21% in constant currency)
1 Before acquisition-related expenses, expenditures for further development of biosimilars business and FCPA provision2 Consistent with scope of original guidance: before acquisition-related expenses, expenditures for further development of biosimilars business, book gain from U.S. tax reform and FCPA provision3 Net income attributable to shareholders of Fresenius SE & Co. KGaA
Investigation into alleged breaches of FDA data integrity requirements at Akorn, Inc.
Fresenius is conducting an independent investigation, using external experts, into alleged breaches of FDA data integrity requirements relating to product development at Akorn, Inc. The Management and Supervisory Boards of Fresenius will assess the findings of that investigation. The consummation of the transaction may be affected if the closing conditions under the merger agreement are not met. Fresenius does not intend to provide further updates as the investigation proceeds. Fresenius continues to seek FTC clearance.
Strong Group guidance1 for 2018
For 2018, Fresenius projects sales growth2 of 5% to 8% in constant currency. Net income3,4 is expected to grow by 6% to 9% in constant currency. Excluding expenditures for the further development of the biosimilars business, net income3,5 is expected to grow by ~10% to 13% in constant currency.
Fresenius expects to further reduce its net debt/EBITDA6 ratio by year-end 2018.
Mid-term growth targets 2020 confirmed7
Based on the strong financial results 2017, Fresenius confirms the 2020 mid-term growth targets. Group sales are expected to grow with a compounded annual growth rate (CAGR) in the range of 7.1% to 10.3% (Mid-point: 8.7%). Group net income3 is projected to increase with a CAGR in the range of 8.3% to 12.6% (Mid-point: 10.5%).
25th consecutive dividend increase proposed
Based on the strong financial results, the Management Board will propose to the Supervisory Board a dividend increase of 21% to €0.75 per share (2016: €0.62). The expected dividend distribution to the shareholders of Fresenius SE & Co. KGaA is €416 million.
1 Excluding pending acquisitions of Akorn and NxStage2 2017 adjusted for IFRS 15 (€486 million at Fresenius Medical Care)3 Net income attributable to shareholders of Fresenius SE & Co. KGaA4 Base 2017: €1,816 million; 2018 before special items (before acquisition-related expenses); including expenditures for further development of biosimilars business (€43 million after tax in FY/17 and ~€120 million after tax in FY/18)5 Base 2017: €1,859 million; 2018 before special items (before acquisition-related expenses)6 Calculated at expected annual average exchange rates, for both net debt and EBITDA; excluding pending acquisitions of Akorn and NxStage; excluding further potential acquisitions; at current IFRS rules7 At February 2017 exchange rates and IFRS rules; including small and mid-size acquisitions
16% sales growth in constant currency
Group sales increased by 15% (16% in constant currency) to €33,886 million (2016: €29,471 million). Organic sales growth was 6%. Acquisitions contributed 10%. Negative currency translation effects (1%) were mainly driven by the devaluation of the US dollar and the Chinese yuan against the euro. In Q4/2017, Group sales increased by 11% (17% in constant currency) to €8,695 million (Q4/2016: €7,820 million). Organic sales growth was 6%. Acquisitions contributed 11%.
Group sales by region:

1 Calculated on the basis of contribution to consolidated sales2 Including effects of agreement with the U.S. Departments of Veterans Affairs and Justice (VA agreement)
21% adjusted net income1,2 growth in constant currency
Group EBITDA3 increased by 14% (15% in constant currency) to €6,267 million (2016: €5,517 million). Adjusted Group EBIT4 increased by 14% (15% in constant currency) to €4,890 million (2016: €4,302 million). The adjusted EBIT margin4 was 14.4% (2016: 14.6%). In Q4/2017, adjusted Group EBIT4 increased by 9% (14% in constant currency) to €1,354 million (Q4/2016: €1,244 million), the adjusted EBIT margin4 was 15.6% (Q4/2016: 15.9%). Group EBIT3 before special items increased by 12% (14% in constant currency) to €4,830 million (2016: €4,302 million). The EBIT margin3 was 14.3% (2016: 14.6%). In Q4/2017, Group EBIT3 increased by 5% (11% in constant currency) to €1,308 million (Q4/2016: €1,244 million), the EBIT margin3 was 15.0% (Q4/2016: 15.9%).
Group net interest3 reached -€636 million (2016: -€582 million). The increase is mainly driven by the financing of the Quirónsalud acquisition, partly offset by positive effects from refinancing activities.
The Group tax rate before special items was 28.2% (2016: 28.1%). The U.S. tax reform, which went into effect on January 1, 2018, triggered a revaluation of deferred tax liabilities. This resulted in a one-time book gain of €103 million in 2017. Accordingly, the group tax rate after special items decreased to 23.0%.
Noncontrolling interest3 was €1,194 million (2016: €1,116 million), of which 95% was attributable to the noncontrolling interest in Fresenius Medical Care.
Adjusted Group net income1,2 increased by 19% (21% in constant currency) to €1,859 million (2016: €1,560 million). Adjusted earnings per share1,2 increased by 18% (19% in constant currency) to €3.35 (2016: €2.85). In Q4/2017, adjusted Group net income1,2 increased by 18% (22% in constant currency) to €520 million (Q4/2016: €442 million). Adjusted earnings per share1,2 increased by 16% (20% in constant currency) to €0.93 (Q4/2016: €0.81).
1 Net income attributable to shareholders of Fresenius SE & Co. KGaA2 Consistent with scope of original guidance: before acquisition-related expenses, expenditures for further development of biosimilars business, book gain from U.S. tax reform and FCPA provision3 Before special items4 Consistent with scope of original guidance: before acquisition-related expenses, expenditures for further development of biosimilars business and FCPA provision
For a detailed overview of special items and adjustments please see the reconciliation tables on pages 18-19 in the pdf document.
Group net income before special items1 increased by 16% (18% in constant currency) to €1,816 million (2016: €1,560 million). Earnings per share1,2 increased by 15% (16% in constant currency) to €3.28 (2016: €2.85). In Q4/2017, Group net income1,2 increased by 10% (15% in constant currency) to €487 million (Q4/2016: €442 million). Earnings per share1,2 increased by 9% (13% in constant currency) to €0.88 (Q4/2016: €0.81).
Group net income1 increased by 16% (18% in constant currency) to €1,814 million
(2016: €1,560 million). Earnings per share1 increased by 15% (16% in constant currency) to €3.27 (2016: €2.85). In Q4/2017, Group net income1 increased by 16% (21% in constant currency) to €511 million (Q4/2016: €442 million). Earnings per share1 increased by 14% (19% in constant currency) to €0.92 (Q4/2016: €0.81).
Continued investment in growth
Spending on property, plant and equipment was €1,828 million (2016: €1,633 million), primarily for the modernization and expansion of dialysis clinics, production facilities as well as hospitals and day clinics. This corresponds to 5.4% of sales.
Total acquisition spending of €6,852 million (2016: €926 million) was mainly related to the acquisitions of Quirónsalud and Merck KGaA’s biosimilars business.
Excellent cash flow development
Operating cash flow increased by 10% to €3,937 million (2016: €3,585 million) with a margin of 11.6% (2016: 12.2%). The excellent cash flow was driven by Fresenius Medical Care and a record cash flow at Fresenius Kabi.
Free cash flow before acquisitions and dividends increased by 13% to €2,232 million (2016: €1,969 million), with a margin of 6.6% (2016: 6.7%). Free cash flow after acquisitions and dividends was €-4,557 million (2016: €746 million) reflecting the acquisitions of Quirónsalud and Merck KGaA’s biosimilars business.
1 Net income attributable to shareholders of Fresenius SE & Co. KGaA2 Before special items
Solid balance sheet structure
The Group’s total assets increased by 14% (21% in constant currency) to €53,133 million (Dec. 31, 2016: €46,697 million), driven primarily by the acquisition of Quirónsalud. Current assets grew by 7% (15% in constant currency) to €12,604 million (Dec. 31, 2016: €11,744 million). Non-current assets increased by 16% (23% in constant currency) to €40,529 million (Dec. 31, 2016: € 34,953 million).
Total shareholders’ equity increased by 4% (14% in constant currency) to €21,720 million (Dec. 31, 2016: €20,849 million). The equity ratio decreased to 40.9% (Dec. 31, 2016: 44.6%).
Group debt increased by 29% (35% in constant currency) to €19,042 million (Dec. 31, 2016: € 14,780 million), mainly driven by the acquisition financing of Quirónsalud. Group net debt increased by 32% (37% in constant currency) to € 17,406 million (Dec. 31, 2016: € 13,201 million.
As of December 31, 2017, the net debt/EBITDA ratio was 2.841,2 (September 30, 2017: 2.971,2; December 31, 2016: 2.331; pro forma Quirónsalud 3.091).
1 At LTM average exchange rates for both net debt and EBITDA; pro forma acquisitions2 Before special items
Business Segments
Fresenius Medical Care
Fresenius Medical Care is the world's largest provider of products and services for individuals with renal diseases. As of December 31, 2017, Fresenius Medical Care was treating 320,960 patients in 3,752 dialysis clinics. Along with its core business, the company focuses on expanding the range of medical services in the field of Care Coordination.

- 9% sales growth in constant currency, 7% adjusted net income growth in constant currency3,4
- 13% operating cash flow growth
- 2018 outlook: ~8% sales growth5 in constant currency and 13 to 15% net income growth3,6 in constant currency expected
Sales1 increased by 7% (9% in constant currency) to €17,784 million (2016: €16,570 million). Organic sales growth was 7%. Acquisitions and divestitures increased sales by net 2%. Currency translation effects reduced sales by 2%. In Q4/2017, sales of €4,429 million (Q4/2016: €4,417 million) were on the prior-year level (increased by 8% in constant currency).
Health Care services sales (dialysis services and care coordination) increased by 8% (10% in constant currency) to €14,532 million (2016: €13,505 million). Dialysis product sales increased by 6% (7% in constant currency) to €3,252 million (2016: €3,064 million).
In North America, sales increased by 7% to €12,879 million (2016: €12,030 million). Health Care services sales grew by 7% to €12,036 million (2016: €11,214 million). Dialysis product sales increased by 3% to €843 million (2016: €816 million).
Sales outside North America increased by 8% (9% in constant currency) to €4,890 million (2016: €4,527 million). Health Care services sales increased by 9% (11% in constant currency) to €2,496 million (2016: €2,292 million). Dialysis product sales increased by 6% (7% in constant currency) to €2,315 million (2016: €2,185 million).
1 Excluding agreement with the United States Depatment of Veterans Affairs and Justice (VA agreement): €17,689 million2 Before natural disaster costs, VA agreement and FCPA provision3 Net income attributable to shareholders of Fresenius Medical Care AG & Co. KGaA4 Before book gain from U.S. tax reform, natural disaster costs, VA agreement and FCPA provision5 Reported sales 2017 of €17,784 million, adjusted for IFRS 15 (€486 million)6 Base 2017: €1,280 million; 2018 including recurring benefits from U.S. tax reform of €140 million to €160 million
EBIT decreased by -2% (0% in constant currency) to €2,362 million (2016: €2,409 million). Adjusted EBIT1 increased by 4% (5% in constant currency) to €2,493 million (2016: €2,409 million), mainly due to the strong business performance in North America and in Asia-Pacific. The adjusted EBIT1 margin was 14.1% (2016: 14.5%). In Q4/2017, EBIT decreased by -29% (-22% in constant currency) to €519 million (2016: €730 million). In Q4/2017, adjusted EBIT1 of €726 million (Q4/2016: €730 million) was slighty below the prior-year level (increased by 6% in constant currency). The adjusted EBIT margin1 was 16.4% (Q4/2016: 16.5%).
Net income2 increased by 12% (14% in constant currency) to €1,280 million (2016: €1,144 million). Consistent with the original scope of guidance, i.e. excluding the effects of the VA agreement, natural disaster costs, the book gain from the US tax reform and the FCPA provision, net income2 increased by 7% in constant currency. In Q4/2017, net income2 increased by 8% (increased 16% in constant currency) to €394 million (Q4/2016: €363 million). Excluding the effects of the VA agreement, natural disaster costs, the book gain from the US tax reform and the FCPA provision, net income2 increased by 6% in constant currency.
Operating cash flow increased by 13% to €2,192 million (2016: €1,932 million). The cash flow margin was 12.3% (2016: 11.7%).
For 2018, Fresenius Medical Care expects sales to grow by ~8%3 in constant currency. The 2018 guidance is based on 2017 sales adjusted for the effect of the IFRS 15 implementation. Net income2 is expected to increase by 13% to 15%4 in constant currency in 2018, including recurring benefits from U.S tax reform of €140 million to €160 million.
1 Before natural disaster costs, effects of VA agreement and FCPA provision2 Net income attributable to shareholders of Fresenius Medical Care AG & Co. KGaA3 Reported sales 2017 of €17,784 million, adjusted for effect from IFRS 15 (€486 million)4 Base 2017: €1,280 million
For further information, please see Fresenius Medical Care’s Investor News at www.freseniusmedicalcare.com.
Fresenius Kabi
Fresenius Kabi offers intravenously administered generic drugs, clinical nutrition and infusion therapies for seriously and chronically ill patients in the hospital and outpatient environments. The company is also a leading supplier of medical devices and transfusion technology products. In the biosimilars business, we are developing products with a focus on oncology and autoimmune diseases.

- 7% organic sales growth, 8% EBIT2 growth in constant currency
- Operating cash flow at all-time high
- 2018 outlook: 4% to 7% organic sales growth and -3% to -6% EBIT growth5 in constant currency expected (~2% to 5%6 excl. biosimilars expenses)
1 Before special items2 Consistent with scope of original guidance: before acquisition-related expenses and expenditures for further development of biosimilars business3 Net income attributable to shareholders of Fresenius SE & Co. KGaA4 Consistent with scope of original guidance: before acquisition-related expenses, expenditures for further development of biosimilars business and book gain from U.S. tax reform5 Base 2017: €1,177 million; 2018 before special items (before acquisition-related expenses), including expenditures for further development of biosimilars business (€60 million in FY/17 and expected expenditures of ~€160 million in FY/18)6 Base: 2017: €1,237 million; 2018 before special items (before acquisition-related expenses)
Sales increased by 6% (7% in constant currency) to €6,358 million (2016: €6,007 million). Organic sales growth was 7%. Negative currency translation effects (-1%) were mainly related to the devaluation of the US dollar and the Chinese yuan against the Euro. In Q4/2017, sales increased by 3% (8% in constant currency) to €1,594 million (Q4/2016: €1,550 million). Organic sales growth was 8%.
Sales in Europe grew by 4% (organic growth: 5%) to €2,214 million (2016: €2,135 million). In Q4/2017, sales increased by 2% (3% organic) to €579 million (Q4/2016: €566 million).
Sales in North America increased by 6% (8% organic) to €2,290 million (2016: €2,170 million). In Q4/2017, sales increased by 2% (11% organic) to €554 million (Q4/2016: €542 million).
Sales in Asia-Pacific increased by 8% (11% organic) to €1,196 million (2016: €1,108 million). In Q4/2017, sales increased by 5% (11% organic) to €302 million (Q4/2016: €287 million). Sales in Latin America/Africa increased by 11% (10% organic) to €658 million (2016: €594 million). In Q4/2017, sales increased by 3% (10% organic) to €159 million (Q4/2016: €155 million).
Adjusted EBIT1 increased by 6% (8% in constant currency) to €1,237 million (2016: €1,171 million). The adjusted EBIT margin1 was 19.5% (2016: 19.5%). In Q4/2017, adjusted EBIT1 increased by 3% (9% in constant currency) to €318 million (Q4/2016: €308 million). The adjusted EBIT margin1 was 19.9% (Q4/2016: 19.9%).
EBIT before special items increased by 1% (3% in constant currency) to €1,177 million (2016: €1,171 million). The EBIT margin before special items was 18.5% (2016: 19.5%). In Q4/2017, EBIT before special items decreased by -12% ( 6% in constant currency) to €272 million (Q4/2016: €308 million). The EBIT margin before special items decreased to 17.1% (Q4/2016: 19.9%) due to expenditures for the further development of biosimilars business.
Adjusted net income2,3 increased by 10% (13% in constant currency) to €745 million (2016: €675 million). In Q4/2017, adjusted net income2,3 increased by 4% (10% in constant currency) to €191 million (Q4/2016: €184 million).
Operating cash flow reached an all-time high of €1,010 million (2016: €1,004 million). The cash flow margin was 15.9% (2016: 16.7%).
For 2018, Fresenius Kabi expects organic sales growth of 4% to 7% and EBIT growth in constant currency of -3% to -6%4. Excluding expenditures for the further development of the biosimilars business EBIT is expected to grow by ~2% to 5%5 in constant currency.
1 Consistent with scope of original guidance: before acquisition-related expenses and expenditures for further development of biosimilars business2 Net income attributable to shareholders of Fresenius SE & Co. KGaA3 Consistent with scope of original guidance: before acquisition-related expenses, expenditures for further development of biosimilars business and book gain from U.S. tax reform4 Base 2017: €1,177 million; 2018 before special items (before acquisition-related expenses), including expenditures for further development of biosimilars business (€60 million in FY/17 and expected expenditures of ~€160 million in FY/18)5 Base: 2017: €1,237 million; 2018 before special items (before acquisition-related expenses)
Fresenius Helios
Fresenius Helios is Europe's leading private hospital operator. The company comprises Helios Germany and Helios Spain (Quirónsalud). Helios Germany operates 111 hospitals, thereof 88 acute care clinics and 23 post-acute care clinics, and treats more than 5.3 million patients annually. Quirónsalud operates 45 hospitals, 55 outpatient centers and around 300 occupational risk prevention centers, and treats approximately 11.6 million patients per year.

- 4% organic sales growth
- 54% EBIT increase (6% excluding Quirónsalud)
- 2018 outlook: 3% to 6% organic sales growth and EBIT growth of 7% to 10% expected
Fresenius Helios increased sales by 48% to €8,668 million (2016: €5,843 million). Organic sales growth was 4%. Acquisitions, mainly Quirónsalud, increased sales by 44%. In Q4/2017, sales increased by 54% to €2,246 million (Q4/2016: €1,461 million), organic sales growth was 3%.
Sales of Helios Germany increased by 4% (4% organic) to €6,074 million (2016: €5,843 million). In Q4/2017, sales increased by 3% (3% organic) to €1,512 million (Q4/2016: €1,461 million). Helios Spain (Quirónsalud) has been consolidated since February 1, 2017 and generated sales of €2,594 million (thereof €734 million in Q4/2017).
Fresenius Helios grew EBIT by 54% to €1,052 million (2016: €683 million). The EBIT margin increased to 12.1% (2016: 11.7%). In Q4/2017, EBIT increased by 61% to €283 million (Q4/2016: €176 million). The EBIT margin increased to 12.6% (Q4/2016: 12.0%).
EBIT of Helios Germany increased by 6% to €725 million (2016: €683 million) with a margin of 11.9% (2016: 11.7%). In Q4/2017, EBIT of Helios Germany was on the prior-year level with €176 million (Q4/2016: €176 million). The margin was 11.6% (2016: 12.0%).
EBIT of Helios Spain was €327 million (thereof €107 million in Q4/2017) with a margin of 12.6% (Q4/2017: 14.6%).
Net income1 increased by 34% to €728 million (2016: €544 million). In Q4/2017, net income1 increased by 42% to €202 million (Q4/2016: €142 million).
Operating cash flow increased by 18% to €733 million (2016: €622 million) driven by the first-time consolidation of Quirónsalud and an excellent operating result. The margin was 8.5% (2016: 10.6%).
For 2018, Fresenius Helios expects organic sales growth of 3% to 6% and EBIT growth of 7% to 10%.
1 Net income attributable to shareholders of Fresenius SE & Co. KGaA
Fresenius Vamed
Fresenius Vamed manages projects and provides services for hospitals and other health care facilities worldwide. The portfolio ranges along the entire value chain: from project development, planning, and turnkey construction, via maintenance and technical management, to total operational management.

- 6% organic sales growth, 10% EBIT growth
- Order intake of €1,096 million at all-time high
- 2018 outlook: 5% to 10% organic sales growth and 5% to 10% EBIT growth expected
Sales increased by 6% (6% in constant currency) to €1,228 million (2016: €1,160 million). Organic sales growth was 6%. Sales in the project business increased by 2% to €606 million (2016: €594 million). Sales in the service business grew by 10% to €622 million (2016: €566 million). In Q4/2017, sales increased by 14% to €480 million (Q4/2016: €420 million). Organic sales growth was 14%.
EBIT grew by 10% to €76 million (2016: €69 million). The EBIT margin increased to 6.2% (2016: 5.9%). In Q4/2017, EBIT increased by 16% to €44 million (Q4/2016: €38 million). The EBIT margin increased to 9.2% (2016: 9.0%).
Net income1 grew by 11% to €50 million (2016: €45 million). In Q4/2017, net income1 increased by 21% to €29 million (Q4/2016: €24 million).
Order intake increased to €1,096 million (2016: €1,017 million), reaching an all-time high. As of December 31, 2017, order backlog was €2,147 million (Dec. 31, 2016: €1,961 million).
For 2018, Fresenius Vamed expects organic sales growth in the range of 5% to 10% and EBIT growth of 5% to 10%.
1 Net income attributable to shareholders of VAMED AG
Conference Call
As part of the publication of the results for fiscal year 2017, a conference call will be held on February 27, 2018 at 2 p.m. CET (8 a.m. EST). All investors are cordially invited to follow the conference call in a live broadcast over the Internet at www.fresenius.com/investors. Following the call, a replay will be available on our website.
For additional information on the performance indicators used please refer to our website www.fresenius.com/alternative-performance-measures
This release contains forward-looking statements that are subject to various risks and uncertainties. Future results could differ materially from those described in these forward-looking statements due to certain factors, e.g. changes in business, economic and competitive conditions, regulatory reforms, results of clinical trials, foreign exchange rate fluctuations, uncertainties in litigation or investigative proceedings, and the availability of financing. Fresenius does not undertake any responsibility to update the forward-looking statements in this release.
Fresenius expects meaningful positive effects from the tax reform legislation signed into law in the United States today. The new law goes into effect on January 1, 2018.
The new legislation triggers the revaluation of deferred tax liabilities. This results in a one-time book gain of approximately EUR 90 million, to be reflected in Fresenius’ 2017 Group net income1. Thereof, approximately EUR 30 million are attributable to Fresenius Kabi and approximately EUR 60 million2 to Fresenius Medical Care.
Fresenius will report FY17 results and provide FY18 guidance including details on recurring tax effects resulting from the US tax reform on February 27, 2018.
1 Net income attributable to shareholders of Fresenius SE & Co. KGaA
2 Based on Fresenius’ 31% shareholding in Fresenius Medical Care AG & Co. KGaA
This release contains forward-looking statements that are subject to various risks and uncertainties. Future results could differ materially from those described in these forward-looking statements due to certain factors, e.g. changes in business, economic and competitive conditions, regulatory reforms, results of clinical trials, foreign exchange rate fluctuations, uncertainties in litigation or investigative proceedings, and the availability of financing. Fresenius does not undertake any responsibility to update the forward-looking statements in this release.