
Fresenius has successfully signed a €2 billion syndicated revolving credit facility with an international consortium of 29 core relationship banks. It has a maturity of five years with two one-year extension options and can be drawn in various currencies.
The new credit facility replaces the existing €1.1 billion and US$500 million revolving credit facilities, originally entered into in 2012 and amended from time to time. It is intended to serve as a backup line for general corporate purposes. The increased volume will further strengthen Fresenius’ liquidity profile and increase the company’s financial flexibility.
A key component of the new credit facility is the link to sustainability: Emphasizing Fresenius’ commitment to embed sustainability in all aspects of its business, the credit facility’s margin will be adjusted up or down according to changes in Fresenius’ sustainability performance. This is Fresenius’ first sustainability-linked financial transaction, demonstrating the increasing importance of sustainable financing.
Rachel Empey, Chief Financial Officer of Fresenius, said: “Sustainability is deeply rooted in our thinking and actions, at all levels. That is why it is important to us to take sustainability into account in our financing strategy. At the same time, with this credit facility we have increased our financial flexibility and further optimized our financing structure. In this way we are supporting investments in future growth and securing the company’s long-term success.”
This release contains forward-looking statements that are subject to various risks and uncertainties. Future results could differ materially from those described in these forward-looking statements due to certain factors, e.g. changes in business, economic and competitive conditions, regulatory reforms, results of clinical trials, foreign exchange rate fluctuations, uncertainties in litigation or investigative proceedings, and the availability of financing. Fresenius does not undertake any responsibility to update the forward-looking statements in this release.
-

In his speech, Stephan Sturm said: "I have great confidence in our strategy. Our future continues to look good." Download Image (JPG 57 KB) -
![]()
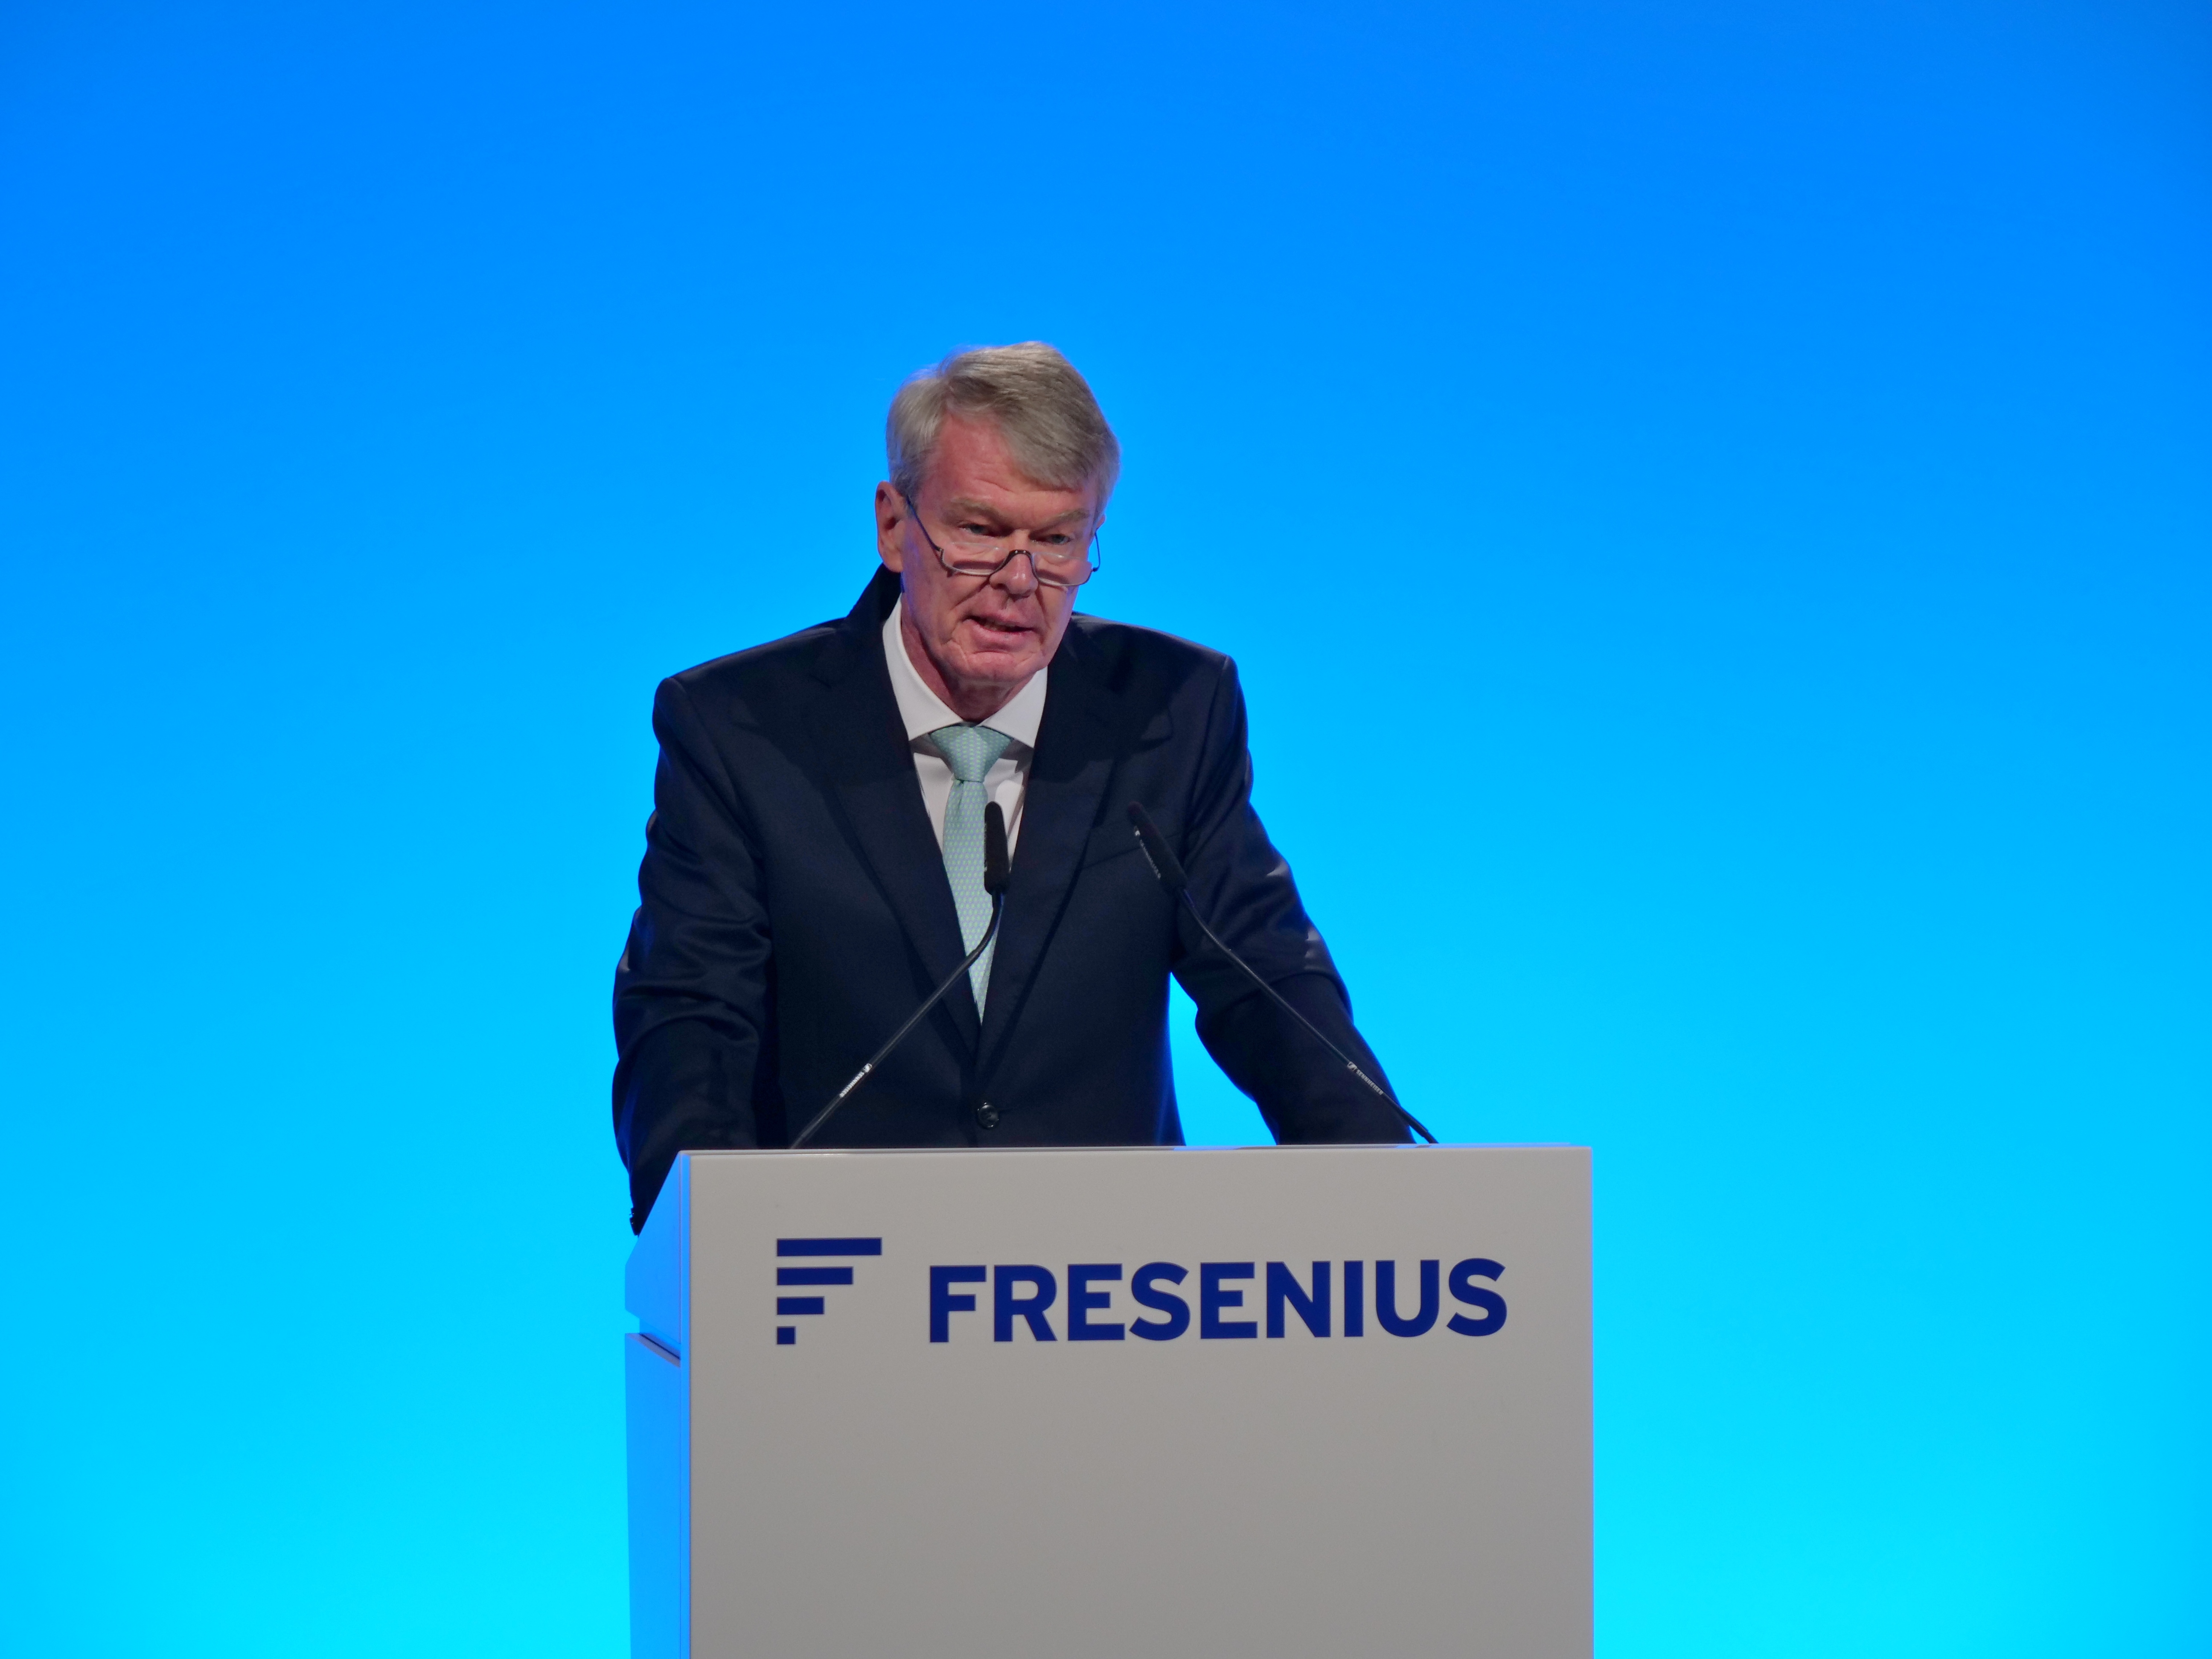
Sturm: "We will be needed. We will provide ever more people with ever better medicine. We will again grow dynamically in the coming years." Download Image (JPG 5.04 MB) -
![]()
The healthcare group Fresenius remains on course for growth despite continuing burdens caused by the COVID-19 pandemic. Download Image (JPG 255 KB) -
![]()
Sturm: "We launched initiatives to become more efficient and profitable, and we have set down a plan for accelerated growth through 2023.” Download Image (JPG 229 KB) -
![]()
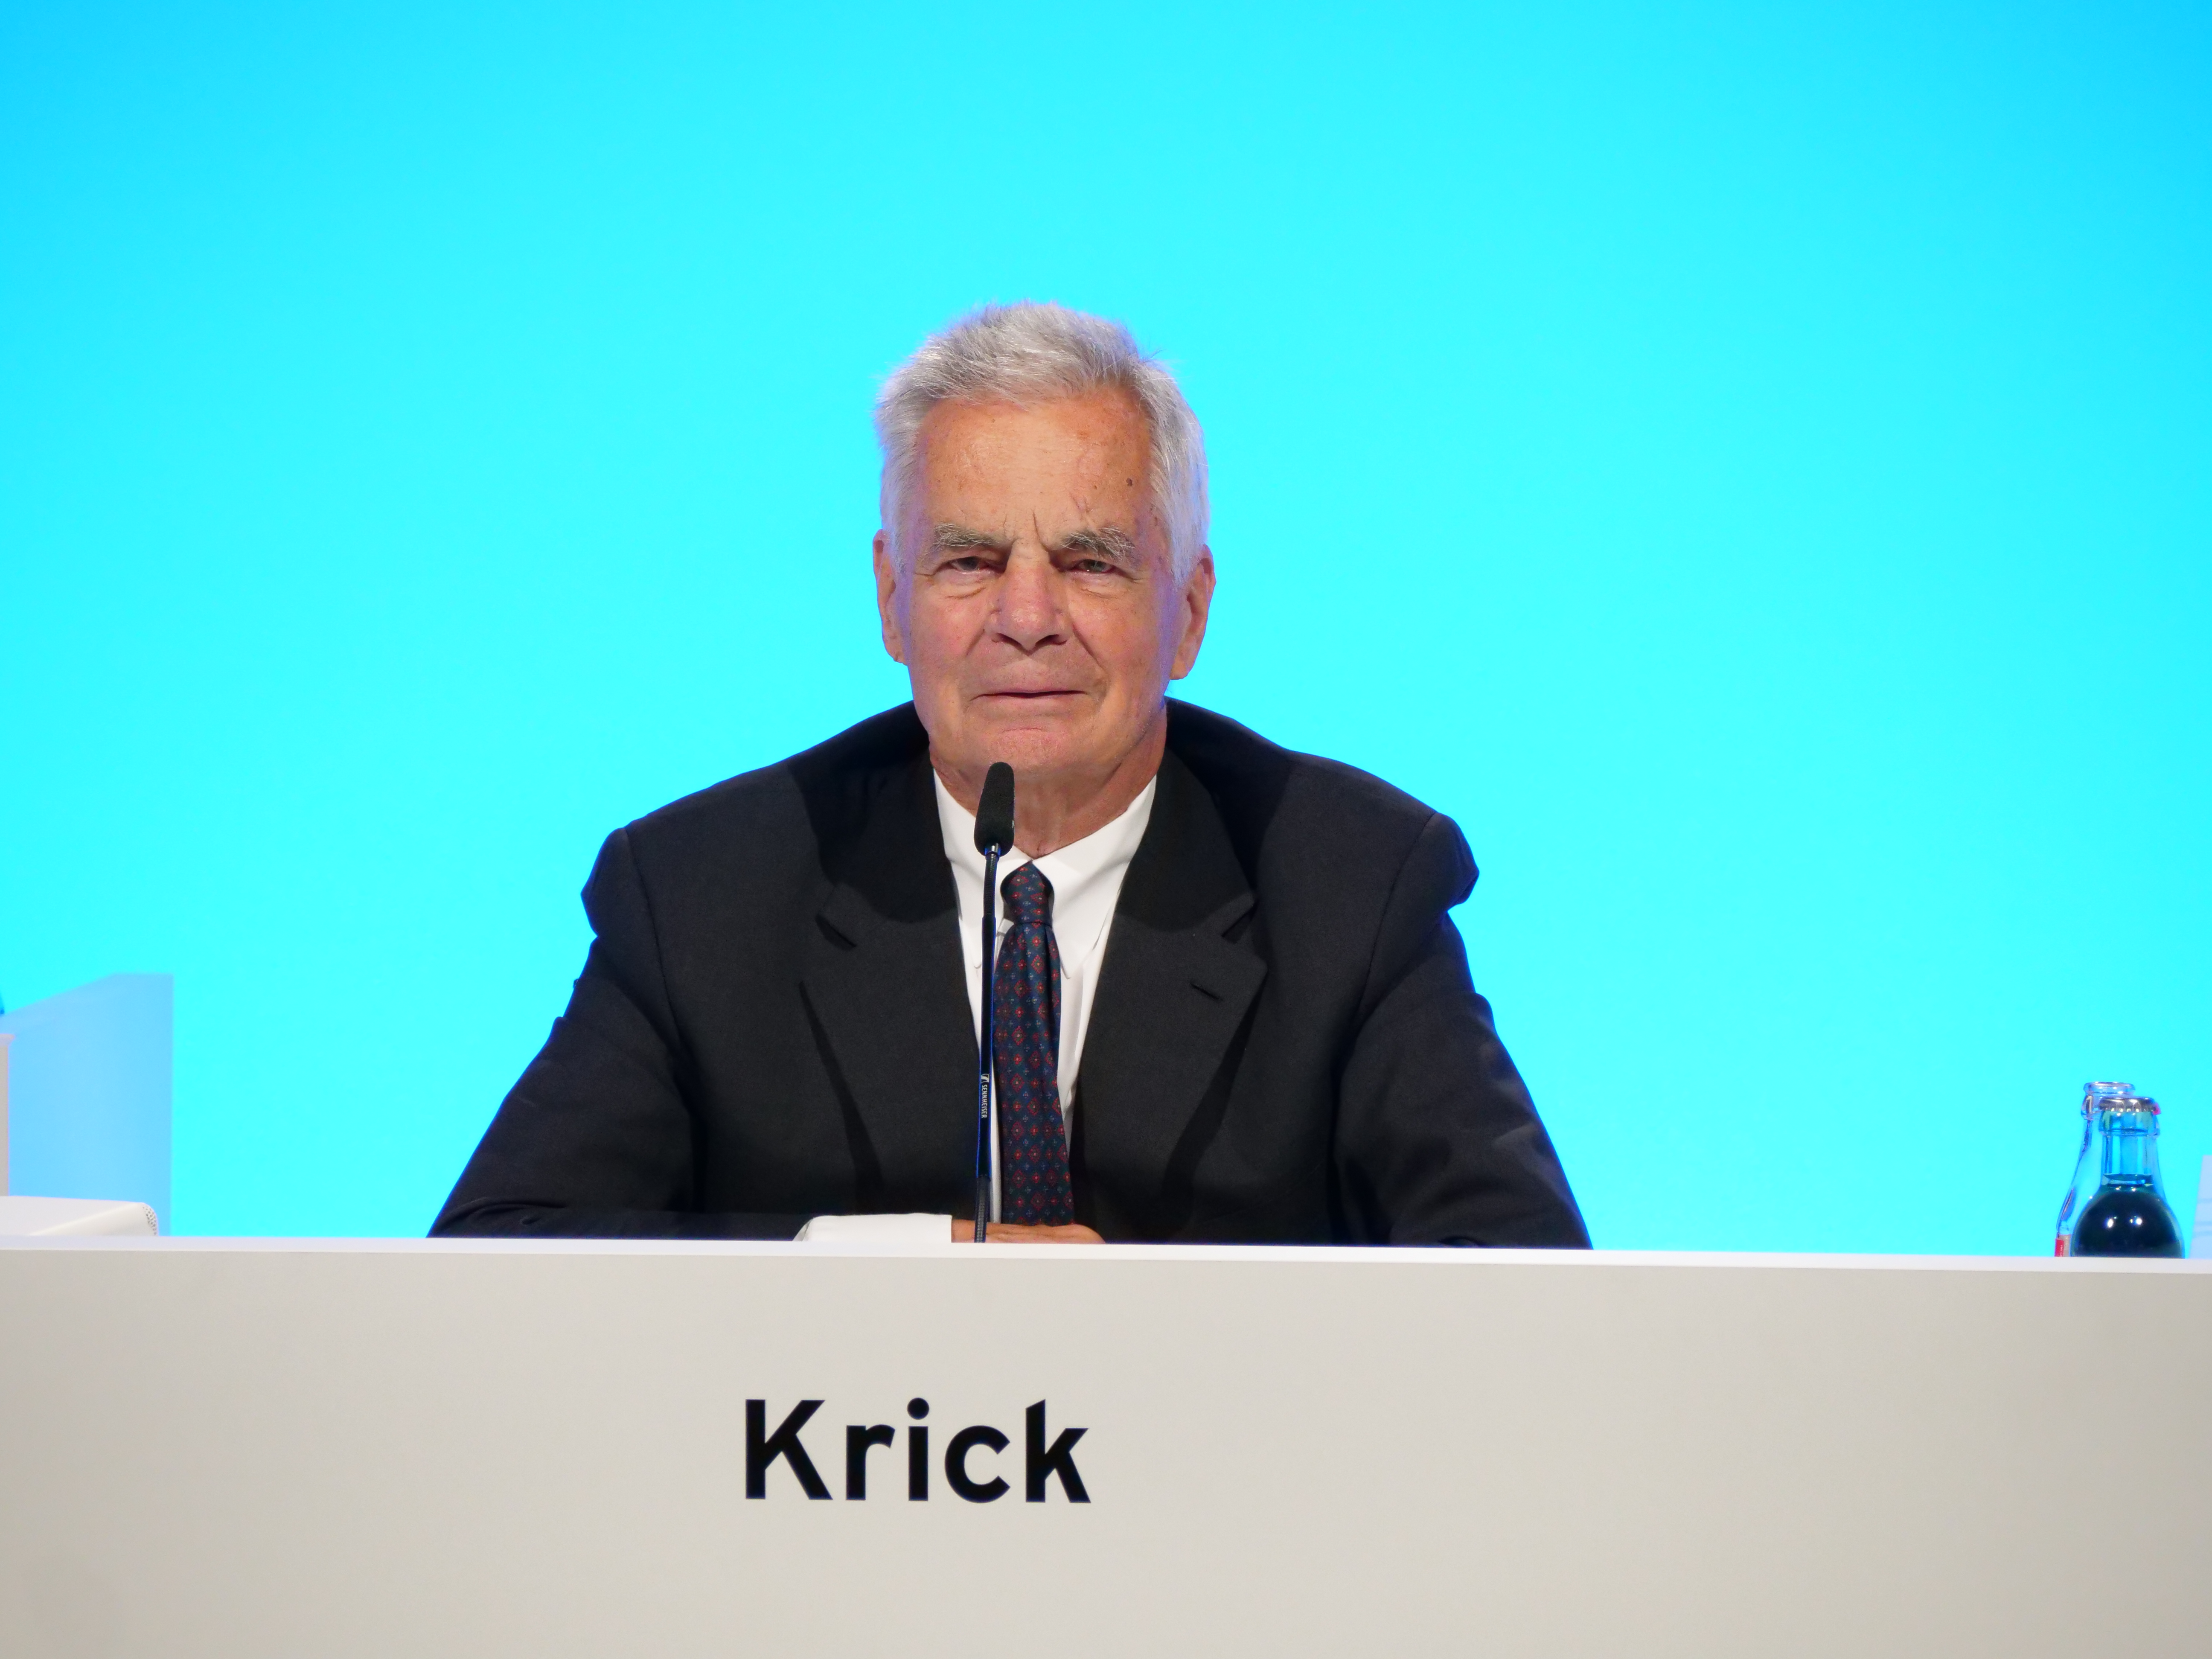
Today’s Annual General Meeting was the last one presided over by Dr. Gerd Krick, the long-serving Chairman of the Supervisory Board. Download Image (JPG 4.69 MB) -
![]()
Krick’s successor is the former CEO of DZ Bank, Wolfgang Kirsch, who became a member of the Supervisory Board of Fresenius Management SE on January 1, 2020. Download Image (JPG 3.44 MB) -
![]()
Due to the pandemic, the meeting was held exclusively over the Internet in order to protect the health of all participants. Download Image (JPG 5.02 MB)
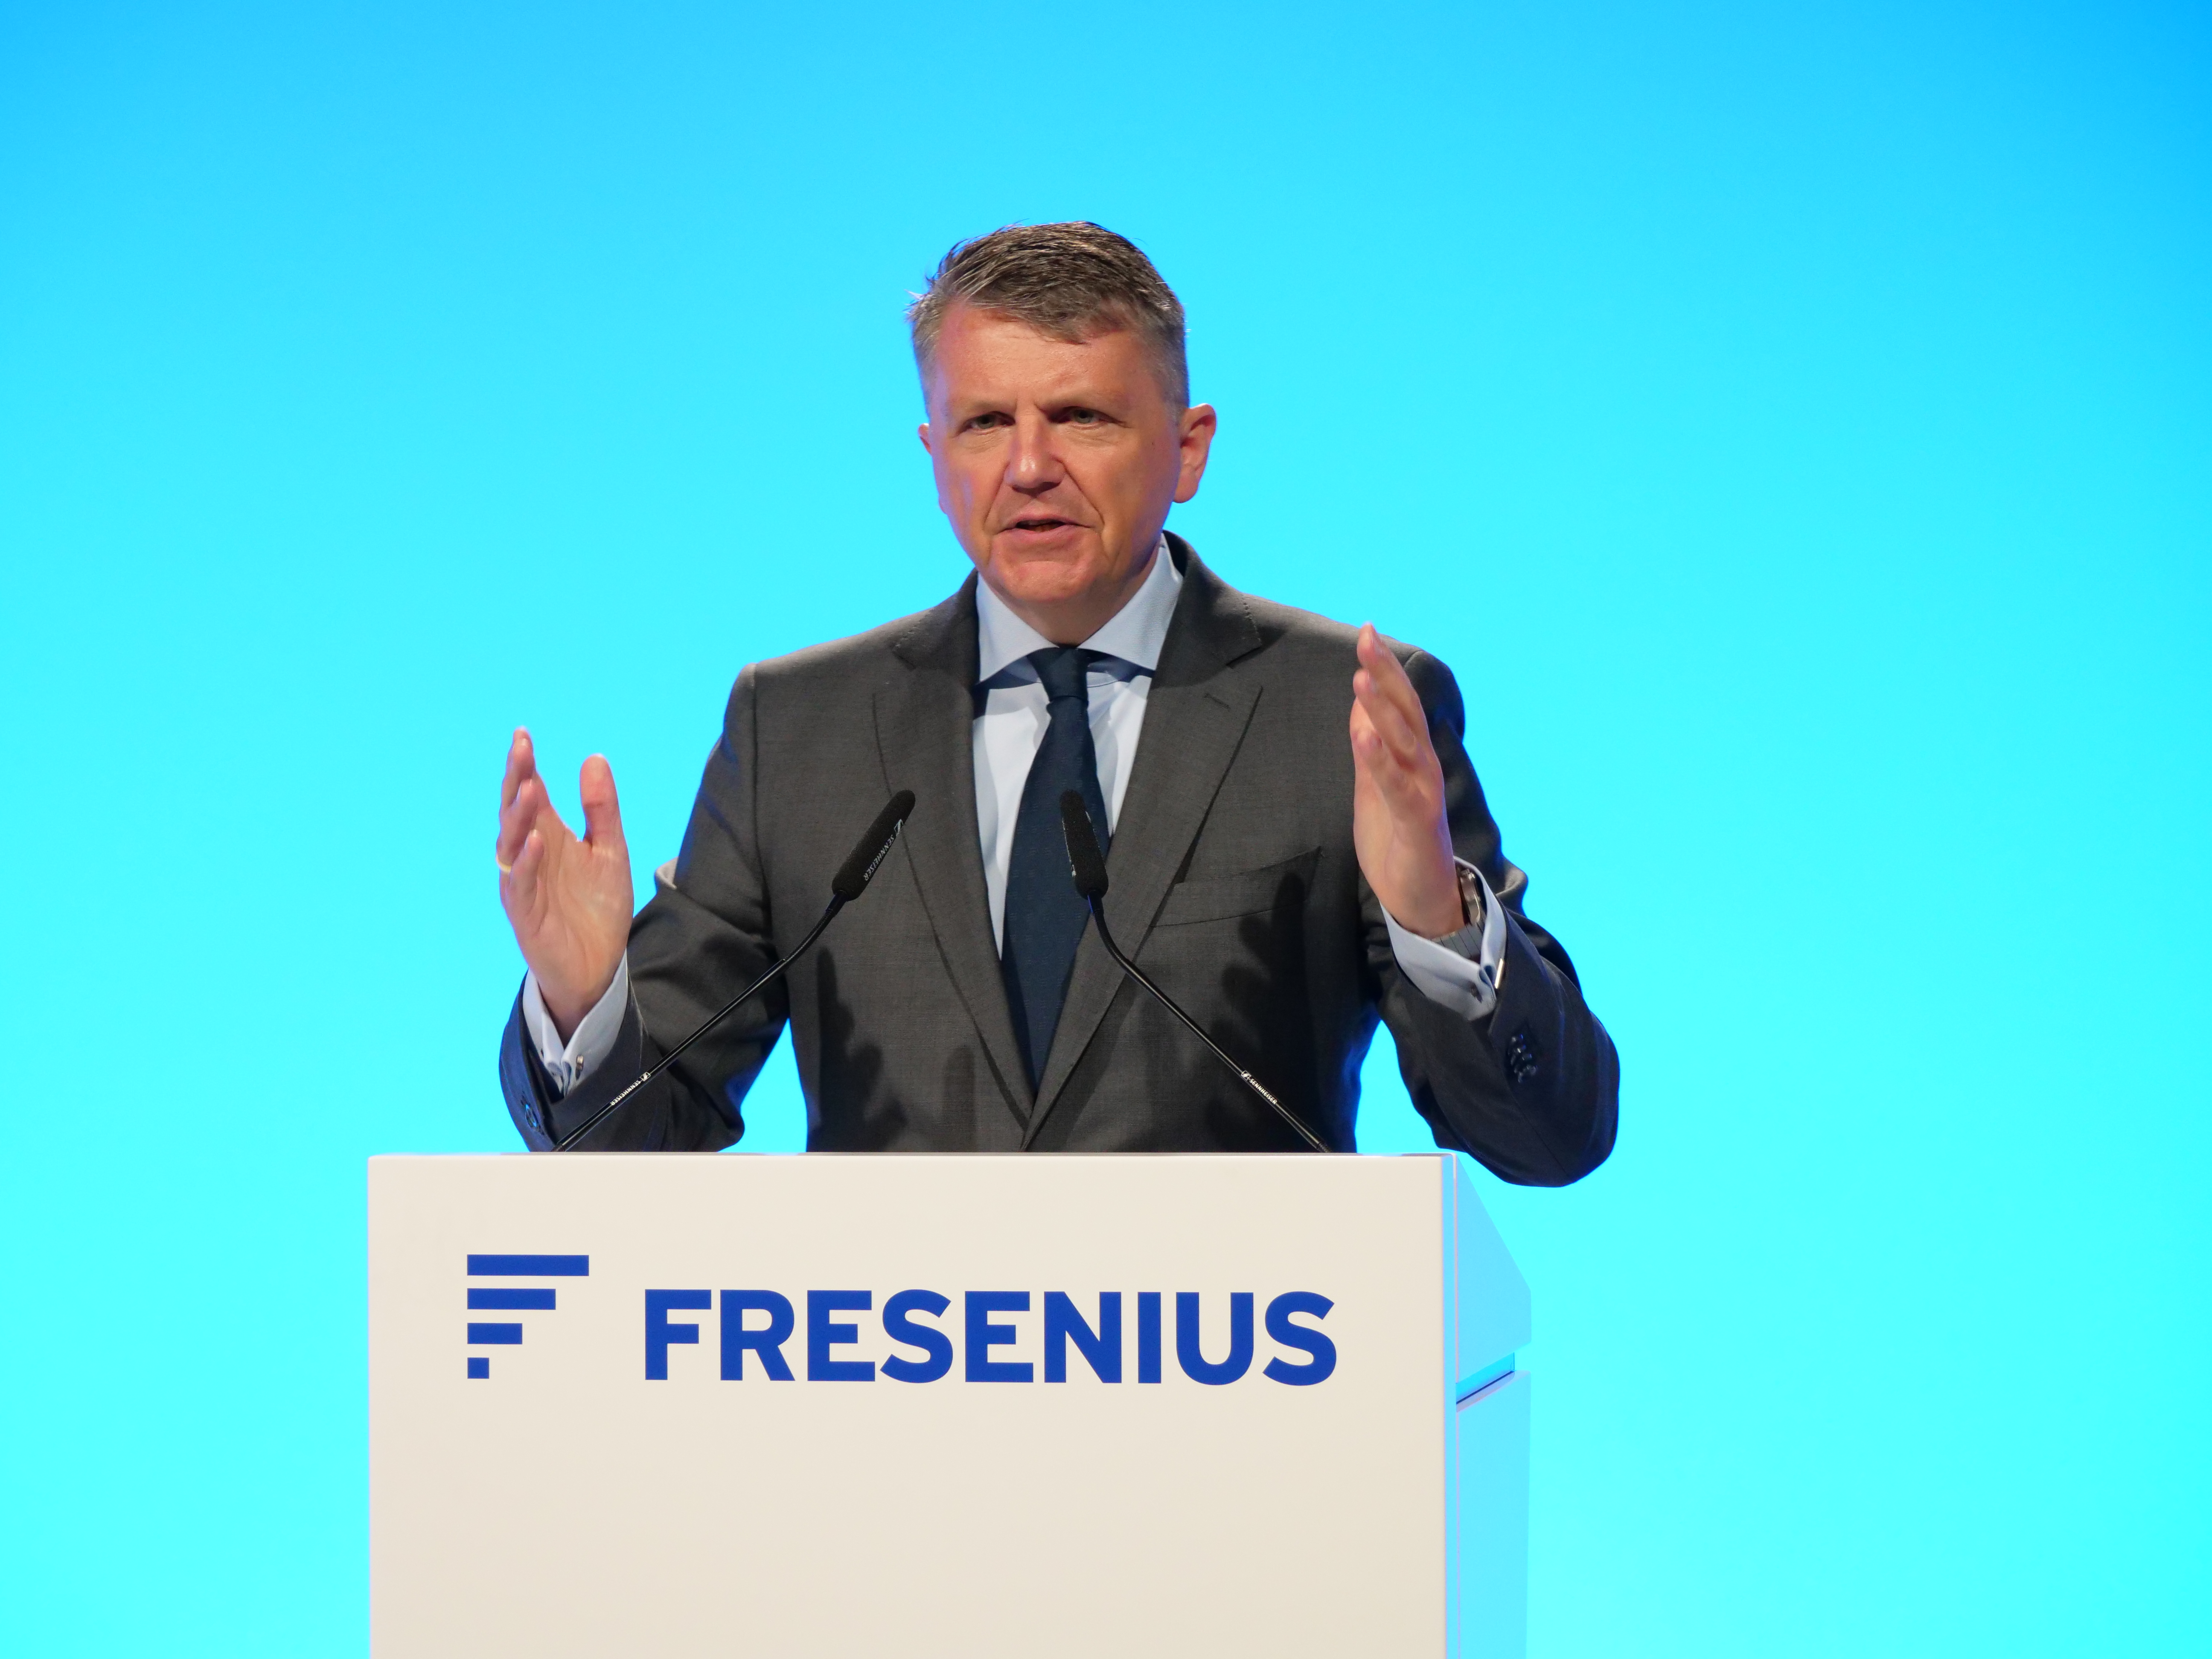


The healthcare group Fresenius remains on course for growth despite continuing burdens caused by the COVID-19 pandemic. This was confirmed by Stephan Sturm, CEO of Fresenius, at today’s Annual General Meeting: “We have a challenging year behind us, and the challenges persist,” Sturm said in his speech. “Although the coronavirus burdened our business, we still performed well for the year and reached our targets. We launched initiatives to become more efficient and profitable, and we have set down a plan for accelerated growth through 2023.”
The measures are targeted to result in cost savings of at least €100 million annually after tax and minority interest in 2023, with some further potential to increase thereafter. Sturm said: “I have great confidence in our strategy. Our future continues to look good. We will be needed. We will provide ever more people with ever better medicine. We will again grow dynamically in the coming years. And by doing this we will make Fresenius even more valuable.”
Today’s Annual General Meeting was the last one presided over by Dr. Gerd Krick, the long-serving Chairman of the Supervisory Board. He announced in October that, after 46 years in the service of Fresenius, he would not seek re-election to the Supervisory Board. Michael Diekmann, Deputy Chairman of the Supervisory Board, praised Krick’s key role in the successful development of Fresenius as a Member of the Management Board, CEO and then Chairman of the Supervisory Board.
“You shaped and influenced Fresenius like no one else, and Fresenius owes you thanks,” said Diekmann. “There are not many entrepreneurs who can built a medium-sized enterprise into a global company, active around the world. But you succeeded in doing just that. Along with vision and strategic foresight, that required iron discipline, passion and the courage to take big decisions and then consistently implement them.”
Krick’s successor is the former CEO of DZ Bank, Wolfgang Kirsch, who became a member of the Supervisory Board of Fresenius Management SE on January 1, 2020. The shareholders elected Kirsch as a new member of the Supervisory Board of Fresenius SE & Co. KGaA with a 98.52 percent majority. In its constituent meeting immediately following the Annual General Meeting, the new Supervisory Board elected him as Chairman and appointed Dr. Gerd Krick as Honorary Chairman. The five additional shareholder representatives were all re-elected to another term.
Shareholders approved with a large majority of 99.61 percent the 28th consecutive dividend increase proposed by the General Partner and the Supervisory Board. The dividend was raised by 5 percent, to €0.88 per share.
Also with a large majority, of 92.23 percent, shareholders passed a new compensation system for the Management Board. In addition to key financial indicators, it will take into account sustainability targets relating to environmental, social and governance aspects.
Shareholder majorities of 99.28 and 91.34 percent, respectively, approved the actions of the Management and Supervisory Boards in 2020.
At the Annual General Meeting of Fresenius SE & Co. KGaA, 72.76 percent of the subscribed capital was represented. Due to the pandemic, the meeting was held exclusively over the Internet in order to protect the health of all participants.
This release contains forward-looking statements that are subject to various risks and uncertainties. Future results could differ materially from those described in these forward-looking statements due to certain factors, e.g. changes in business, economic and competitive conditions, regulatory reforms, results of clinical trials, foreign exchange rate fluctuations, uncertainties in litigation or investigative proceedings, and the availability of financing. Fresenius does not undertake any responsibility to update the forward-looking statements in this release.
-
Spain is leading the way when it comes to digitalization. This finding comes from a representative poll in Germany, Spain and the U.S. by the polling organization Allensbach Institut for Demoskopie. Download Image (PNG 174 KB) -
![]()
While 22 percent of Americans have used the option of a video consultation, the corresponding figure for Germans is only 2 percent. Download Image (PNG 129 KB) -
![]()
There are major differences even in the simplest digital offerings in the medical field, such as online appointment booking. Download Image (PNG 172 KB) -
![]()
There is also broad agreement among respondents in all three countries that the coronavirus crisis is accelerating the digitalization process in medicine. Download Image (PNG 129 KB) -
![]()
The respondents in all three countries agreed that digitalization is, on balance, an opportunity for medicine. Download Image (PNG 131 KB) -
![]()
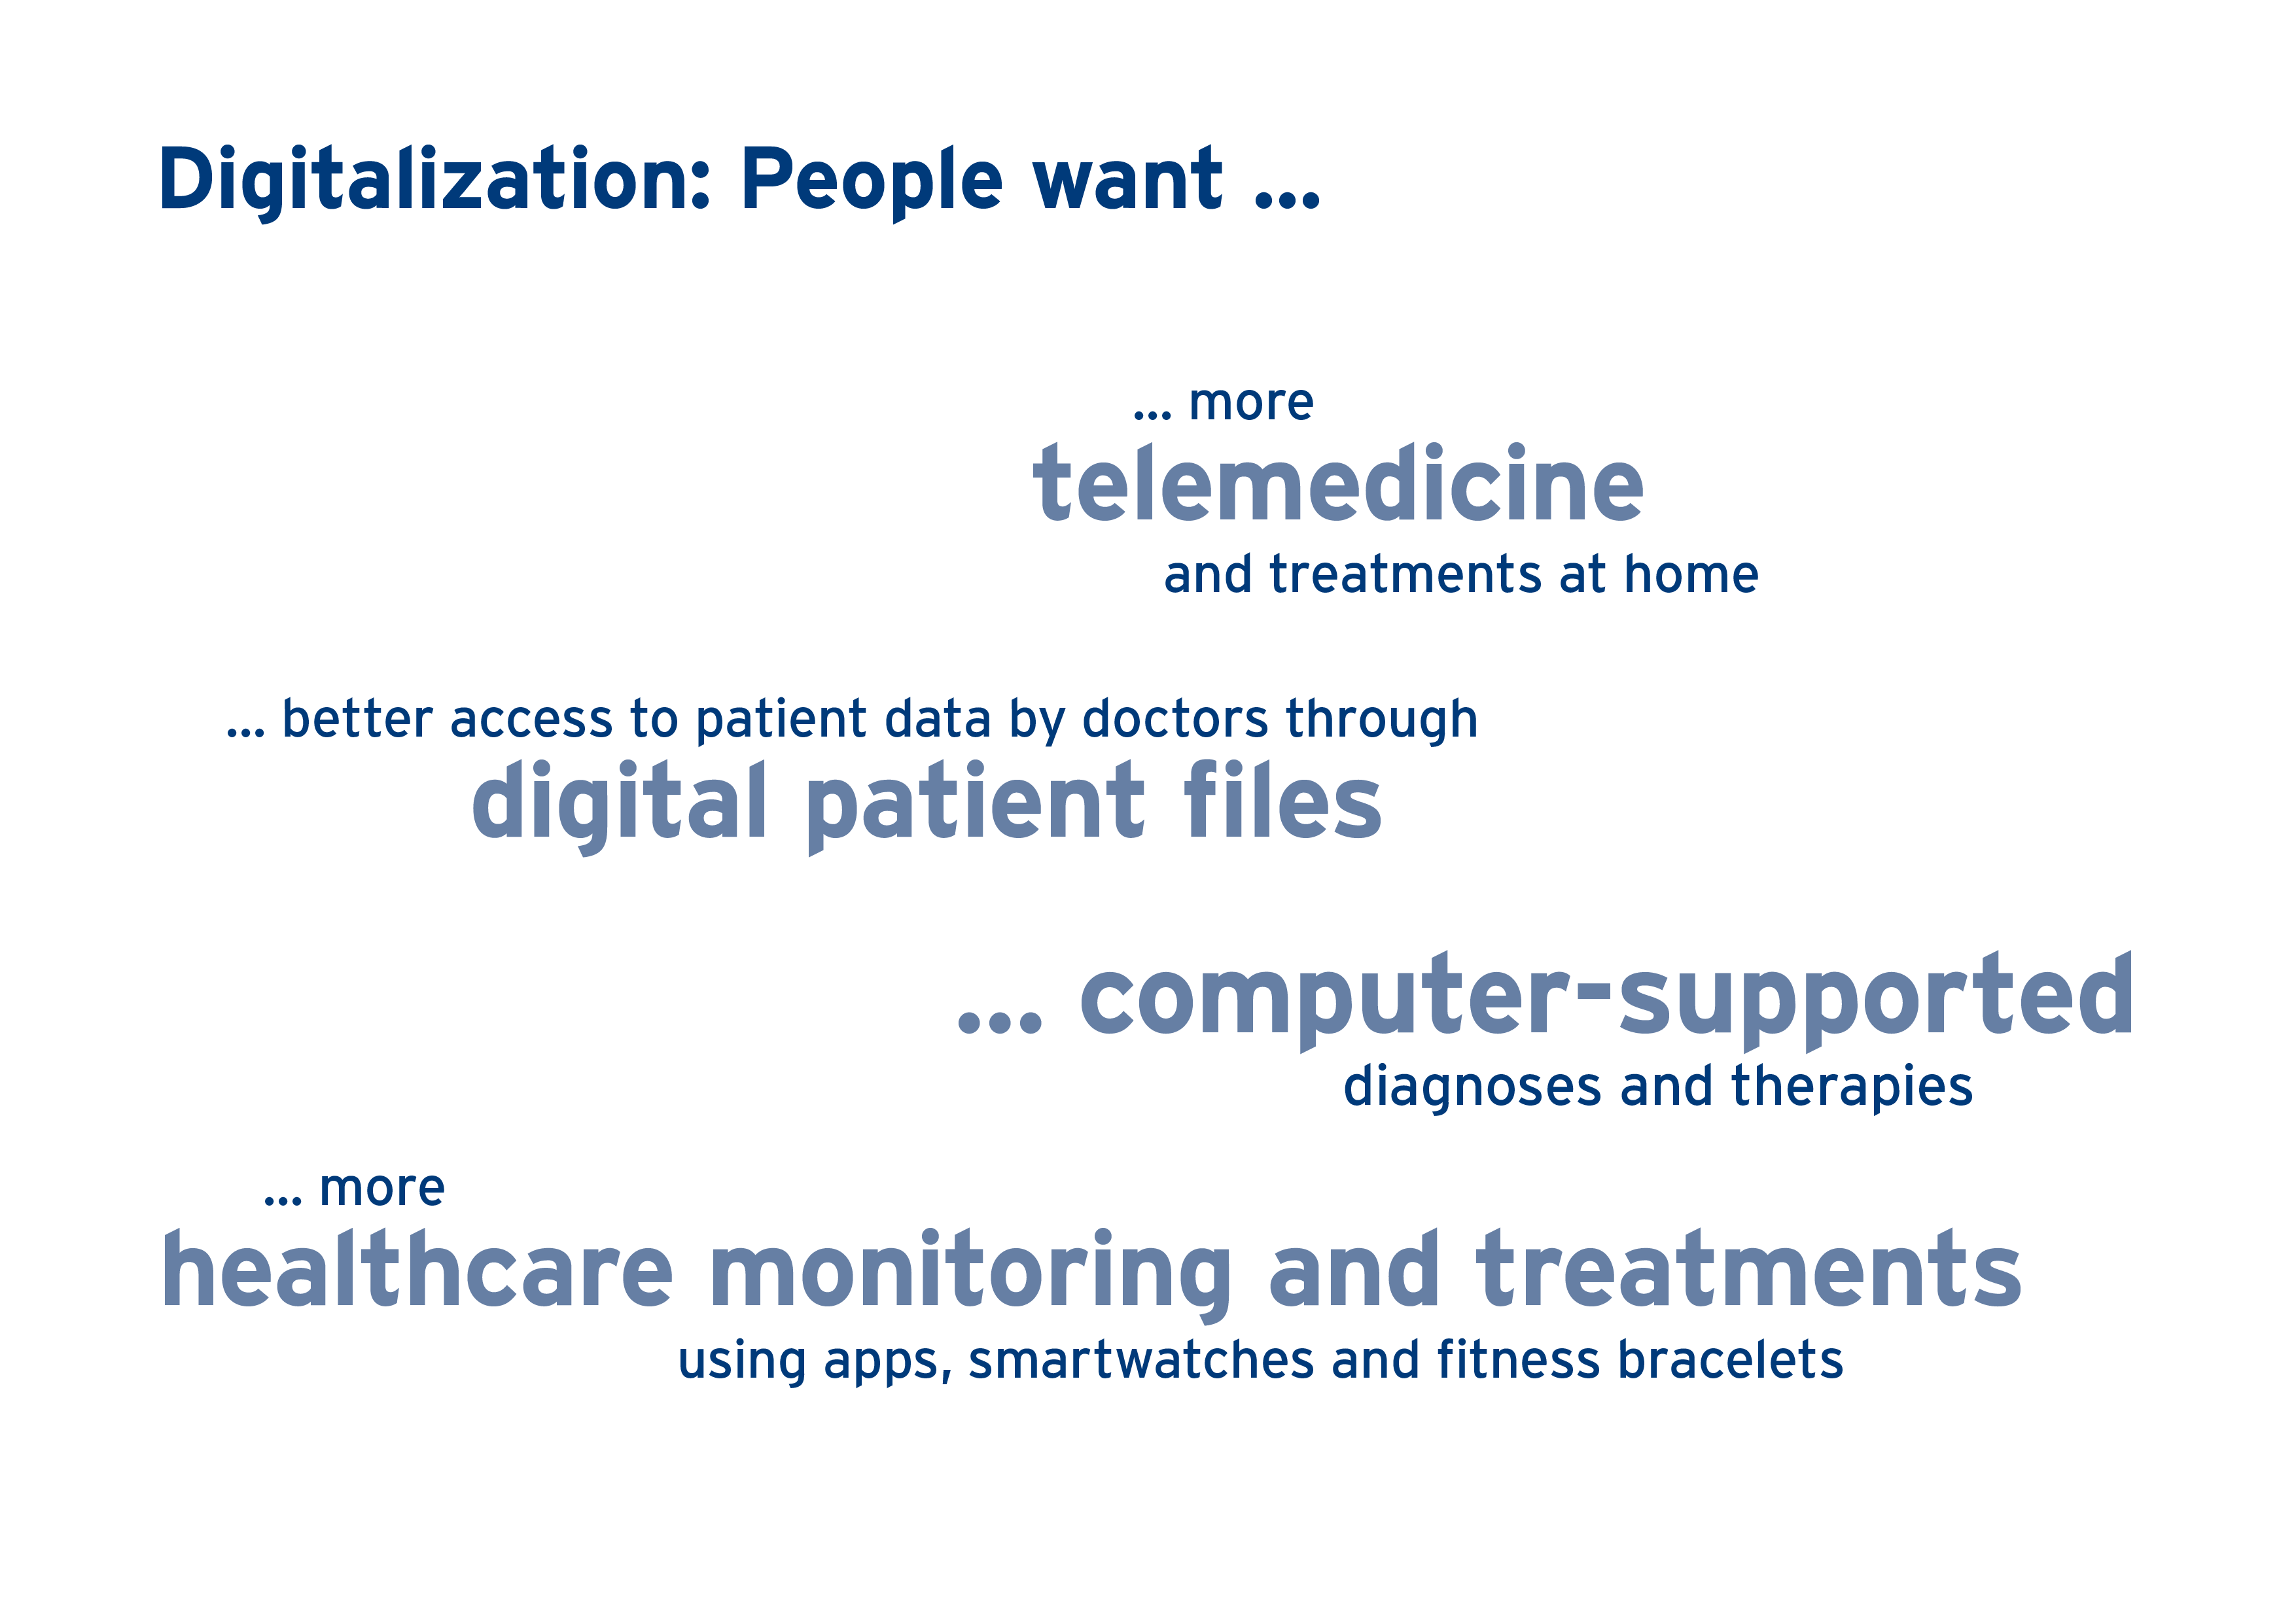
Digitalization as a great opportunity: People want telemedicine, networking between their doctors and better diagnostics. Download Image (PNG 131 KB)
- Major differences in levels of development: Spain leading the way
- Digitalization as a great opportunity: People want telemedicine, networking between their doctors and better diagnostics
- Fresenius active in digitalization: initiatives in all business segments
Germany still lags far behind other countries in the digitalization of medicine, with Spain in particular but also the United States significantly ahead in several areas. This finding comes from a representative poll conducted for Fresenius in Germany, Spain and the U.S. by the polling organization Allensbach Institut für Demoskopie. The poll also found that Germans are increasingly interested in digital services such as telemedicine.
The respondents in all three countries agreed that digitalization is, on balance, an opportunity for medicine. There is also cross-national agreement that the pandemic is acting as an accelerator of digitalization in the healthcare sector.
"People increasingly understand that digitalization brings great benefits to healthcare," said Stephan Sturm, CEO of Fresenius. "This is good news, because the success of digital applications depends to a large extent on their acceptance. For Fresenius, digital healthcare is a key growth area and part of our strategy for the coming years. Digitalization offers great potential to provide our patients with even better care, and more efficiently than ever before. High medical quality that is affordable – this is and remains the basis of our success."
Germany lags in digitalization, with Spain far ahead
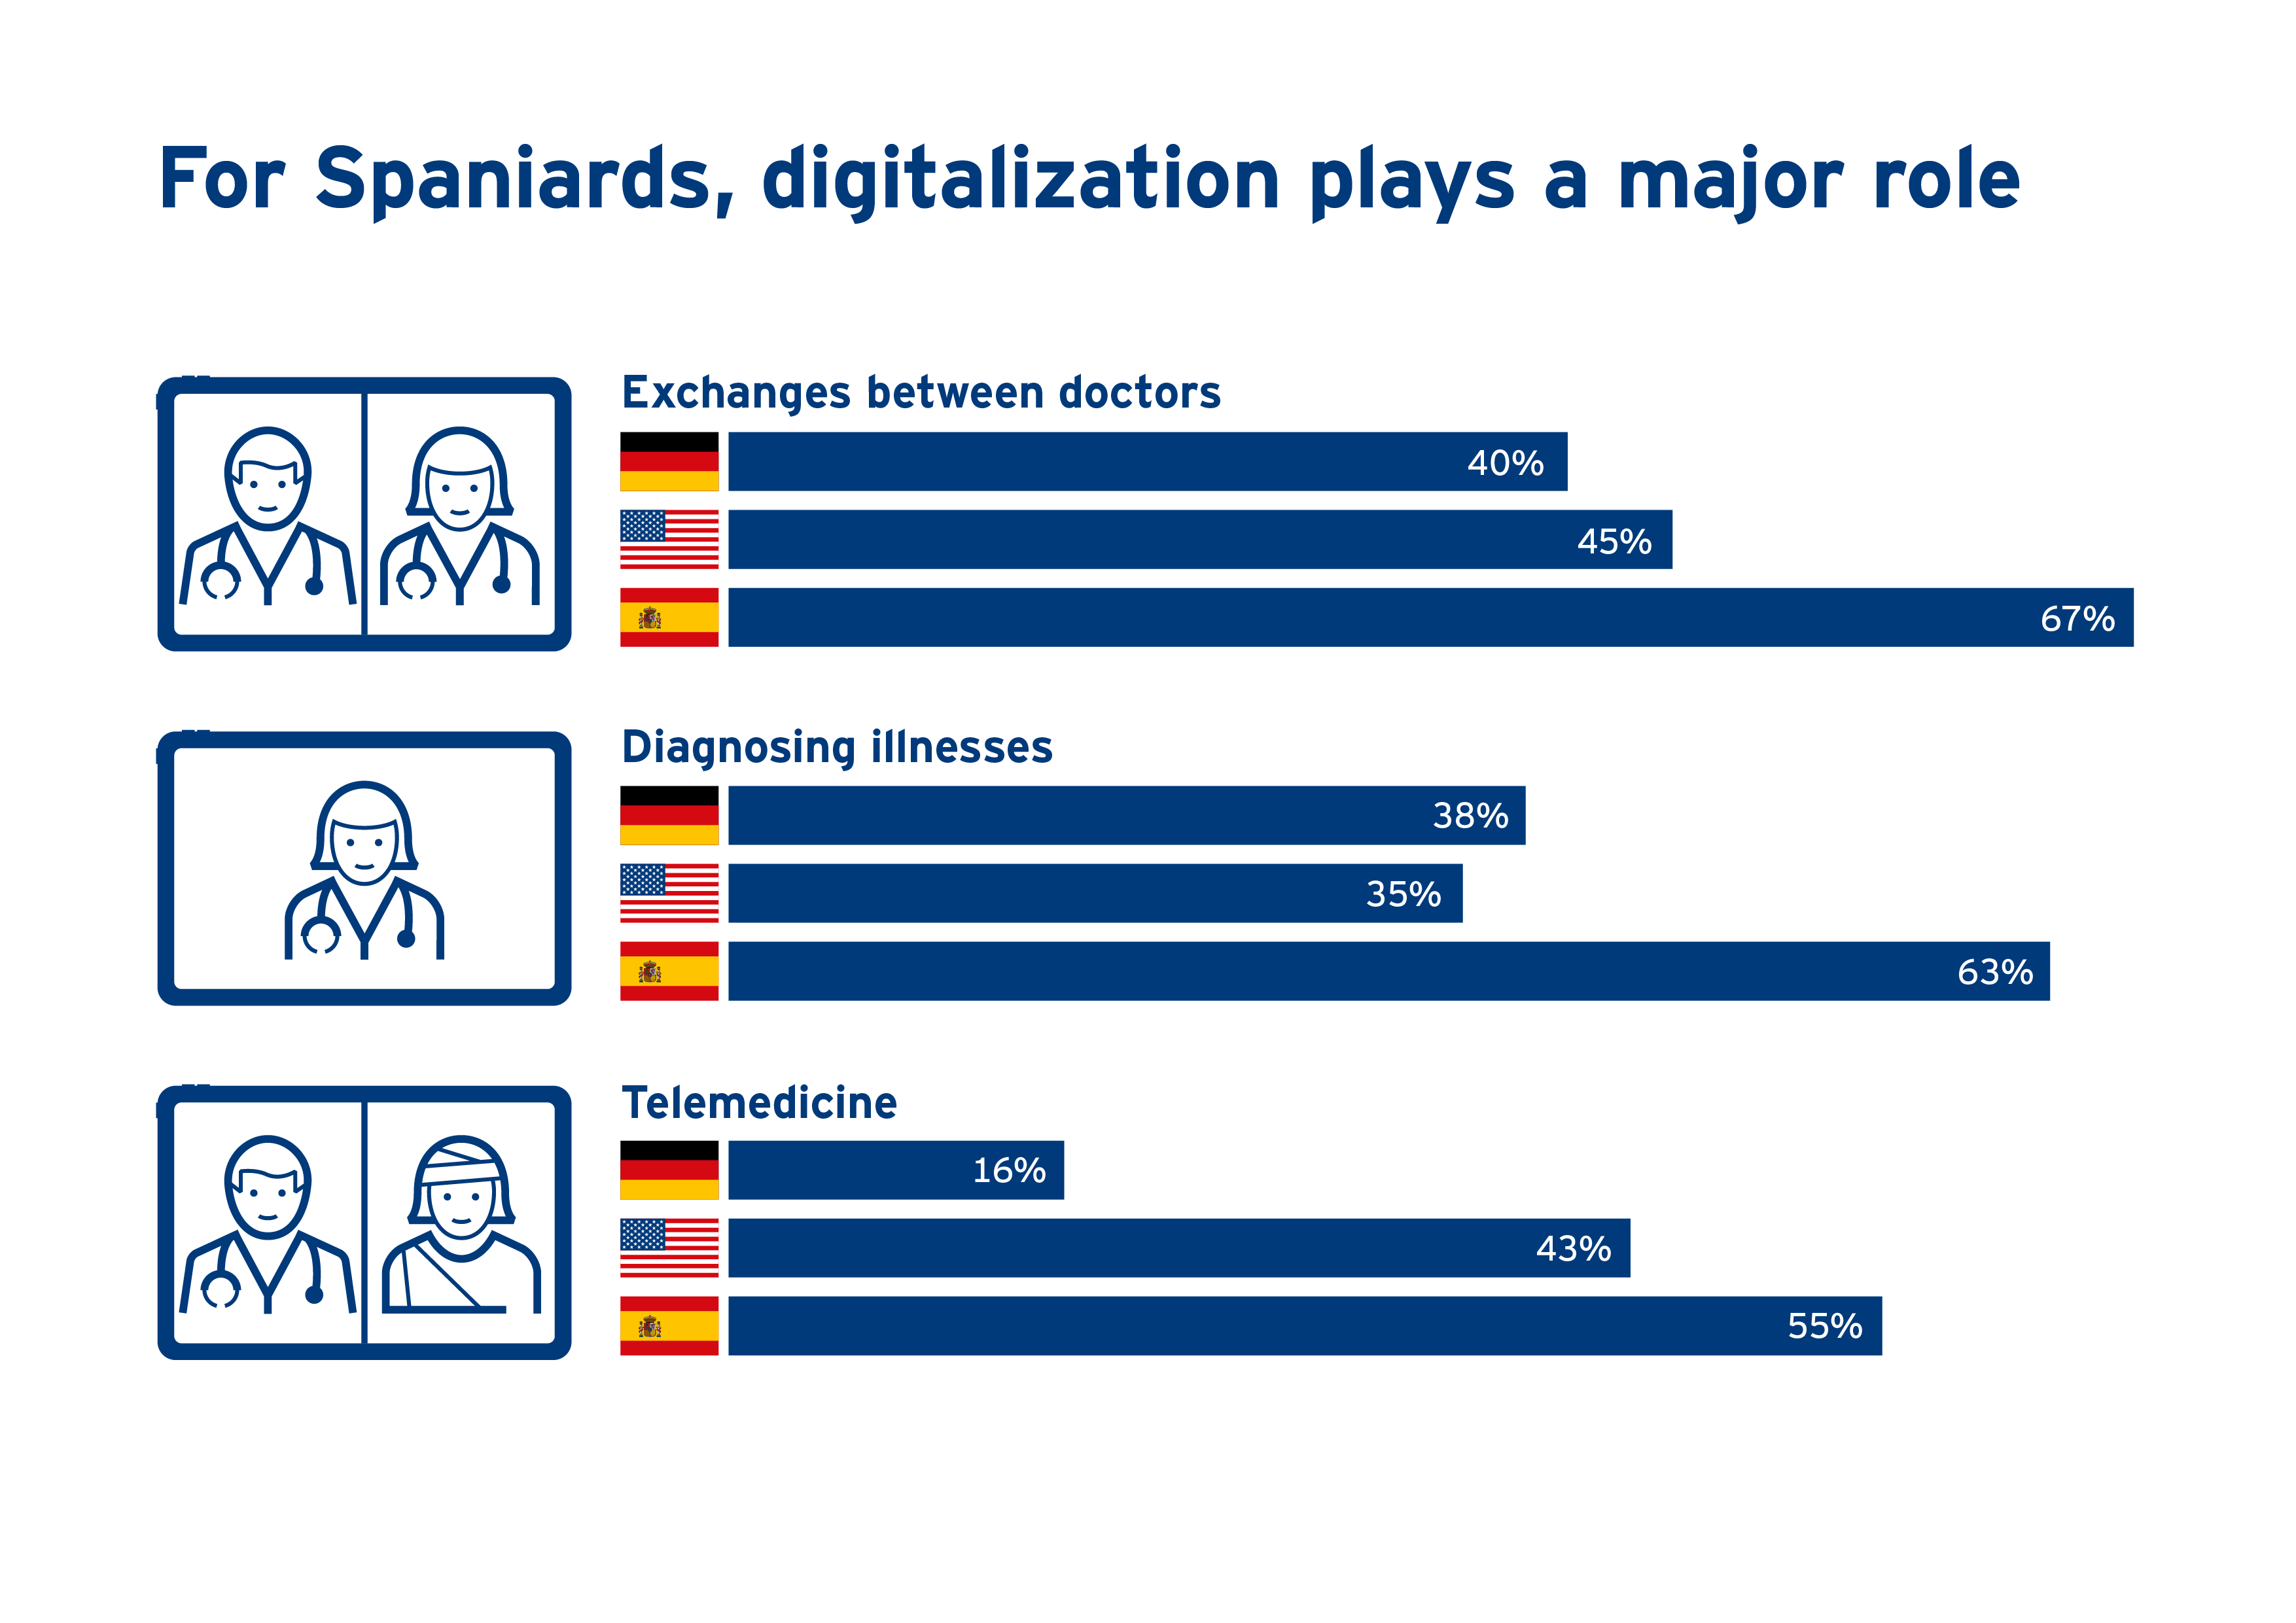
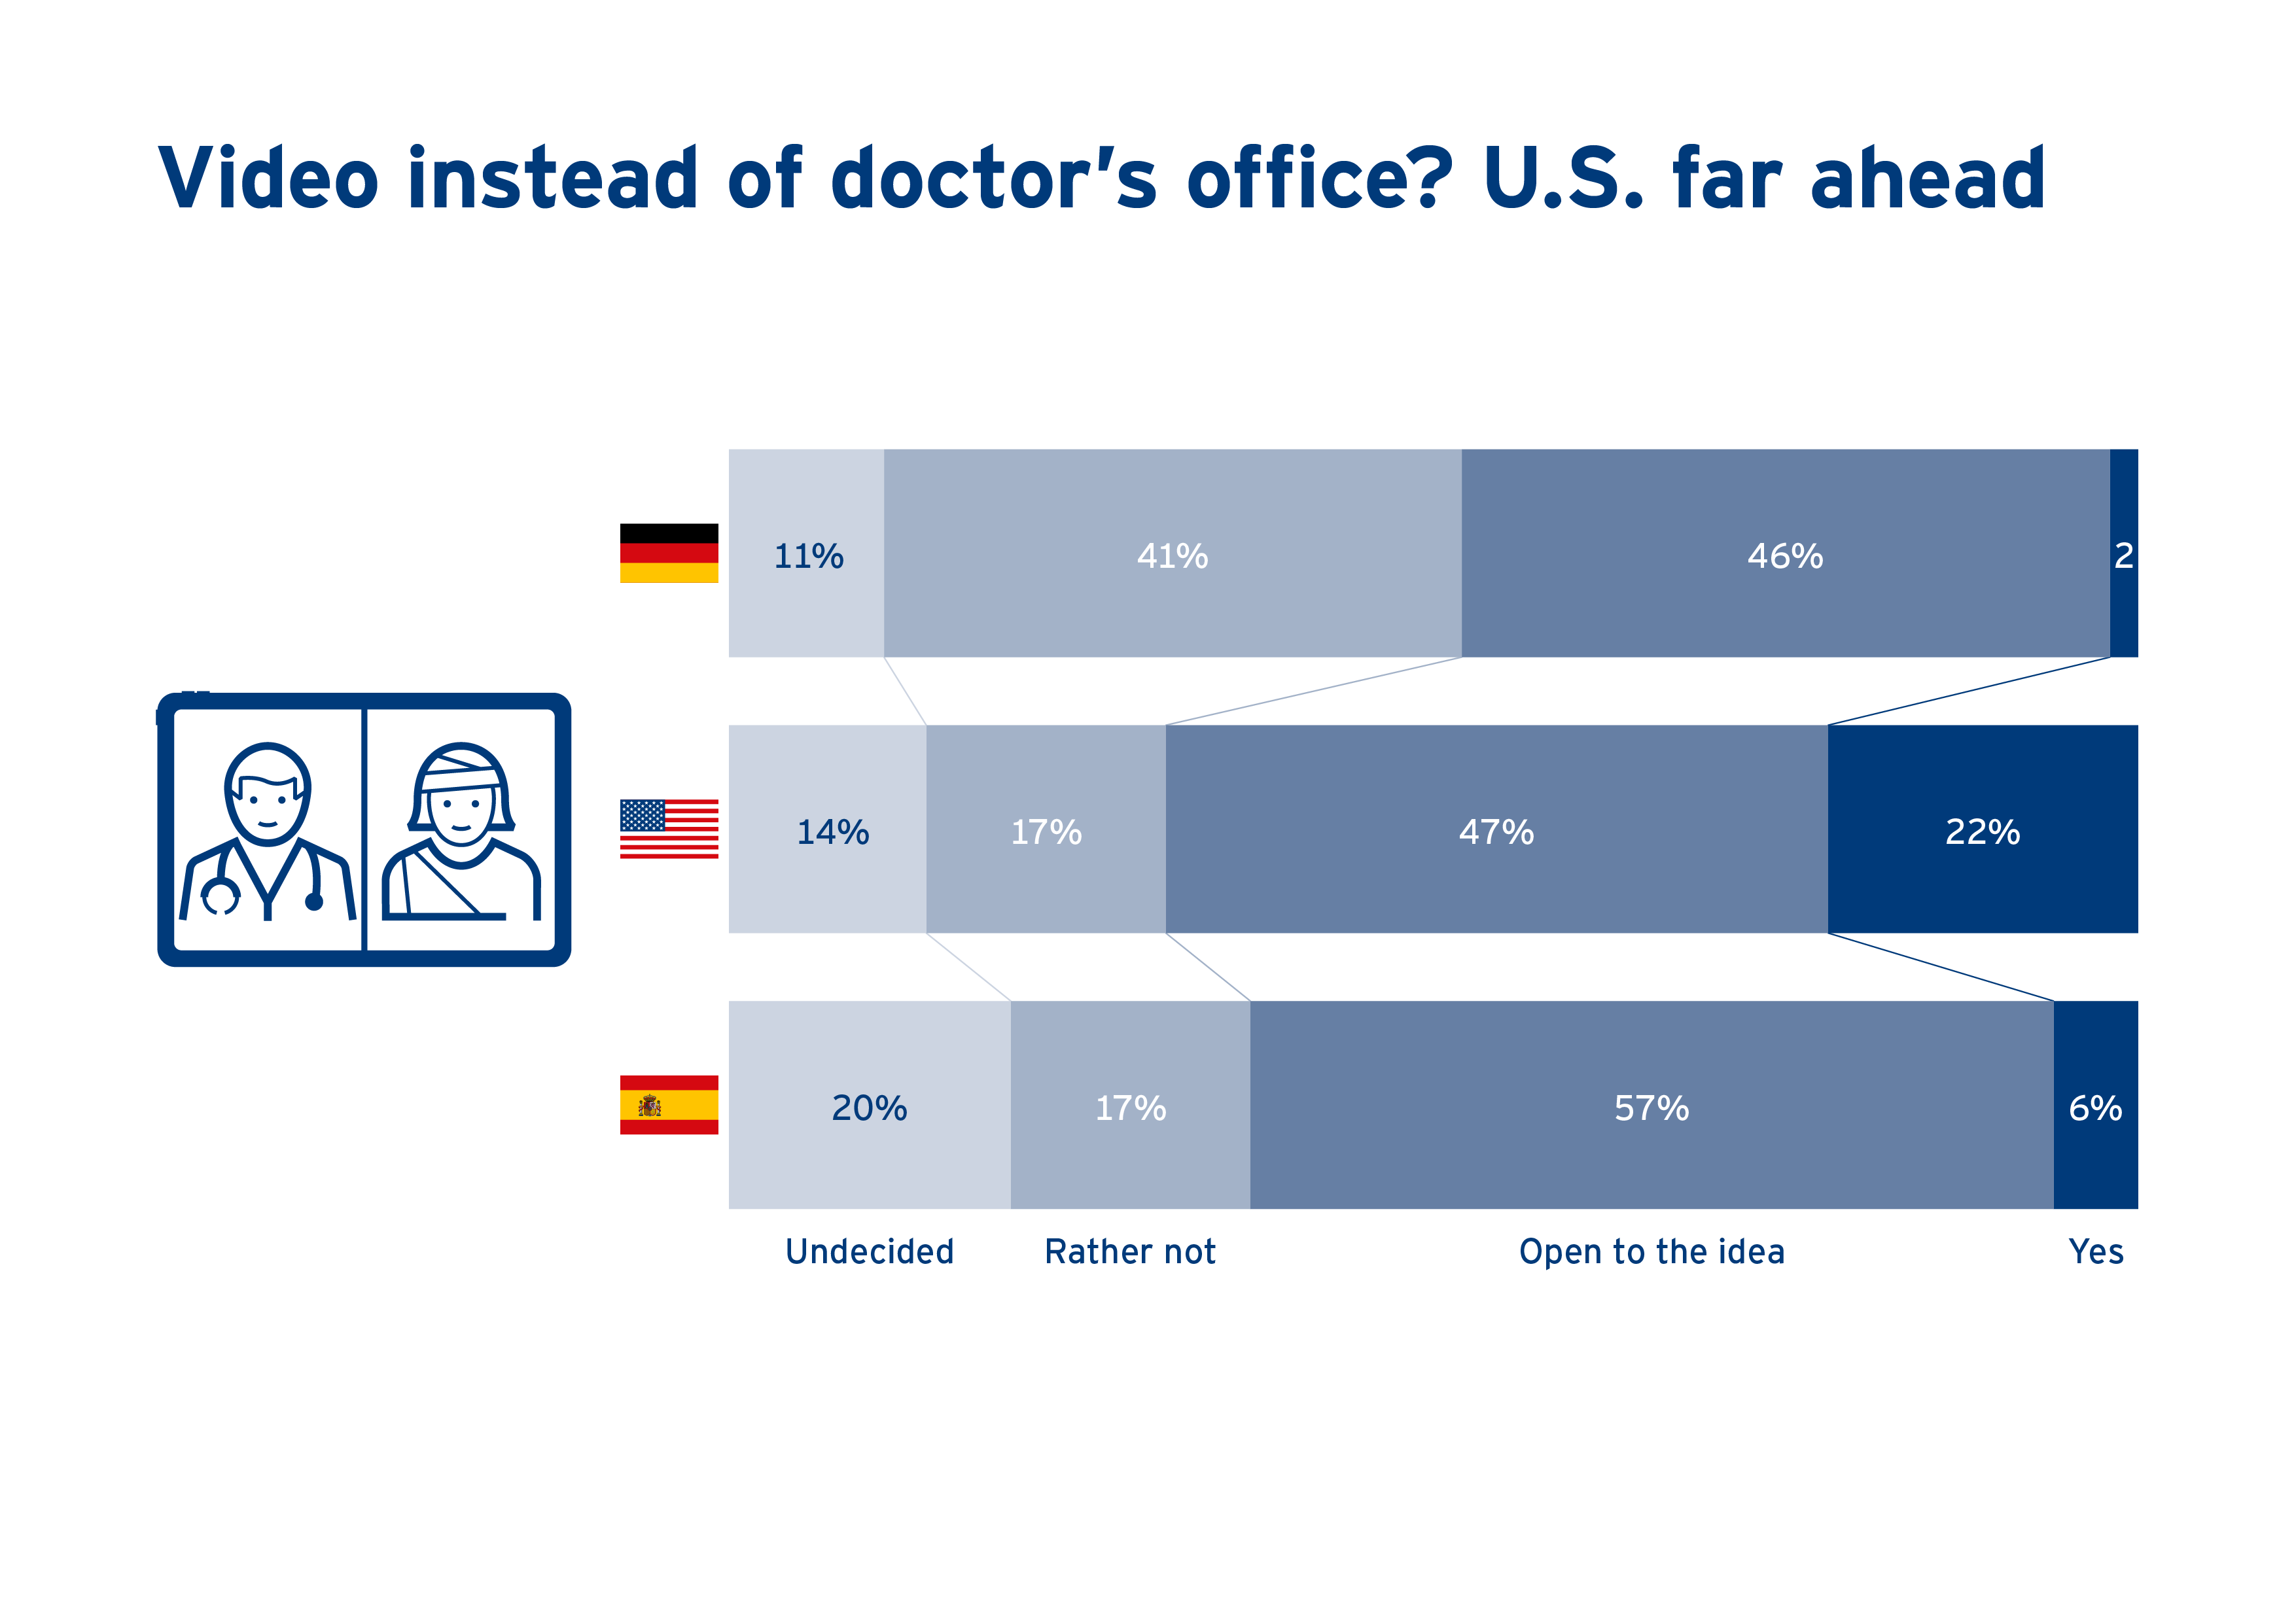
Spain is leading the way when it comes to digitalization. Well over half of Spanish respondents said the digitalization of medicine is already playing a major role in the networking of healthcare facilities, diagnosing illnesses and telemedicine. This is most apparent in telemedicine, where patients come into very direct contact with digitalization: 55 percent of Spaniards and 43 percent of Americans, but only 16 percent of Germans, consider telemedicine highly important.
This is also reflected in usage: While 22 percent of Americans have used the option of a video consultation, the corresponding figure for Germans is only 2 percent. And although 46 percent of the population in Germany would agree in principle to consult a doctor via video, Spaniards (57 percent) and Americans (47 percent) are even more open to the idea.
Although interest in telemedicine is also growing in Germany, age is an important factor in attitudes: While two-thirds of people under 30 and half of those in the 30-to-44 age group could imagine a virtual doctor's visit, only one-third of over-60s could; for more than half of people 60 or older, a video consultation would be out of the question.
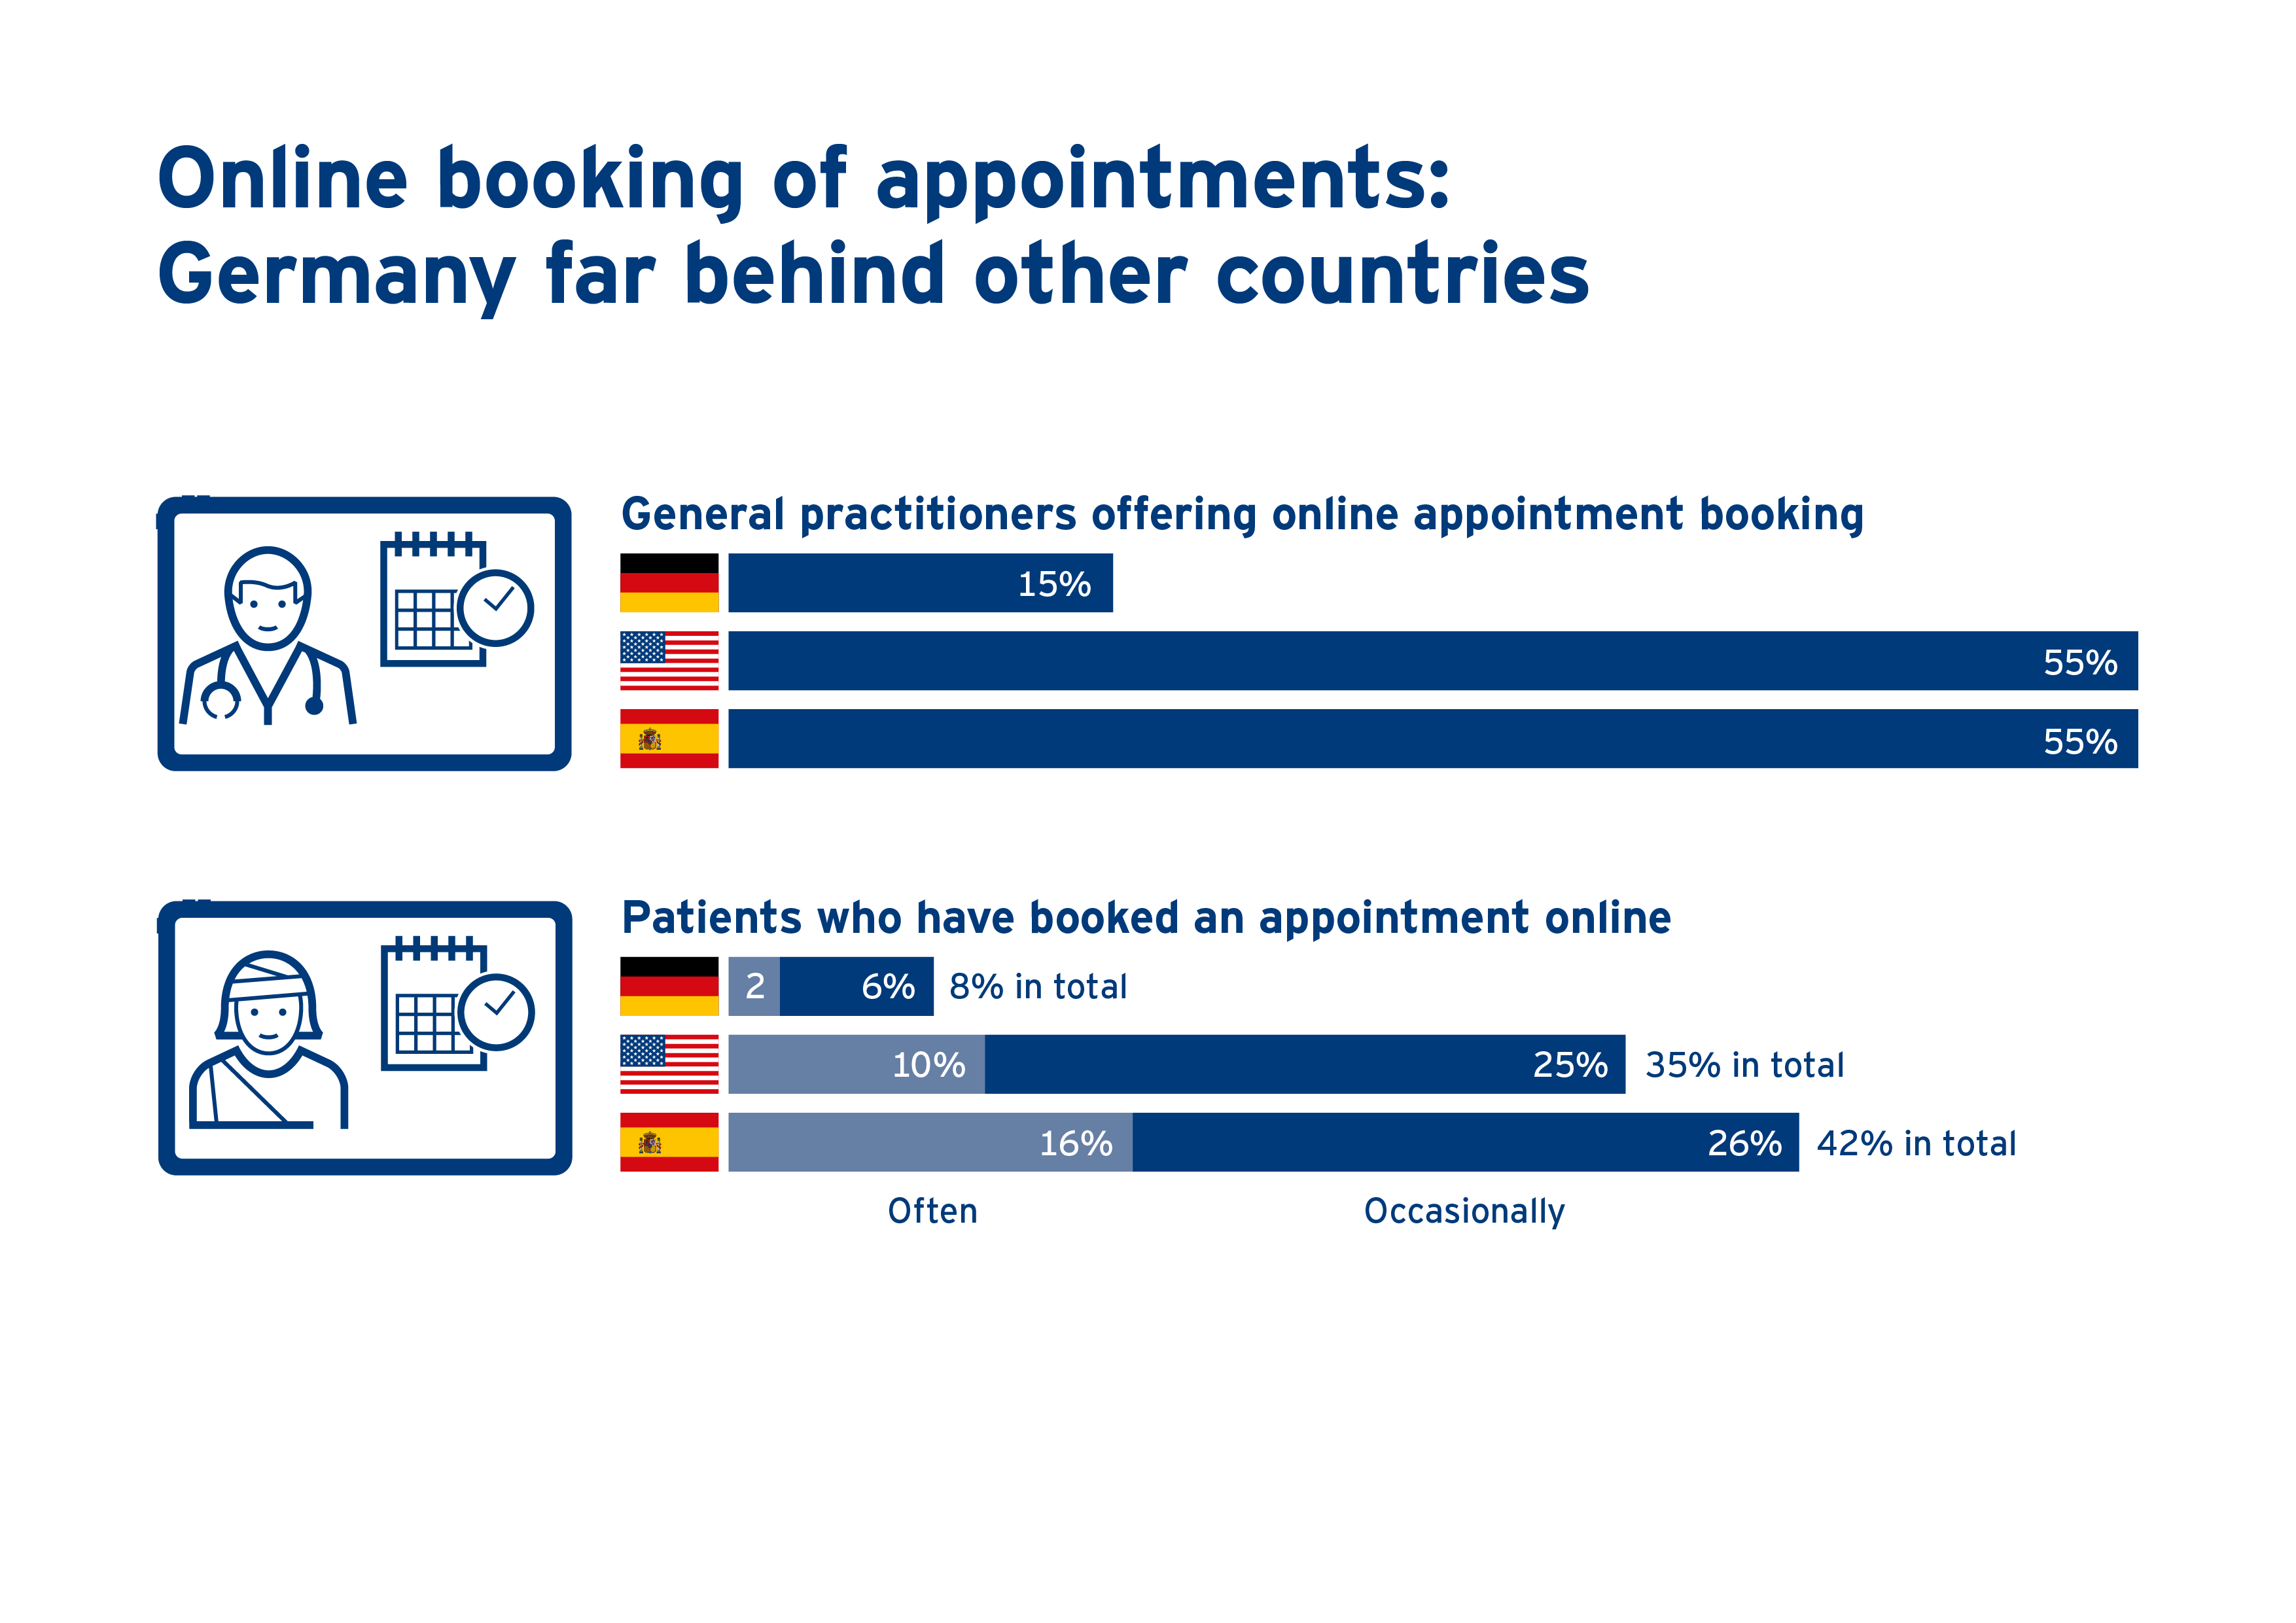
There are major differences even in the simplest digital offerings in the medical field, such as online appointment booking. In Germany, for example, only 15 percent of respondents said they can book an appointment with their general practitioner online, compared with 55 percent in both the U.S. and Spain. Accordingly, user rates are far apart: in Germany, only 8 percent of people have made an appointment with their GP online; in the U.S. and Spain the corresponding figures are 35 and 42 percent.
Accelerated by the pandemic: Digitalization of medicine as an opportunity
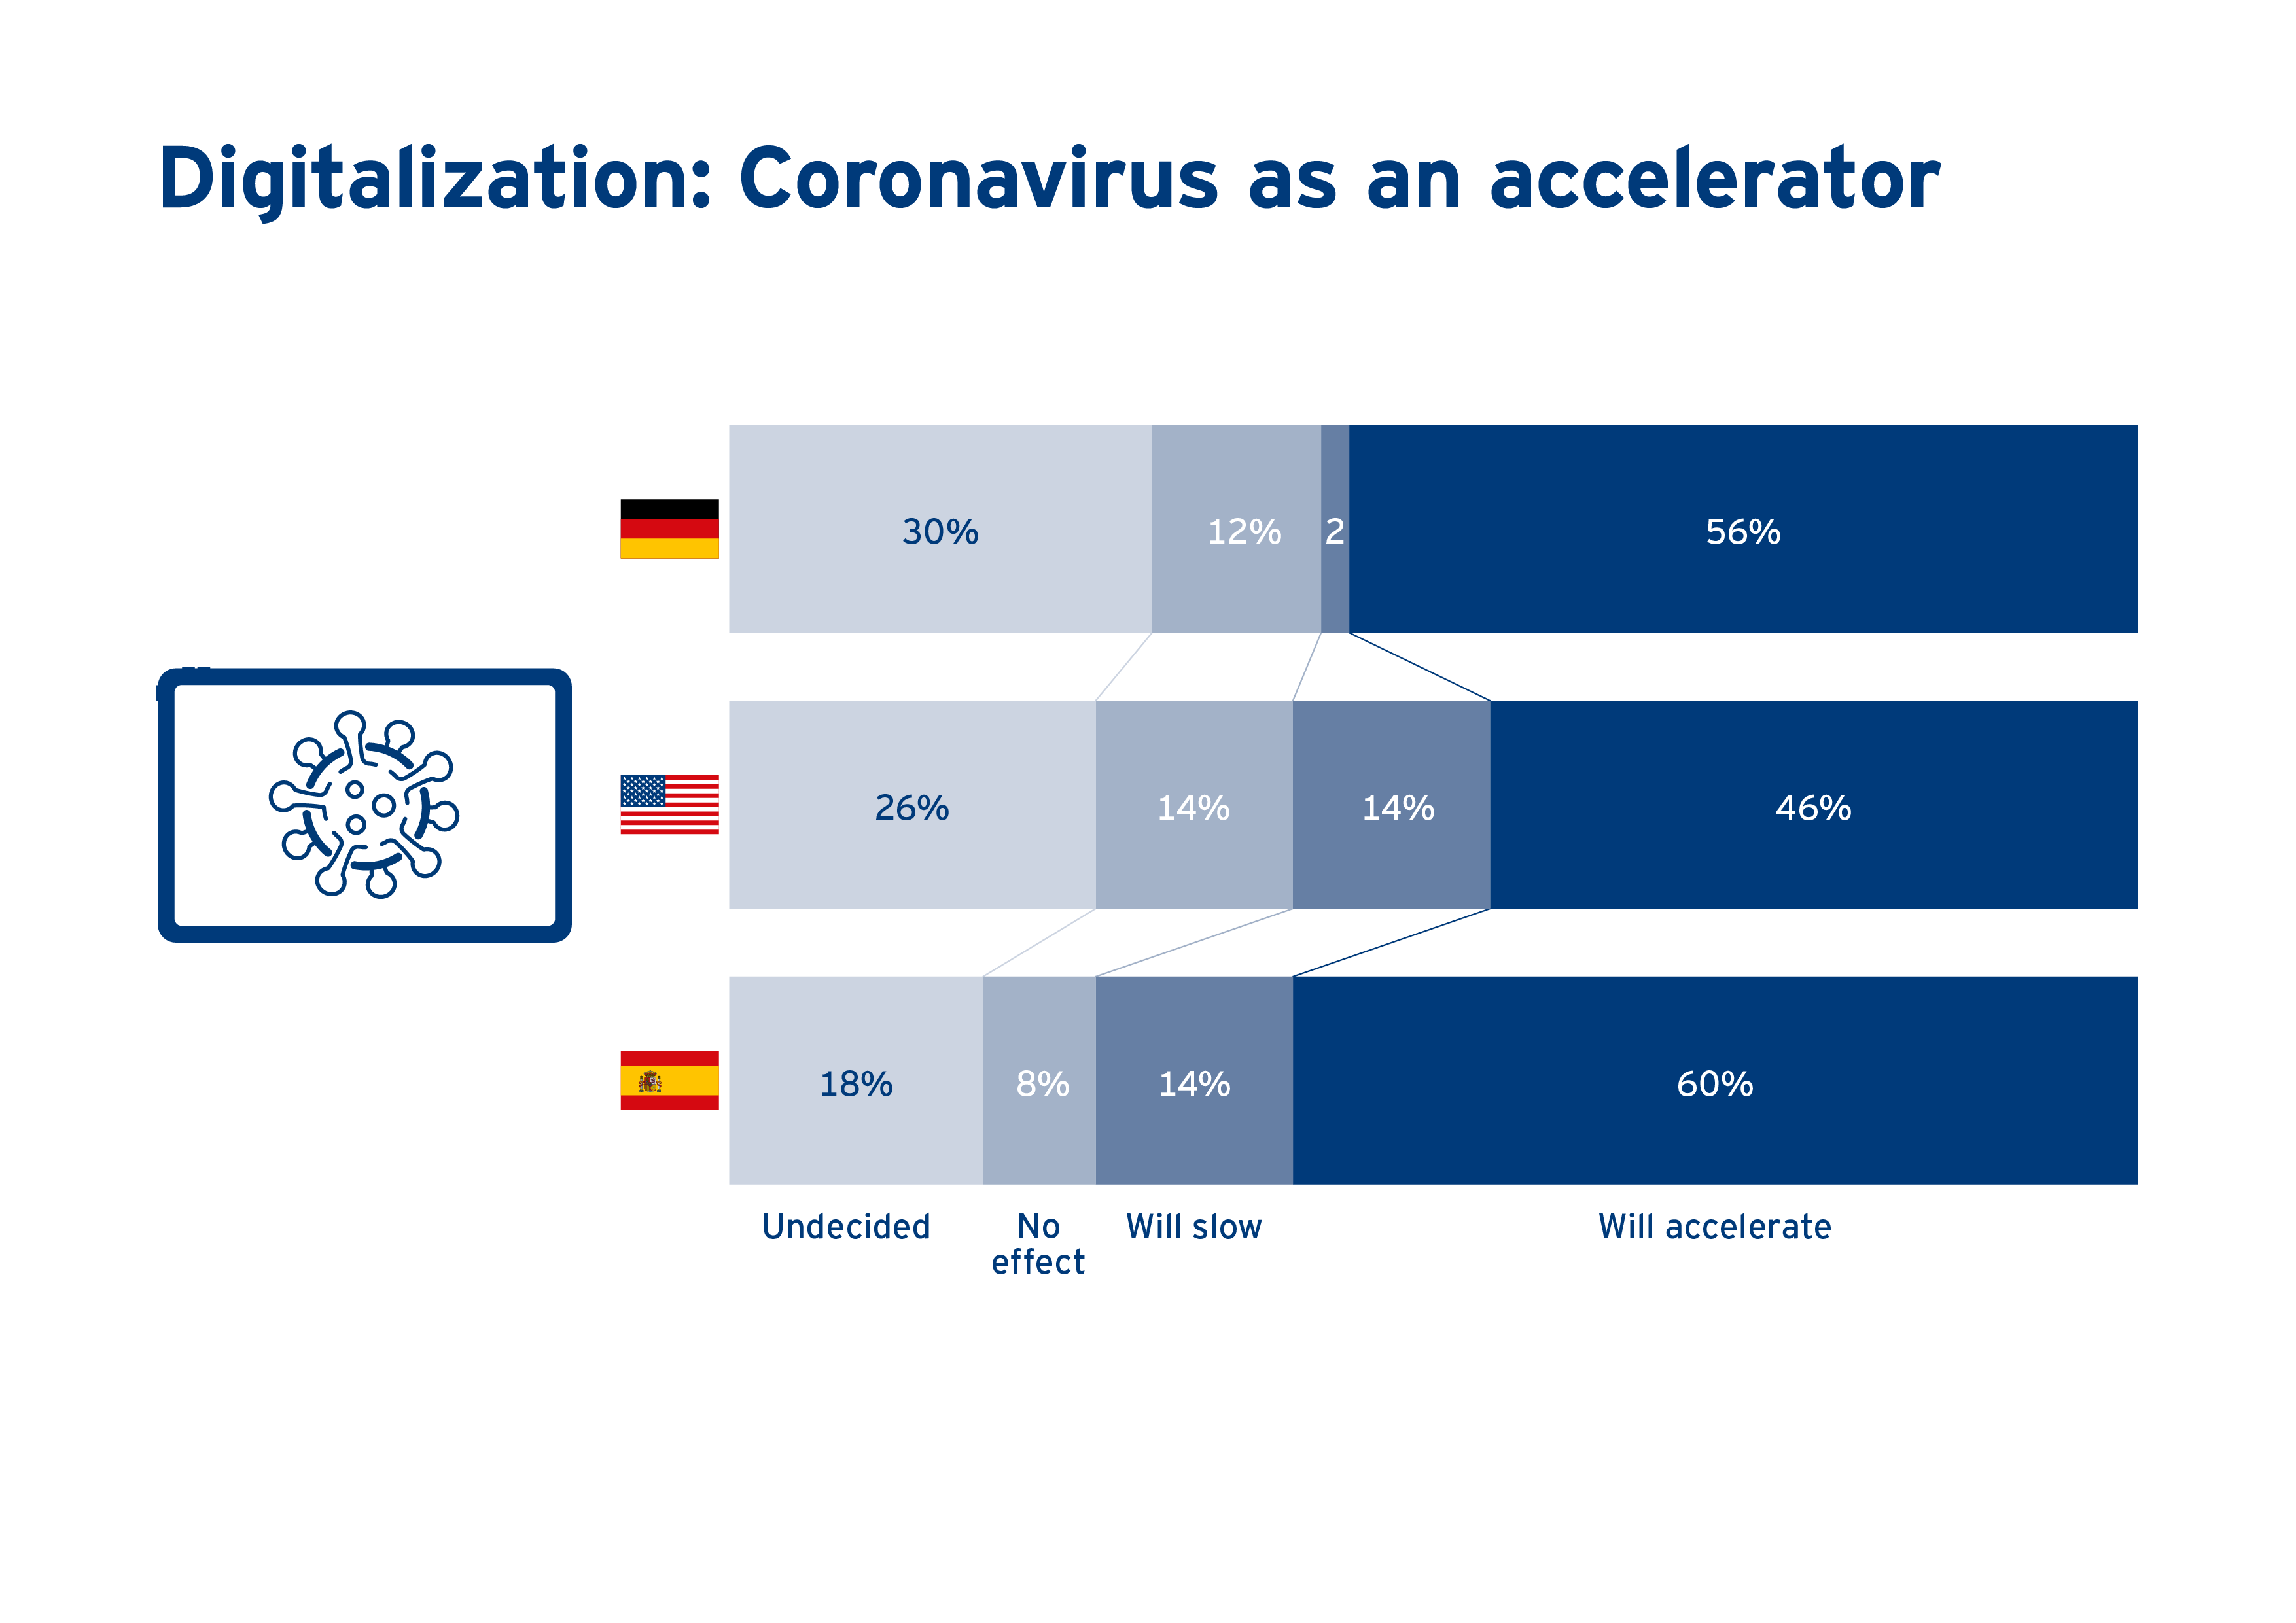
There is broad agreement among respondents in all three countries that the coronavirus crisis is accelerating the digitalization process in medicine: 46 percent of the U.S. population, 56 percent of Germany’s and 60 percent of Spain’s share this opinion.
According to significant numbers of the respondents, this increase in digitalization tends to offer opportunities for the healthcare sector: 49 percent in Spain, 34 percent in Germany and 32 percent in the U.S. think digitalization is likely to have more benefits than drawbacks for the healthcare sector.
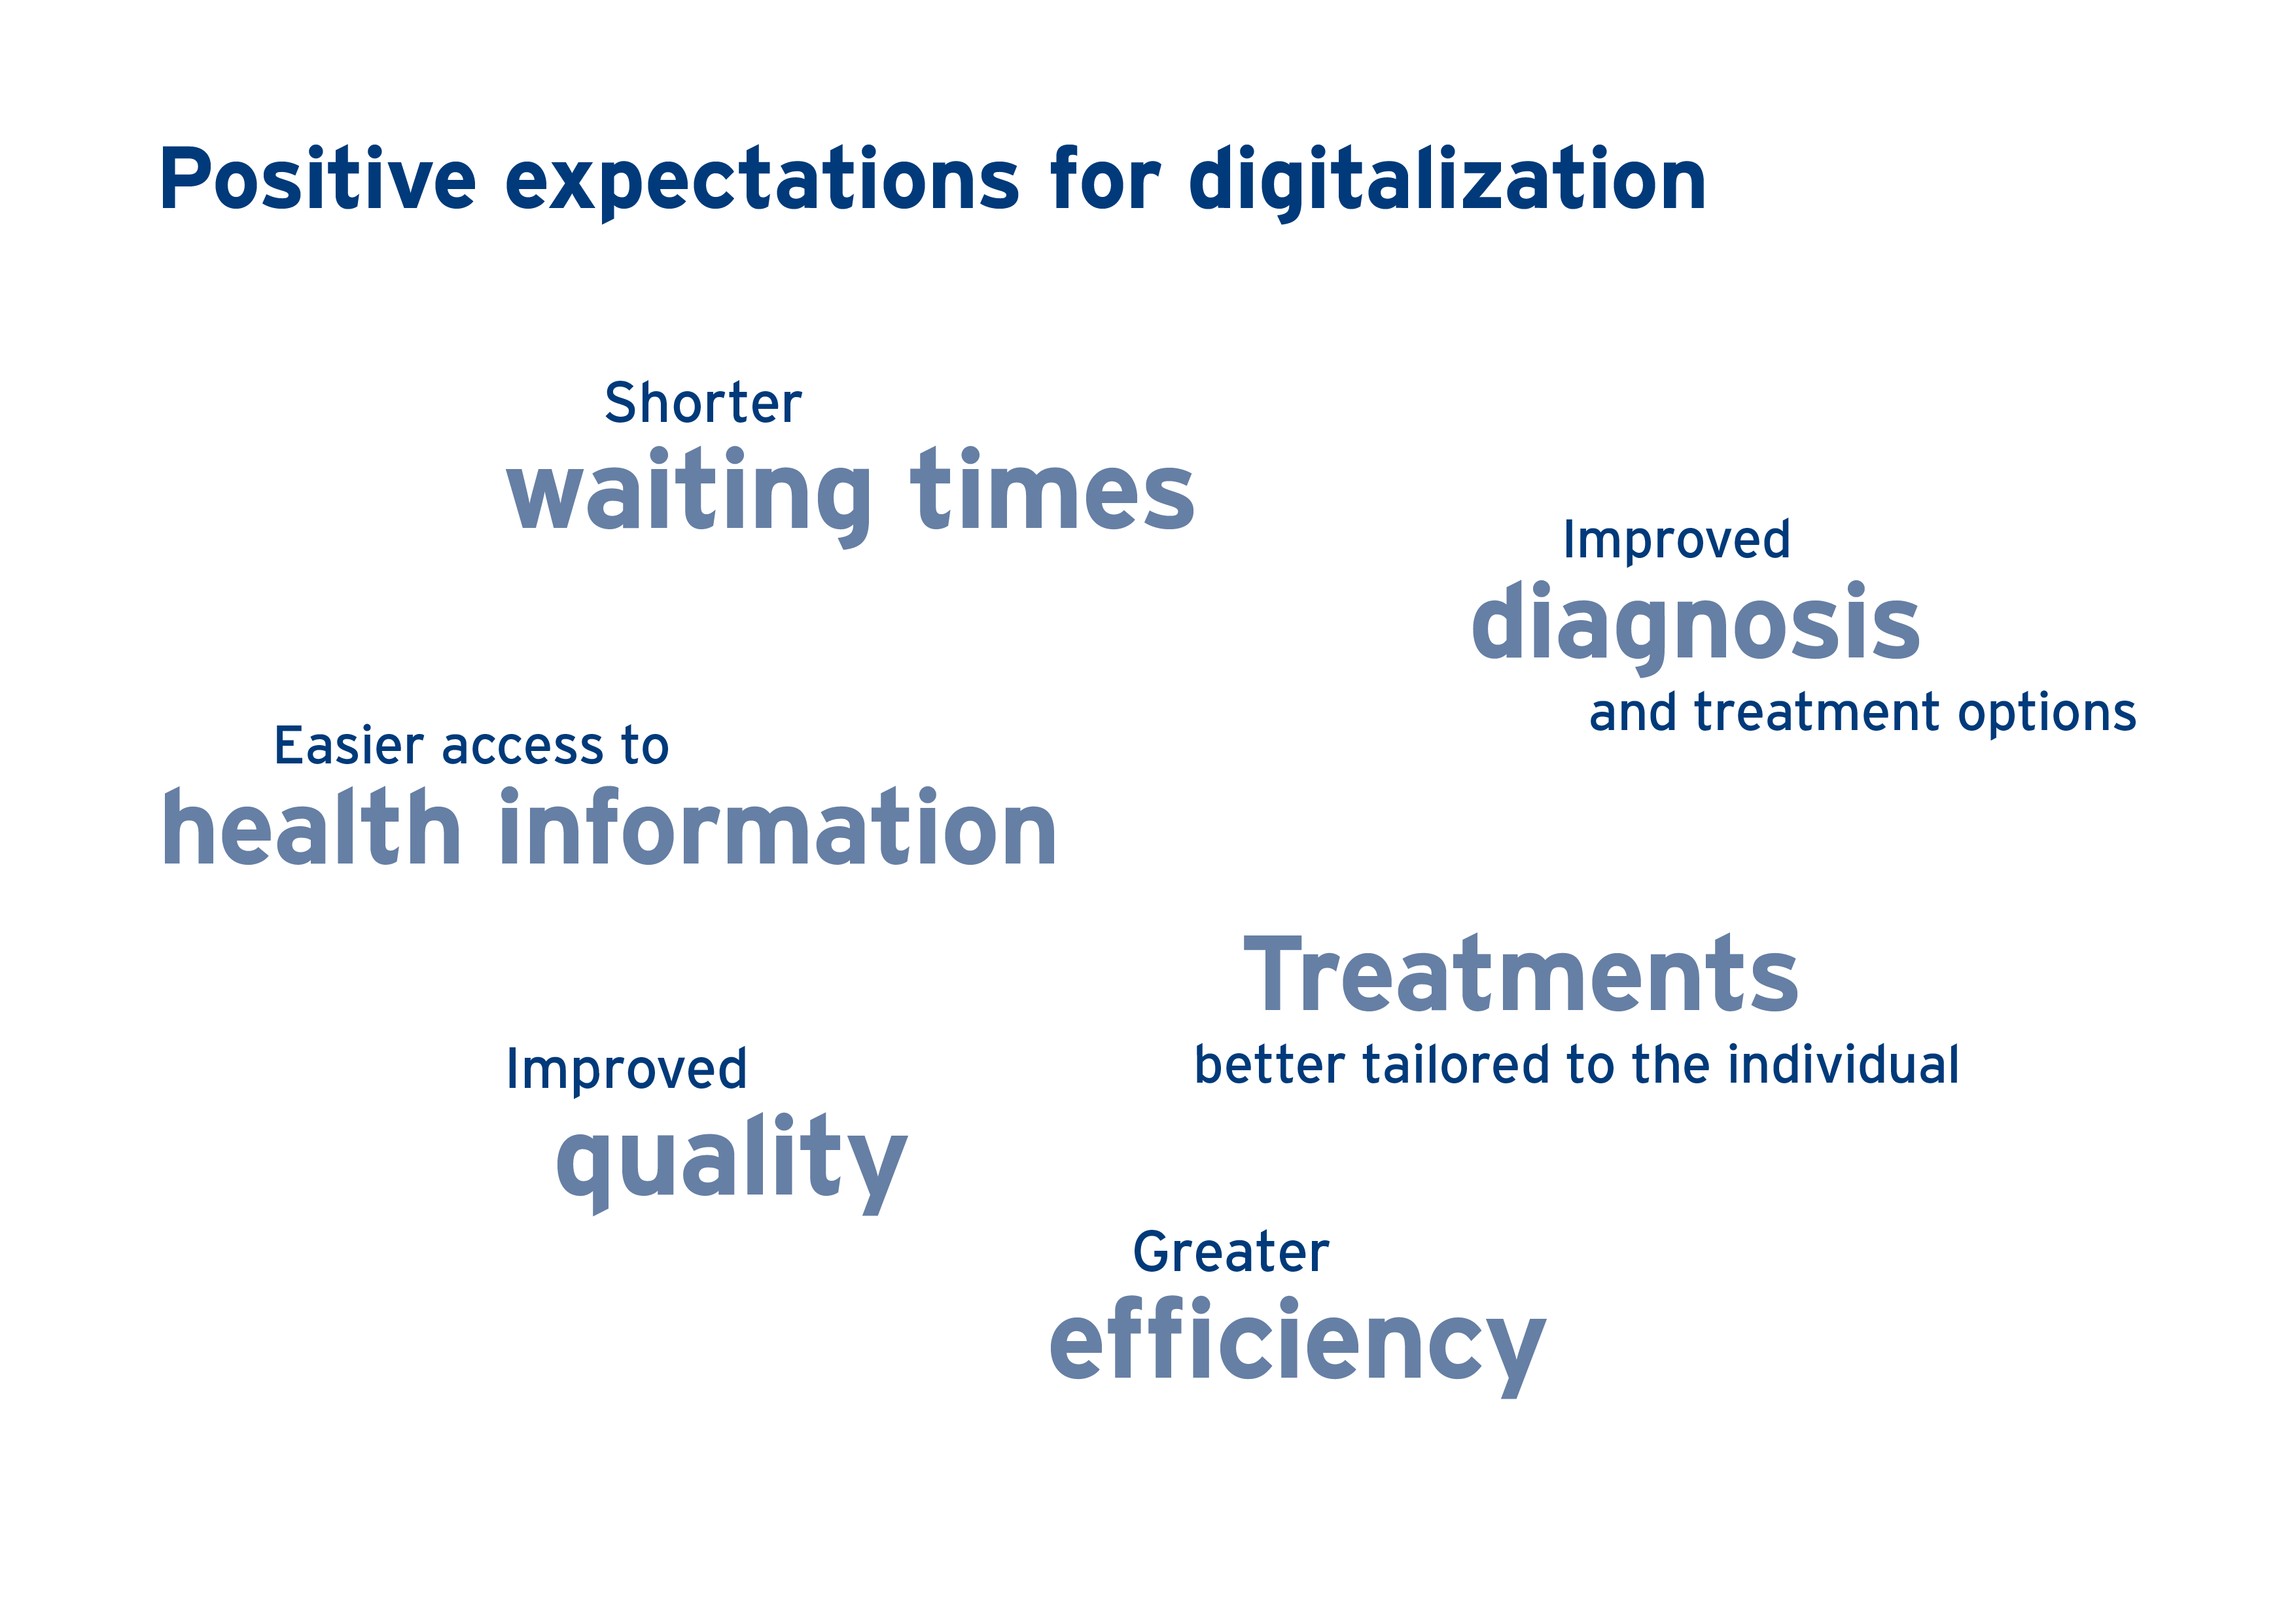
People in the three countries also associate digitalization with a range of positive effects for healthcare. For Germans, the greatest advantage by far is a simplified exchange between doctors, but they also see major benefits from easier access to health information and in improved diagnosis and treatment options: 47 percent expect that therapies could be better tailored to the individual, and 35 percent that treatment options will improve generally.
Americans do not rate the advantages of digitalization for the healthcare system much differently than do Germans. But Spaniards do: Above all, they expect shorter waiting times, cost savings through greater efficiency and an increase in healthcare quality as particularly positive effects.
The populations in the three countries are closely aligned in terms of which developments they consider to be welcome. Above all, the introduction of digital medical records, the expansion of telemedicine services and the use of patient data for diagnosis are considered desirable by large parts of the German, Spanish and U.S. populations. Around a third of people in all three countries consider it desirable that increasingly more personal health data is recorded with the help of apps, smartwatches and fitness bracelets.
Fresenius on trend with many digital applications
The survey’s results on what respondents consider as desirable developments confirm the digitalization initiatives that all business segments of Fresenius have been advancing for years. On one hand, these aim at getting closer to patients, for example by better integrating them into preventive care and therapies; on the other hand, numerous applications help medical professionals to achieve even better treatment results still more efficiently and safely.
Fresenius Helios: Digital monitoring of the entire treatment journey as a goal
With its digital patient portal, Fresenius Helios is a pioneer in the German healthcare market. About every second Helios hospital already allows its patients to access treatment documents, book appointments online and have video consultations from home. By 2022, other medical data such as nursing documentation and medication records will also be available in a digital patient file. Almost 3 million users are already accessing the Helios Spain portal; almost all of Helios' Spanish hospitals are connected to it.
In numerous Helios Germany hospitals, nursing staff also receive digital support directly at the bedside: A patient’s temperature, blood pressure and other vital signs are entered into a so-called spot check monitor and then transferred directly from it to an electronic patient file. These solutions are to be in use at all Helios Germany hospitals by the end of 2022.
The digital patient file with doctors’ letters, test results and the complete clinical imaging is available at almost every workplace in the hospital. It brings great advantages in prescribing medication, because electronic prescriptions can be clearly assigned and tracked by all involved parties, such as doctors’ practices and pharmacies; they can also be transferred digitally. Integrated software solutions provide a warning when there are possible interactions with other medications, which increases patient safety.
On the topic of telemedicine: All Fresenius Helios healthcare facilities have the technical capability to set up consultations via video, and some already offer these consultations on a regular basis. Helios Germany has also started online consultations in the pre-ambulatory area.
In the future, Helios will be able to digitally accompany patients throughout their entire treatment journey – whether they are staying in hospital or being treated as an outpatient.
Fresenius Medical Care: Home dialysis, networking and targeted therapies
Home dialysis is becoming increasingly popular, especially in the U.S., and it is important here that there can be close, remote monitoring of patients' health data. Fresenius Medical Care offers a cloud-based connected health home solution for patient management, including remote monitoring of ¬dialysis, management of treatment processes¬, the creation of personalized prescriptions and daily treatment reports to the responsible medical professionals.
In the U.S., Fresenius Medical Care’s connected healthcare platform, “TheHub,” connects patients with care teams and providers using an app: It was launched in late 2019 and in 2020 documented more than 1.7 million sessions. The company has similar solutions in use in numerous countries in Europe, Africa, the Asia-Pacific region and Latin America; beyond the home dialysis setting, the digital solutions are also offered in-center and in critical care.
Fresenius Medical Care is increasingly focusing on the analysis of aggregated and anonymized patient data with the focus on improving patient outcomes. With the help of artificial intelligence and machine learning techniques, the probable progressions of a disease can be modeled in advance in order to develop the best possible therapies and avoid expected complications. For example, the risk of a cardiovascular event can be assessed at an early stage – before it becomes life-threatening.
Fresenius Kabi: Providing security to patients and caregivers
Fresenius Kabi promotes patient empowerment through apps for therapy advice and support, follow-up care and interaction with healthcare professionals. For example, the company supports patients receiving clinical nutrition through digital platforms for nutrition management, and offers a special app that helps patients with chronic kidney failure with their diet plan.
In addition, the company operates a digital patient platform for biosimilars to advise and educate patients about this type of pharmaceuticals. It will be extended to other therapeutic areas. The data from these applications will be used in the future to analyze treatment results, predict risks and facilitate therapy decisions.
Especially for hospitals, Fresenius Kabi offers digital solutions to support the correct medicating of patients and increase safety and treatment quality. Fresenius Kabi also ensures the integration of patient-related devices into hospital information systems to holistically manage and monitor the health status and treatment of critically or chronically ill patients.
For its own drugs, Fresenius Kabi introduced so-called RFID smart labels in the U.S.; these enable hospitals to automatically identify, locate and manage their inventory.
Fresenius Vamed: Telerehabilitation, predictive maintenance and digital planning of healthcare facilities
Fresenius Vamed makes rehabilitation and aftercare services for patients largely accessible and barrier-free with digital solutions. Thanks to telemedical offerings, services can be provided more flexibly and from any location.
In the area of technical services, Fresenius Vamed has developed digital solutions for predictive maintenance. By optimizing maintenance and servicing, they help secure the reliability and dependability of technical equipment and systems in healthcare facilities.
In the project business, Fresenius Vamed uses digital solutions – so-called building information modeling (BIM) concepts – to simulate and optimize the entire life cycle (planning, development, construction and operation) of a healthcare facility during the planning phase.
Curalie: platform open to third parties for digital health services
Whether cardiological diseases and health risks, diabetes, renal insufficiency, high blood pressure, obesity or orthopedics: In many areas, the Fresenius subsidiary Curalie offers fully digitized solutions for the treatment of chronically ill patients.
The Curalie digital health platform enables the integration of devices, video calls and chats, referrals to the hospital information system, treatment plans and real-time analyses. Another focus of the health application is on preventive care offerings. Together with medical experts, Curalie develops digital health promotion programs for employers and their employees.
Curalie’s “OP Begleiter” (surgery companion) program prepares patients for their hospital stay and surgery. It starts up to three months before the operation and contains the most important information, helpful checklists and relaxation and physiotherapy exercises to prepare the patient holistically for their operation.
Curalie is also developing digital services for rehabilitation and aftercare. Tele-rehabilitation aftercare, for example, takes place directly after rehabilitation measures, and supports patients as they flexibly pursue remaining therapy goals from home.
-
Guidance for 2021 confirmed
-
Fresenius Medical Care delivers solid first quarter
-
Fresenius Kabi shows strong performance in Emerging Markets whilst headwinds continue to impact North American business
-
Helios Germany continues to be compensated by government for foregone elective treatments; Helios Spain delivers significant sales and earnings growth given recovery of treatment activity
-
Fresenius Vamed continues to suffer from COVID-19 related project delays; technical high-end service business remains robust
-
Preparation of Group-wide initiatives to improve efficiency and profitability progressing
If no timeframe is specified, information refers to Q1/2021.
In Q1/2021 no special items incurred.
1Before special items
2Net income attributable to shareholders of Fresenius SE & Co. KGaA
Stephan Sturm, CEO of Fresenius, said: “In view of the adversity and uncertainties that COVID-19 continues to bring, we are satisfied with our start in 2021. We achieved continued organic growth, although the pandemic had a lesser impact on the prior-year quarter. That makes me optimistic that we can reach our targets. The progress being made with vaccinations worldwide is another reason for confidence, even though it is too early to sound the all-clear. In the coming months, we will still be dealing with the pandemic’s many and wide-ranging effects. As before, we will do this with full responsibility for the patients entrusted to us. At the same time, we are moving ahead with our planning for cost and efficiency measures. These measures will create a strong foundation for accelerated and sustainable growth against the backdrop of long-term growth trends supporting our core businesses. Growth that contributes to ever better medicine for ever more people.”
COVID-19 assumptions for guidance FY/21
Q1/21 was characterized by a regionally varying development of the COVID-19 pandemic. Given continued high infection numbers as well as an increasing number of virus mutations, large-scale constraints of public and private life have been re-enacted in various countries. Vaccination programs are progressing worldwide at, however, varying pace.
COVID-19 will continue to impact Fresenius’ operations in 2021. Current burdens and constraints caused by COVID-19 are expected to recede only in H2/21. The expected improvement in the Group’s relevant business environment from H2/21 is heavily dependent on continuously increasing levels of vaccination coverage in Fresenius’ relevant markets. These assumptions are subject to considerable uncertainty.
A deterioration of the situation requiring further containment measures in one or more of Fresenius’ major markets, although becoming somewhat less likely does remain a risk. Any resulting significant and direct impact on the health care sector without any appropriate compensation is not reflected in the Group’s FY/21 guidance.
FY/21 Group guidance confirmed
For FY/21, Fresenius continues to project sales growth1 in a low-to-mid single-digit percentage range and at least broadly stable net income2,3 year-over-year, both in constant currency. Implicitly, net income2 for the Group excluding Fresenius Medical Care is expected to grow in a mid-to-high single-digit percentage range in constant currency.
Fresenius projects net debt/EBITDA4 to be around the top-end of the self-imposed target corridor of 3.0x to 3.5x by the end of FY/21.
To sustainably enhance profitability, Fresenius is preparing group-wide strategic efficiency initiatives. These initiatives are expected to consist of operational excellence and cost-saving measures, targeted strengthening of future growth areas and portfolio optimizations. They are targeted to result in cost savings of at least €100 million p.a. after tax and minority interest in 2023 with some further potential to increase thereafter. Achieving these sustainable efficiencies will require significant up-front expenses. On average for the years 2021 to 2023, those expenses are expected to be in the order of magnitude of €100 million p.a. after tax and minority interest. They will be classified as special items.
1 FY/20 base: €36,277 million
2 Net income attributable to shareholders of Fresenius SE & Co. KGaA
3 FY/20 base: €1,796 million, before special items; FY/21: before special items
4 At LTM average exchange rates for both net debt and EBITDA; pro forma closed acquisitions/divestitures; excluding further potential acquisitions; before special items
For a detailed overview of special items please see the reconciliation table in the PDF document.
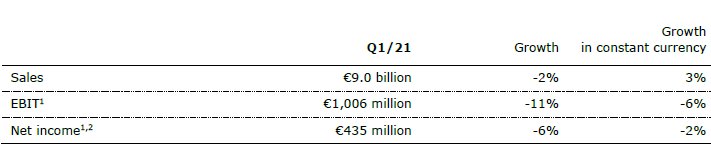
3% sales increase in constant currency
Group sales decreased by 2% (increased by 3% in constant currency) to €8,984 million (Q1/20: €9,135 million). Organic growth was 2%. Acquisitions/divestitures contributed net 1% to growth. Currency translation reduced sales growth by 5%. Excluding estimated COVID-19 effects1, Group sales growth would have been 4% to 5% in constant currency (Q1/20: 7% to 8%).
2% net income2,3 decrease in constant currency
Group EBITDA before special items and reported Group EBITDA decreased by 7% (-2% in constant currency) to €1,628 million (Q1/20: €1,755 million).
Group EBIT before special items and reported Group EBIT decreased by 11% (-6% in constant currency) to €1,006 million (Q1/20: €1,125 million). The constant currency decrease is primarily due to COVID-19 related headwinds. Both the EBIT margin before special items and the reported EBIT margin were 11.2% (Q1/20: 12.3%).
Group net interest before special items improved to -€137 million (Q1/202: -€174 million) mainly due to successful refinancing activities, lower interest rates as well as currency translation effects. Reported Group net interest also improved to -€137 million (Q1/20: -€182 million).
Both the Group tax rate before special items and the reported tax rate were 22.8% (Q1/20: 22.6%).
Both Noncontrolling interests before special items and reported noncontrolling interests were -€236 million (Q1/20: -€271 million) of which 95% were attributable to the noncontrolling interests in Fresenius Medical Care.
1 For estimated COVID-19 effects in Q1/21 and Q1/20 please see table in the PDF document.
2 Before special items
3 Net income attributable to shareholders of Fresenius SE & Co. KGaA
For a detailed overview of special items please see the reconciliation table in the PDF document.
Group net income1 before special items decreased by 6% (-2% in constant currency) to €435 million (Q1/202: €465 million). The absolute negative COVID-19 effect was more pronounced in Q1/21 compared to the prior-year quarter. Excluding estimated COVID-19 effects3, Group net income1 before special items would have grown 0% to 4% in constant currency (Q1/20: 6% to 10%). Reported Group net income1 decreased to €435 million (Q1/20: €459 million).
Earnings per share1 before special items decreased by 6% (-2% in constant currency) to €0.78 (Q1/202: €0.83). Reported earnings per share1 were also €0.78 (Q1/20: €0.82).
Continued investment in growth
Spending on property, plant and equipment was €384 million corresponding to 4% of sales (Q1/20: €547 million; 6% of sales). These investments served primarily for the modernization and expansion of dialysis clinics, production facilities as well as hospitals and day clinics.
Total acquisition spending was €149 million (Q1/20: €412 million), mainly for the acquisition of dialysis clinics at Fresenius Medical Care.
Cash flow development
Group operating cash flow decreased to €652 million (Q1/20: €878 million) with a margin of 7.3% (Q1/20: 9.6%), driven by a seasonal fluctuation in Fresenius Medical Care's invoicing and working capital movements in North America. Free cash flow before acquisitions and dividends decreased to €241 million (Q1/20: €305 million). Free cash flow after acquisitions and dividends increased to €117 million (Q1/20: -€40 million).
1 Net income attributable to shareholders of Fresenius SE & Co. KGaA
2 Before special items
3 For estimated COVID-19 effects in Q1/21 and Q1/20 please see table in the PDF document.
For a detailed overview of special items please see the reconciliation table in the PDF document.
Solid balance sheet structure
Group total assets increased by 3% (1% in constant currency) to €68,966 million (Dec. 31, 2020: €66,646 million) given currency translation effects and the expansion of business activities. Current assets increased by 6% (4% in constant currency) to €16,693 million (Dec. 31, 2020: €15,772 million), mainly driven by the increase of trade accounts receivables. Non-current assets increased by 3% (0% in constant currency) to €52,273 million (Dec. 31, 2020: €50,874 million).
Total shareholders’ equity increased by 6% (3% in constant currency) to €27,514 million (Dec. 31, 2020: €26,023 million). The equity ratio was 39.9% (Dec. 31, 2020: 39.0%).
Group debt increased by 2% (1% in constant currency) to €26,508 million (Dec. 31, 2020: € 25,913 million). Group net debt increased by 2% (1% in constant currency) to € 24,631 million (Dec. 31, 2020: € 24,076 million).
As of March 31, 2021, the net debt/EBITDA ratio increased to 3.52x1,2 (Dec. 31, 2020: 3.44x1,2) driven by COVID-19 effects weighing on EBITDA as well as increased net debt.
Number of employees
As of March 31, 2021, the Fresenius Group had 310,842 employees worldwide (December 31, 2020: 311,269).
1 At LTM average exchange rates for both net debt and EBITDA; pro forma closed acquisitions/divestitures
2 Before special items
For a detailed overview of special items please see the reconciliation table in the PDF document.
Business Segments
Fresenius Medical Care (Financial data according to Fresenius Medical Care press release)
Fresenius Medical Care is the world's largest provider of products and services for individuals with renal diseases. As of March 31, 2021, Fresenius Medical Care was treating 344,476 patients in 4,110 dialysis clinics. Along with its core business, the Renal Care Continuum, the company focuses on expanding in complementary areas and in the field of critical care.
• Organic treatment growth impacted by COVID-19 pandemic as expected
• Reported revenue and earnings continued to be adversely affected by exchange rate effects
• Earnings development supported by phasing and expected lower SG&A expense anticipated to reverse throughout the year
• Financial targets for FY 2021 confirmed
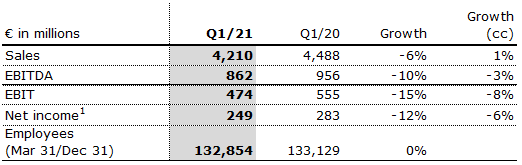
Sales of Fresenius Medical Care decreased by 6% (increased by 1% in constant currency) to €4,210 million (Q1/20: €4,488 million). Thus, currency translation had a negative effect of 7%. Organic growth was 1%.
EBIT decreased by 15% (-8% in constant currency) to €474 million (Q1/20: €555 million) resulting in a margin of 11.3% (Q1/20: 12.4%). The decrease was mainly driven by effects from COVID-19 across all regions, higher personnel expenses and a significant negative exchange rate effect. Additionally, EBIT was negatively affected by a positive prior-year effect from the divestiture of cardiovascular clinics and a prior-year partial reversal of a revenue recognition adjustment. These negative effects were partially offset by an improved payor mix mainly driven by Medicare Advantage and expected lower SG&A expenses, which are anticipated to reverse in the remainder of the year.
1 Net income attributable to shareholders of Fresenius Medical Care AG & Co. KGaA
Net income1 decreased by 12% (-6% in constant currency) to €249 million (Q1/20: €283 million). Besides the above-mentioned operating earnings effects, net income was supported by a 27% decrease of net interest expense to €76 million (Q1/20: €104 million).
The first quarter 2020 included negative COVID-19 effects that reversed in Q2 2020, including the compensation received under the CARES Act, and therewith increase the base for the second quarter 2021. These base effects impact the phasing of net income growth in 2021.
Operating cash flow was €208 million (Q1/20: €584 million) with a margin of 4.9% (Q1/20: 13.0%). The decline was driven by the seasonality in invoicing and periodic delays in payment of public health care organizations.
For FY/21, Fresenius Medical Care confirms its outlook as outlined on February 23, 2021. The Company expects revenue2 to grow at a low-to-mid single-digit percentage range and net income1,3 to decline at a high-teens to mid-twenties percentage range against the 2020 base4.
For further information, please see Fresenius Medical Care’s press release at www.freseniusmedicalcare.com.
1 Net income attributable to shareholders of Fresenius Medical Care AG & Co. KGaA
2 FY/20 base: €17,859 million
3 FY/20 base: €1,359 million, before special items; FY/21: before special items
4 These targets are based on the 2020 results excluding the impairment of goodwill and trade names in the Latin America Segment of €195 million. They are inclusive of anticipated COVID-19 effects, in constant currency and exclude special items. Special items include costs related to FME25 and other effects that are unusual in nature and have not been foreseeable or not foreseeable in size or impact at the time of giving guidance.
Fresenius Kabi
Fresenius Kabi offers intravenously administered generic drugs, clinical nutrition and infusion therapies for seriously and chronically ill patients in the hospital and outpatient environments. The company is also a leading supplier of medical devices and transfusion technology products. In the biosimilars business, Fresenius Kabi develops products with a focus on oncology and autoimmune diseases.
• North America performance impacted by COVID-19 and temporary manufacturing issues
• Solid performance in Europe masked by prior-year COVID-19 related demand spike
• Emerging Markets showed strong sales and earnings growth; China with excellent performance given dynamic recovery of elective treatment activity
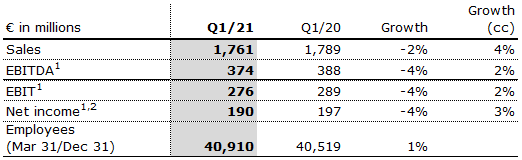
Sales decreased by 2% (increased by 4% in constant currency) to €1,761 million (Q1/20: €1,789 million). Organic growth was 3%. Negative currency translation effects of 6% were mainly related to weakness of the US dollar, the Brazilian real and the Argentinian peso.
Sales in North America decreased by 17% (organic growth: -9%) to €558 million (Q1/20: €669 million). The decrease was driven by fewer elective treatments, competitive pressure, missing sales from a customer in Chapter 11 as well as temporary manufacturing issues which outweighed extra demand for COVID-19 related products.
Sales in Europe decreased by 1% (organic growth: -1%) to €626 million (Q1/20: €631 million) mainly related to the strong demand for COVID-19 related drugs in the prior year quarter.
Sales in Asia-Pacific increased by 23% (organic growth: 26%) to €392 million (Q1/20: €319 million). The growth is mainly due to a dynamic recovery of elective procedures and a meaningful COVID-19 impact lowering the prior year basis in China as well as a growing recovery in other Asian markets.
1 Before special items
2 Net income attributable to shareholders of Fresenius SE & Co. KGaA
Sales in Latin America/Africa increased by 9% (organic growth: 28%) to €185 million (Q1/20: €170 million) due to ongoing COVID-19 related extra demand.
EBIT1 decreased by 4% (increased by 2% in constant currency) to €276 million (Q1/20: €289 million) with an EBIT margin of 15.7% (Q1/20:16.2%). The increase in constant currency was tempered by underutilized production capacities in the US, competitive pressure coupled with selective supply constraints due to temporary manufacturing issues and the missing contribution from sales to a customer now in Chapter 11. EBIT was supported by positive COVID-19 effects, lower corporate costs due to travel restrictions and phasing of projects.
Net income1,2 decreased by 4% (increased by 3% in constant currency) to €190 million (Q1/201: €197 million).
Operating cash flow increased to €278 million (Q1/20: €174 million) with a margin of 15.8% (Q1/20: 9.7%) mainly due to working capital improvements driven by cash collections.
For FY/21, Fresenius Kabi confirms its outlook and expects organic sales3 growth in a low-to-mid single-digit percentage range. Constant currency EBIT4 is expected to show a stable development up to low single-digit percentage growth. Both sales and EBIT outlook include expected COVID-19 effects.
1 Before special items
2 Net income attributable to shareholders of Fresenius SE & Co. KGaA
3 FY/20 base: €6,976 million
4 FY/20 base: €1,095 million, before special items; FY/21: before special items
Fresenius Helios
Fresenius Helios is Europe's leading private hospital operator. The company comprises Helios Germany and Helios Spain. Helios Germany operates 89 hospitals, ~130 outpatient centers and 6 prevention centers. Helios Spain operates 47 hospitals, 74 outpatient centers and around 300 occupational risk prevention centers. In addition, the company is active in Latin America with 6 hospitals and as a provider of medical diagnostics.
• Helios Spain delivers significant organic sales and earnings growth given recovery of treatment activity
• Helios Germany continues to be compensated by government for foregone elective treatments
• Growth additionally fueled by contributions from acquisitions in Germany and Latin America
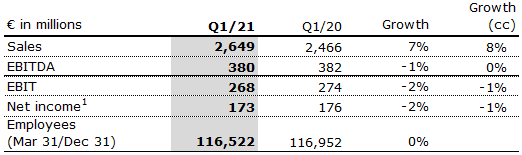
Sales increased by 7% (8% in constant currency) to €2,649 million (Q1/20: €2,466 million). Organic growth was 4%. Acquisitions contributed 4% to sales growth.
Sales of Helios Germany increased by 4% (organic growth: 0%) to €1,673 million (Q1/20: €1,603 million). COVID-19 effects were mitigated by government compensation in regions with high COVID-19 incidences. The hospital acquisitions from the Order of Malta contributed 4% to sales growth.
Sales of Helios Spain increased by 13% (14% in constant currency) to €976 million (Q1/20: €863 million). Organic growth of 11% was driven by a strong recovery of elective procedures, a consistently high level of outpatient treatments and strong demand for occupational risk prevention (ORP) services. In addition, the hospitals in Latin America showed a strong performance. The hospital acquisitions in Colombia contributed 3% to sales growth.
EBIT of Fresenius Helios decreased by 2% (-1% in constant currency) to €268 million (Q1/20: €274 million) with an EBIT margin of 10.1% (Q1/20: 11.1%).
1 Net income attributable to shareholders of Fresenius SE & Co. KGaA
EBIT of Helios Germany decreased by 9% to €150 million (Q1/20: €165 million) with an EBIT margin of 9.0% (Q1/20: 10.3%). Government compensation broadly mitigated COVID-19 effects. The decrease was primarily caused by the impact of the carve-out of nursing expenses from the overall DRGs and the positive development of January and February last year.
EBIT of Helios Spain increased by 13% (14% in constant currency) to €126 million (Q1/20: €112 million) with an EBIT margin of 12.9% (Q1/20: 13.0%). Healthy organic sales growth led to a meaningfully improved coverage of the fixed cost base. The hospital acquisitions in Colombia made an additional contribution.
Net income1 decreased by 2% (-1% in constant currency) to €173 million (Q1/20: €176 million).
Operating cash flow increased to €215 million (Q1/20: €145 million) with a margin of 8.1% (Q1/20: 5.9%), mainly due to working capital improvements driven by cash collections.
For FY/21, Fresenius Helios confirms its outlook and expects organic sales2 growth in a low-to-mid single-digit percentage range and constant currency EBIT3 growth in a mid-to-high single-digit percentage range. Both sales and EBIT outlook include expected COVID-19 effects.
1 Net income attributable to shareholders of Fresenius SE & Co. KGaA
2 FY/20 base: €9,818 million
3 FY/20 base: €1,025 million; FY/21 before special items
Fresenius Vamed
Fresenius Vamed manages projects and provides services for hospitals and other health care facilities worldwide and is a leading post-acute care provider in Central Europe. The portfolio ranges along the entire value chain: from project development, planning, and turnkey construction, via maintenance and technical management to total operational management.
• Continued significant negative COVID-19 impact
• Project business marked by COVID-19 related delays, cancellations and global supply chain restraints
• Rehabilitation business remains impacted by fewer elective surgeries
• Technical high-end service business remains robust
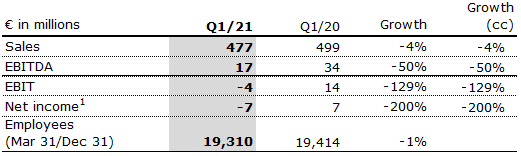
Sales decreased by 4% (-4% in constant currency) to €477 million (Q1/20: €499 million). Organic growth was -4%.
Sales in the service business increased by 2% (2% in constant currency) to €363 million (Q1/20: €357 million). Sales in the project business decreased by 20% (-20% in constant currency) to €114 million (Q1/20: €142 million), driven by postponements and cancellations of projects.
EBIT decreased by 129% (-129% in constant currency) to -€4 million (Q1/20: €14 million) with an EBIT margin of -0.8% (Q1/20: 2.8%). Large parts of the post-acute care clinic capacities were left partially empty given a generally lower intake of elective surgery patients from acute-care hospitals. Health-authority-induced restrictions or even closures of facilities also had a negative effect. In the project business, project delays and global supply chain restraints triggered incremental expenses.
1 Net income attributable to shareholders of VAMED AG
Net income1 decreased to -€7 million (Q1/20: €7 million).
Order intake was €138 million (Q1/20: €124 million). As of March 31, 2021, order backlog was at €3,082 million (December 31, 2020: €3,055 million). Order intake continued to be marked by COVID-19 related cancellations and project delays.
Operating cash flow decreased to -€44 million (Q1/20: -€20 million) with a margin of -9.2% (Q1/20: -4.0%), mainly related to the lower net income contribution.
For FY/21, Fresenius Vamed confirms its outlook and expects organic sales2 growth in a mid-to-high single-digit percentage range and EBIT3 to grow to a high double-digit Euro million amount. Both sales and EBIT outlook include expected negative COVID-19 effects.
1 Net income attributable to shareholders of VAMED AG
2 FY/20 base: €2,068 million
3 FY/20 base: €29 million; FY/21 before special items
Conference Call
As part of the publication of the results for Q1/2021, a conference call will be held on May 6, 2021 at 1:30 p.m. CEDT (7:30 a.m. EDT). You are cordially invited to follow the conference call in a live broadcast over the Internet at www.fresenius.com/media-calender. Following the call, a replay will be available on our website.. Following the call, a replay will be available on our website.
For additional information on the performance indicators used please refer to our website https://www.fresenius.com/alternative-performance-measures.
This release contains forward-looking statements that are subject to various risks and uncertainties. Future results could differ materially from those described in these forward-looking statements due to certain factors, e.g. changes in business, economic and competitive conditions, regulatory reforms, results of clinical trials, foreign exchange rate fluctuations, uncertainties in litigation or investigative proceedings, and the availability of financing. Fresenius does not undertake any responsibility to update the forward-looking statements in this release.
• Guidance for 2021 confirmed
• Fresenius Medical Care delivers solid first quarter
• Fresenius Kabi shows strong performance in Emerging Markets whilst headwinds continue to impact North American business
• Helios Germany continues to be compensated by government for foregone elective treatments; Helios Spain delivers significant sales and earnings growth given recovery of treatment activity
• Fresenius Vamed continues to suffer from COVID-19 related project delays; technical high-end service business remains robust
• Preparation of Group-wide initiatives to improve efficiency and profitability progressing
If no timeframe is specified, information refers to Q1/2021. In Q1/2021 no special items incurred.

1 Before special items
2 Net income attributable to shareholders of Fresenius SE & Co. KGaA
For a detailed overview of special items please see the reconciliation table in the PDF document.
Stephan Sturm, CEO of Fresenius, said: “In view of the adversity and uncertainties that COVID-19 continues to bring, we are satisfied with our start in 2021. We achieved continued organic growth, although the pandemic had a lesser impact on the prior-year quarter. That makes me optimistic that we can reach our targets. The progress being made with vaccinations worldwide is another reason for confidence, even though it is too early to sound the all-clear. In the coming months, we will still be dealing with the pandemic’s many and wide-ranging effects. As before, we will do this with full responsibility for the patients entrusted to us. At the same time, we are moving ahead with our planning for cost and efficiency measures. These measures will create a strong foundation for accelerated and sustainable growth against the backdrop of long-term growth trends supporting our core businesses. Growth that contributes to ever better medicine for ever more people.”
COVID-19 assumptions for guidance FY/21
Q1/21 was characterized by a regionally varying development of the COVID-19 pandemic. Given continued high infection numbers as well as an increasing number of virus mutations, large-scale constraints of public and private life have been re-enacted in various countries. Vaccination programs are progressing worldwide at, however, varying pace.
COVID-19 will continue to impact Fresenius’ operations in 2021. Current burdens and constraints caused by COVID-19 are expected to recede only in H2/21. The expected improvement in the Group’s relevant business environment from H2/21 is heavily dependent on continuously increasing levels of vaccination coverage in Fresenius’ relevant markets. These assumptions are subject to considerable uncertainty.
A deterioration of the situation requiring further containment measures in one or more of Fresenius’ major markets, although becoming somewhat less likely does remain a risk. Any resulting significant and direct impact on the health care sector without any appropriate compensation is not reflected in the Group’s FY/21 guidance.
FY/21 Group guidance confirmed
For FY/21, Fresenius continues to project sales growth1 in a low-to-mid single-digit percentage range and at least broadly stable net income2,3 year-over-year, both in constant currency. Implicitly, net income2 for the Group excluding Fresenius Medical Care is expected to grow in a mid-to-high single-digit percentage range in constant currency.
Fresenius projects net debt/EBITDA4 to be around the top-end of the self-imposed target corridor of 3.0x to 3.5x by the end of FY/21.
To sustainably enhance profitability, Fresenius is preparing group-wide strategic efficiency initiatives. These initiatives are expected to consist of operational excellence and cost-saving measures, targeted strengthening of future growth areas and portfolio optimizations. They are targeted to result in cost savings of at least €100 million p.a. after tax and minority interest in 2023 with some further potential to increase thereafter. Achieving these sustainable efficiencies will require significant up-front expenses. On average for the years 2021 to 2023, those expenses are expected to be in the order of magnitude of €100 million p.a. after tax and minority interest. They will be classified as special items.
1 FY/20 base: €36,277 million
2 Net income attributable to shareholders of Fresenius SE & Co. KGaA
3 FY/20 base: €1,796 million, before special items; FY/21: before special items
4 At LTM average exchange rates for both net debt and EBITDA; pro forma closed acquisitions/divestitures; excluding further potential acquisitions; before special items
For a detailed overview of special items please see the reconciliation table in the PDF document.
3% sales increase in constant currency
Group sales decreased by 2% (increased by 3% in constant currency) to €8,984 million (Q1/20: €9,135 million). Organic growth was 2%. Acquisitions/divestitures contributed net 1% to growth. Currency translation reduced sales growth by 5%. Excluding estimated COVID-19 effects1, Group sales growth would have been 4% to 5% in constant currency (Q1/20: 7% to 8%).
2% net income2,3 decrease in constant currency
Group EBITDA before special items and reported Group EBITDA decreased by 7% (-2% in constant currency) to €1,628 million (Q1/20: €1,755 million).
Group EBIT before special items and reported Group EBIT decreased by 11% (-6% in constant currency) to €1,006 million (Q1/20: €1,125 million). The constant currency decrease is primarily due to COVID-19 related headwinds. Both the EBIT margin before special items and the reported EBIT margin were 11.2% (Q1/20: 12.3%).
Group net interest before special items improved to -€137 million (Q1/202: -€174 million) mainly due to successful refinancing activities, lower interest rates as well as currency translation effects. Reported Group net interest also improved to -€137 million (Q1/20: -€182 million).
Both the Group tax rate before special items and the reported tax rate were 22.8% (Q1/20: 22.6%).
Both Noncontrolling interests before special items and reported noncontrolling interests were -€236 million (Q1/20: -€271 million) of which 95% were attributable to the noncontrolling interests in Fresenius Medical Care.
1 For estimated COVID-19 effects in Q1/21 and Q1/20 please see table in the PDF document.
2 Before special items
3 Net income attributable to shareholders of Fresenius SE & Co. KGaA
For a detailed overview of special items please see the reconciliation table in the PDF document.
Group net income1 before special items decreased by 6% (-2% in constant currency) to €435 million (Q1/202: €465 million). The absolute negative COVID-19 effect was more pronounced in Q1/21 compared to the prior-year quarter. Excluding estimated COVID-19 effects3, Group net income1 before special items would have grown 0% to 4% in constant currency (Q1/20: 6% to 10%). Reported Group net income1 decreased to €435 million (Q1/20: €459 million).
Earnings per share1 before special items decreased by 6% (-2% in constant currency) to €0.78 (Q1/202: €0.83). Reported earnings per share1 were also €0.78 (Q1/20: €0.82).
Continued investment in growth
Spending on property, plant and equipment was €384 million corresponding to 4% of sales (Q1/20: €547 million; 6% of sales). These investments served primarily for the modernization and expansion of dialysis clinics, production facilities as well as hospitals and day clinics.
Total acquisition spending was €149 million (Q1/20: €412 million), mainly for the acquisition of dialysis clinics at Fresenius Medical Care.
Cash flow development
Group operating cash flow decreased to €652 million (Q1/20: €878 million) with a margin of 7.3% (Q1/20: 9.6%), driven by a seasonal fluctuation in Fresenius Medical Care's invoicing and working capital movements in North America. Free cash flow before acquisitions and dividends decreased to €241 million (Q1/20: €305 million). Free cash flow after acquisitions and dividends increased to €117 million (Q1/20: -€40 million).
1 Net income attributable to shareholders of Fresenius SE & Co. KGaA
2 Before special items
3 For estimated COVID-19 effects in Q1/21 and Q1/20 please see table in the PDF document.
For a detailed overview of special items please see the reconciliation table in the PDF document.
Solid balance sheet structure
Group total assets increased by 3% (1% in constant currency) to €68,966 million (Dec. 31, 2020: €66,646 million) given currency translation effects and the expansion of business activities. Current assets increased by 6% (4% in constant currency) to €16,693 million (Dec. 31, 2020: €15,772 million), mainly driven by the increase of trade accounts receivables. Non-current assets increased by 3% (0% in constant currency) to €52,273 million (Dec. 31, 2020: €50,874 million).
Total shareholders’ equity increased by 6% (3% in constant currency) to €27,514 million (Dec. 31, 2020: €26,023 million). The equity ratio was 39.9% (Dec. 31, 2020: 39.0%).
Group debt increased by 2% (1% in constant currency) to €26,508 million (Dec. 31, 2020: € 25,913 million). Group net debt increased by 2% (1% in constant currency) to € 24,631 million (Dec. 31, 2020: € 24,076 million).
As of March 31, 2021, the net debt/EBITDA ratio increased to 3.52x1,2 (Dec. 31, 2020: 3.44x1,2) driven by COVID-19 effects weighing on EBITDA as well as increased net debt.
1 At LTM average exchange rates for both net debt and EBITDA; pro forma closed acquisitions/divestitures
2 Before special items
For a detailed overview of special items please see the reconciliation table in the PDF document.
Business Segments
Fresenius Medical Care (Financial data according to Fresenius Medical Care press release)
Fresenius Medical Care is the world's largest provider of products and services for individuals with renal diseases. As of March 31, 2021, Fresenius Medical Care was treating 344,476 patients in 4,110 dialysis clinics. Along with its core business, the Renal Care Continuum, the company focuses on expanding in complementary areas and in the field of critical care.

• Organic treatment growth impacted by COVID-19 pandemic as expected
• Reported revenue and earnings continued to be adversely affected by exchange rate effects
• Earnings development supported by phasing and expected lower SG&A expense anticipated to reverse throughout the year
• Financial targets for FY 2021 confirmed
Sales of Fresenius Medical Care decreased by 6% (increased by 1% in constant currency) to €4,210 million (Q1/20: €4,488 million). Thus, currency translation had a negative effect of 7%. Organic growth was 1%.
EBIT decreased by 15% (-8% in constant currency) to €474 million (Q1/20: €555 million) resulting in a margin of 11.3% (Q1/20: 12.4%). The decrease was mainly driven by effects from COVID-19 across all regions, higher personnel expenses and a significant negative exchange rate effect. Additionally, EBIT was negatively affected by a positive prior-year effect from the divestiture of cardiovascular clinics and a prior-year partial reversal of a revenue recognition adjustment. These negative effects were partially offset by an improved payor mix mainly driven by Medicare Advantage and expected lower SG&A expenses, which are anticipated to reverse in the remainder of the year.
1 Net income attributable to shareholders of Fresenius Medical Care AG & Co. KGaA
Net income1 decreased by 12% (-6% in constant currency) to €249 million (Q1/20: €283 million). Besides the above-mentioned operating earnings effects, net income was supported by a 27% decrease of net interest expense to €76 million (Q1/20: €104 million).
The first quarter 2020 included negative COVID-19 effects that reversed in Q2 2020, including the compensation received under the CARES Act, and therewith increase the base for the second quarter 2021. These base effects impact the phasing of net income growth in 2021.
Operating cash flow was €208 million (Q1/20: €584 million) with a margin of 4.9% (Q1/20: 13.0%). The decline was driven by the seasonality in invoicing and periodic delays in payment of public health care organizations.
For FY/21, Fresenius Medical Care confirms its outlook as outlined on February 23, 2021. The Company expects revenue2 to grow at a low-to-mid single-digit percentage range and net income1,3 to decline at a high-teens to mid-twenties percentage range against the 2020 base4.
For further information, please see Fresenius Medical Care’s press release at www.freseniusmedicalcare.com.
1 Net income attributable to shareholders of Fresenius Medical Care AG & Co. KGaA
2 FY/20 base: €17,859 million
3 FY/20 base: €1,359 million, before special items; FY/21: before special items
4 These targets are based on the 2020 results excluding the impairment of goodwill and trade names in the Latin America Segment of €195 million. They are inclusive of anticipated COVID-19 effects, in constant currency and exclude special items. Special items include costs related to FME25 and other effects that are unusual in nature and have not been foreseeable or not foreseeable in size or impact at the time of giving guidance.
Fresenius Kabi
Fresenius Kabi offers intravenously administered generic drugs, clinical nutrition and infusion therapies for seriously and chronically ill patients in the hospital and outpatient environments. The company is also a leading supplier of medical devices and transfusion technology products. In the biosimilars business, Fresenius Kabi develops products with a focus on oncology and autoimmune diseases.

• North America performance impacted by COVID-19 and temporary manufacturing issues
• Solid performance in Europe masked by prior-year COVID-19 related demand spike
• Emerging Markets showed strong sales and earnings growth; China with excellent performance given dynamic recovery of elective treatment activity
Sales decreased by 2% (increased by 4% in constant currency) to €1,761 million (Q1/20: €1,789 million). Organic growth was 3%. Negative currency translation effects of 6% were mainly related to weakness of the US dollar, the Brazilian real and the Argentinian peso.
Sales in North America decreased by 17% (organic growth: -9%) to €558 million (Q1/20: €669 million). The decrease was driven by fewer elective treatments, competitive pressure, missing sales from a customer in Chapter 11 as well as temporary manufacturing issues which outweighed extra demand for COVID-19 related products.
Sales in Europe decreased by 1% (organic growth: -1%) to €626 million (Q1/20: €631 million) mainly related to the strong demand for COVID-19 related drugs in the prior year quarter.
Sales in Asia-Pacific increased by 23% (organic growth: 26%) to €392 million (Q1/20: €319 million). The growth is mainly due to a dynamic recovery of elective procedures and a meaningful COVID-19 impact lowering the prior year basis in China as well as a growing recovery in other Asian markets.
1 Before special items
2 Net income attributable to shareholders of Fresenius SE & Co. KGaA
Sales in Latin America/Africa increased by 9% (organic growth: 28%) to €185 million (Q1/20: €170 million) due to ongoing COVID-19 related extra demand.
EBIT1 decreased by 4% (increased by 2% in constant currency) to €276 million (Q1/20: €289 million) with an EBIT margin of 15.7% (Q1/20:16.2%). The increase in constant currency was tempered by underutilized production capacities in the US, competitive pressure coupled with selective supply constraints due to temporary manufacturing issues and the missing contribution from sales to a customer now in Chapter 11. EBIT was supported by positive COVID-19 effects, lower corporate costs due to travel restrictions and phasing of projects.
Net income1,2 decreased by 4% (increased by 3% in constant currency) to €190 million (Q1/201: €197 million).
Operating cash flow increased to €278 million (Q1/20: €174 million) with a margin of 15.8% (Q1/20: 9.7%) mainly due to working capital improvements driven by cash collections.
For FY/21, Fresenius Kabi confirms its outlook and expects organic sales3 growth in a low-to-mid single-digit percentage range. Constant currency EBIT4 is expected to show a stable development up to low single-digit percentage growth. Both sales and EBIT outlook include expected COVID-19 effects.
1 Before special items
2 Net income attributable to shareholders of Fresenius SE & Co. KGaA
3 FY/20 base: €6,976 million
4 FY/20 base: €1,095 million, before special items; FY/21: before special items
Fresenius Helios
Fresenius Helios is Europe's leading private hospital operator. The company comprises Helios Germany and Helios Spain. Helios Germany operates 89 hospitals, ~130 outpatient centers and 6 prevention centers. Helios Spain operates 47 hospitals, 74 outpatient centers and around 300 occupational risk prevention centers. In addition, the company is active in Latin America with 6 hospitals and as a provider of medical diagnostics.

• Helios Spain delivers significant organic sales and earnings growth given recovery of treatment activity
• Helios Germany continues to be compensated by government for foregone elective treatments
• Growth additionally fueled by contributions from acquisitions in Germany and Latin America
Sales increased by 7% (8% in constant currency) to €2,649 million (Q1/20: €2,466 million). Organic growth was 4%. Acquisitions contributed 4% to sales growth.
Sales of Helios Germany increased by 4% (organic growth: 0%) to €1,673 million (Q1/20: €1,603 million). COVID-19 effects were mitigated by government compensation in regions with high COVID-19 incidences. The hospital acquisitions from the Order of Malta contributed 4% to sales growth.
Sales of Helios Spain increased by 13% (14% in constant currency) to €976 million (Q1/20: €863 million). Organic growth of 11% was driven by a strong recovery of elective procedures, a consistently high level of outpatient treatments and strong demand for occupational risk prevention (ORP) services. In addition, the hospitals in Latin America showed a strong performance. The hospital acquisitions in Colombia contributed 3% to sales growth.
EBIT of Fresenius Helios decreased by 2% (-1% in constant currency) to €268 million (Q1/20: €274 million) with an EBIT margin of 10.1% (Q1/20: 11.1%).
1 Net income attributable to shareholders of Fresenius SE & Co. KGaA
EBIT of Helios Germany decreased by 9% to €150 million (Q1/20: €165 million) with an EBIT margin of 9.0% (Q1/20: 10.3%). Government compensation broadly mitigated COVID-19 effects. The decrease was primarily caused by the impact of the carve-out of nursing expenses from the overall DRGs and the positive development of January and February last year.
EBIT of Helios Spain increased by 13% (14% in constant currency) to €126 million (Q1/20: €112 million) with an EBIT margin of 12.9% (Q1/20: 13.0%). Healthy organic sales growth led to a meaningfully improved coverage of the fixed cost base. The hospital acquisitions in Colombia made an additional contribution.
Net income1 decreased by 2% (-1% in constant currency) to €173 million (Q1/20: €176 million).
Operating cash flow increased to €215 million (Q1/20: €145 million) with a margin of 8.1% (Q1/20: 5.9%), mainly due to working capital improvements driven by cash collections.
For FY/21, Fresenius Helios confirms its outlook and expects organic sales2 growth in a low-to-mid single-digit percentage range and constant currency EBIT3 growth in a mid-to-high single-digit percentage range. Both sales and EBIT outlook include expected COVID-19 effects.
1 Net income attributable to shareholders of Fresenius SE & Co. KGaA
2 FY/20 base: €9,818 million
3 FY/20 base: €1,025 million; FY/21 before special items
Fresenius Vamed
Fresenius Vamed manages projects and provides services for hospitals and other health care facilities worldwide and is a leading post-acute care provider in Central Europe. The portfolio ranges along the entire value chain: from project development, planning, and turnkey construction, via maintenance and technical management to total operational management.

• Continued significant negative COVID-19 impact
• Project business marked by COVID-19 related delays, cancellations and global supply chain restraints
• Rehabilitation business remains impacted by fewer elective surgeries
• Technical high-end service business remains robust
Sales decreased by 4% (-4% in constant currency) to €477 million (Q1/20: €499 million). Organic growth was -4%.
Sales in the service business increased by 2% (2% in constant currency) to €363 million (Q1/20: €357 million). Sales in the project business decreased by 20% (-20% in constant currency) to €114 million (Q1/20: €142 million), driven by postponements and cancellations of projects.
EBIT decreased by 129% (-129% in constant currency) to -€4 million (Q1/20: €14 million) with an EBIT margin of -0.8% (Q1/20: 2.8%). Large parts of the post-acute care clinic capacities were left partially empty given a generally lower intake of elective surgery patients from acute-care hospitals. Health-authority-induced restrictions or even closures of facilities also had a negative effect. In the project business, project delays and global supply chain restraints triggered incremental expenses.
1 Net income attributable to shareholders of VAMED AG
Net income1 decreased to -€7 million (Q1/20: €7 million).
Order intake was €138 million (Q1/20: €124 million). As of March 31, 2021, order backlog was at €3,082 million (December 31, 2020: €3,055 million). Order intake continued to be marked by COVID-19 related cancellations and project delays.
Operating cash flow decreased to -€44 million (Q1/20: -€20 million) with a margin of -9.2% (Q1/20: -4.0%), mainly related to the lower net income contribution.
For FY/21, Fresenius Vamed confirms its outlook and expects organic sales2 growth in a mid-to-high single-digit percentage range and EBIT3 to grow to a high double-digit Euro million amount. Both sales and EBIT outlook include expected negative COVID-19 effects.
1 Net income attributable to shareholders of VAMED AG
2 FY/20 base: €2,068 million
3 FY/20 base: €29 million; FY/21 before special items
Conference Call
As part of the publication of the results for Q1/2021, a conference call will be held on May 6, 2021 at 1:30 p.m. CEDT (7:30 a.m. EDT). All investors are cordially invited to follow the conference call in a live broadcast over the Internet at www.fresenius.com/investors. Following the call, a replay will be available on our website.
For additional information on the performance indicators used please refer to our website https://www.fresenius.com/alternative-performance-measures.
This release contains forward-looking statements that are subject to various risks and uncertainties. Future results could differ materially from those described in these forward-looking statements due to certain factors, e.g. changes in business, economic and competitive conditions, regulatory reforms, results of clinical trials, foreign exchange rate fluctuations, uncertainties in litigation or investigative proceedings, and the availability of financing. Fresenius does not undertake any responsibility to update the forward-looking statements in this release.
The information and documents contained on the following pages of this website are for information purposes only. These materials do neither constitute an offer nor an invitation to subscribe to or to purchase securities, nor any investment advice or service, and are not meant to serve as a basis for any kind of obligation, contractual or otherwise. Securities may not be offered or sold in the United States of America (“US”) absent registration under the US Securities Act of 1933, as amended, or an exemption from registration. The securities described on the following pages are not offered for sale in the US or to "US persons" (as defined in Regulation S under the US Securities Act of 1933, as amended).
THE FOLLOWING INFORMATION AND DOCUMENTS ARE NOT DIRECTED AT AND ARE NOT INTENDED FOR USE BY (I) PERSONS WHO ARE RESIDENTS OF OR LOCATED IN THE US, CANADA, JAPAN OR AUSTRALIA OR WHO ARE US PERSONS (AS DEFINED IN REGULATION S UNDER THE US SECURITIES ACT OF 1933, AS AMENDED), OR (II) PERSONS IN ANY OTHER JURISDICTION WHERE THE COMMUNICATION OR RECEIPT OF SUCH INFORMATION IS RESTRICTED IN SUCH A WAY THAT PROVIDES THAT SUCH PERSONS SHALL NOT RECEIVE IT. SUCH PERSONS, OR PERSONS ACTING FOR THE BENEFIT OF ANY SUCH PERSONS, ARE NOT PERMITTED TO VISIT THE FOLLOWING PAGES OF THE WEBSITE.
To visit the following parts of this website you must confirm that
(i) you are not a resident of the United States of America, Canada, Japan or Australia or a "US person" (as defined in Regulation S under the US Securities Act of 1933, as amended),
(ii) you are not a person to whom the communication of the information contained on the website is restricted,
(iii) you will not distribute any of the information and documents contained thereon to any such person, and
(iv) you are not acting for the benefit of any such person.
By clicking on the "Accept" button below, you will be deemed to have made this confirmation.
NOT FOR RELEASE, PUBLICATION OR DISTRIBUTION, DIRECTLY OR INDIRECTLY, IN OR INTO THE UNITED STATES OF AMERICA, AUSTRALIA, CANADA OR JAPAN.
Fresenius today successfully placed bonds with an aggregate volume of €1.5 billion across three tranches:
- €500 million bonds with a maturity in October 2025 and an annual coupon of 0%,
- €500 million bonds with a maturity in October 2028 and an annual coupon of 0.5% and
- €500 million bonds with a maturity in October 2031 and an annual coupon of 0.875%.
The proceeds will be used for general corporate purposes, including refinancing of existing financial liabilities.
The bonds were drawn under the Fresenius Debt Issuance Program (DIP) and issued by Fresenius Finance Ireland plc., a wholly owned subsidiary of Fresenius SE & Co. KGaA. The company has applied to the Luxembourg Stock Exchange to admit the bonds to trading on its regulated market.
The envisaged settlement date is April 1, 2021.
This announcement does not contain or constitute an offer of, or the solicitation of an offer to buy or subscribe for, securities to any person in Australia, Canada, Japan, or the United States of America (the “United States”) or in any jurisdiction to whom or in which such offer or solicitation is unlawful. The securities referred to herein may not be offered or sold in the United States or to, or for the account or benefit of, U.S. persons, absent registration under the U.S. Securities Act of 1933, as amended (the “Securities Act”) except pursuant to an exemption from, or in a transaction not subject to, the registration requirements of the Securities Act. Subject to certain exceptions, the securities referred to herein may not be offered or sold in Australia, Canada or Japan or to, or for the account or benefit of, any national, resident or citizen of Australia, Canada or Japan. The offer and sale of the securities referred to herein has not been and will not be registered under the Securities Act or under the applicable securities laws of Australia, Canada or Japan. There will be no public offer of the securities in the United States.
This announcement is a general information and not a prospectus. Investors should not purchase or subscribe for any securities referred to in this announcement except on the basis of information in the prospectus to be issued by the company in connection with the offering of such securities. Copies of the prospectus will, following publication, be available free of charge from Fresenius SE & Co. KGaA at Else-Kröner Strasse 1, 61352 Bad Homburg, Germany.
This announcement has been prepared on the basis that any offer of securities in any Member State of the European Economic Area (EEA) will be made pursuant to the prospectus prepared by Fresenius SE & Co. KGaA, Fresenius Finance Ireland Public Limited Company and Fresenius Finance Ireland II Public Limited Company in combination with the relevant final terms relating to such securities or pursuant to an exemption under Regulation (EU) 1129/2017 (the Prospectus Regulation) from the requirement to publish a prospectus for offers of securities. Neither Fresenius SE & Co. KGaA, Fresenius Finance Ireland Public Limited Company nor Fresenius Finance Ireland II Public Limited Company have authorized, nor do they authorize, the making of any offer of securities in circumstances in which an obligation arises for Fresenius SE & Co. KGaA, Fresenius Finance Ireland Public Limited Company and Fresenius Finance Ireland II Public Limited Company or any other person to publish or supplement a prospectus for such offer.
This announcement is directed at and/or for distribution in the United Kingdom only to (i) persons who have professional experience in matters relating to investments falling within article 19(5) of the Financial Services and Markets Act 2000 (Financial Promotion) Order 2005 (the “Order”) or (ii) high net worth entities falling within article 49(2)(a) to (d) of the Order (all such persons are referred to herein as “relevant persons”). This announcement is directed only at relevant persons. Any person who is not a relevant person should not act or rely on this announcement or any of its contents. Any investment or investment activity to which this announcement relates is available only to relevant persons and will be engaged in only with relevant persons.
This announcement contains forward-looking statements that are subject to various risks and uncertainties. Future results could differ materially from those described in these forward-looking statements due to certain factors, e.g. changes in business, economic and competitive conditions, regulatory reforms, results of clinical trials, foreign exchange rate fluctuations, uncertainties in litigation or investigative proceedings, and the availability of financing. Neither Fresenius SE & Co. KGaA, Fresenius Finance Ireland Public Limited Company nor Fresenius Finance Ireland II Public Limited Company undertake any responsibility to update the forward-looking statements in this announcement.


The market research institute Potentialpark has honored the global healthcare group Fresenius for the tenth consecutive year as the German company with the best overall Internet offering for job applicants.
In Potentialpark’s 2021 study, Fresenius not only took first place in the overall category for all career-relevant online activities, but also won in the individual category of career assessment in social media. Fresenius finished second in the online application management and mobile offering category, and third for career website.
Potentialpark has carried out an annual study of German companies’ online offerings for job applicants since 2002. For this year’s study, Potentialpark assessed the online activities of 121 companies in Germany according to more than 300 criteria. More than 53,000 students and graduates around the world were surveyed about their preferences.
”Communication with job applicants has moved even more strongly into the virtual domain since the start of the coronavirus pandemic,” said Michael Lehmann, Senior Vice President Corporate Human Resources of Fresenius. “Hardly any in-person meetings can take place currently for job interviews or at job and trade fairs. It is therefore even more important for us to make up for this loss through online communications, and to reach new talent through exciting digital formats. Because even during the pandemic, we are continuing to hire new employees.”
This release contains forward-looking statements that are subject to various risks and uncertainties. Future results could differ materially from those described in these forward-looking statements due to certain factors, e.g. changes in business, economic and competitive conditions, regulatory reforms, results of clinical trials, foreign exchange rate fluctuations, uncertainties in litigation or investigative proceedings, and the availability of financing. Fresenius does not undertake any responsibility to update the forward-looking statements in this release.
- Preliminary guidance for 2021 confirmed
- Strategic roadmap for accelerated growth through 2023 and beyond
- Group-wide initiatives to improve efficiency and profitability in preparation
- Medium-term growth targets confirmed
- 28th consecutive dividend increase proposed
If no timeframe is specified, information refers to Q4/2020 2020 and 2019 according to IFRS 16

1 Before special items
2 Net income attributable to shareholders of Fresenius SE & Co. KGaA
For a detailed overview of special items please see the reconciliation tables in the PDF document.
Stephan Sturm, CEO of Fresenius, said:” The pandemic year 2020 showed emphatically the importance of forward-thinking, effective and efficient healthcare. Fresenius is making a vital contribution here, in many different areas of medicine. This year, the pandemic will again present us with a number of challenges, making it even more important that we increase efficiency in order to improve our cost base. Beyond our established businesses, we will also expand in important growth areas including biosimilars, digital healthcare, home dialysis and fertility medicine. By doing so, we are laying the foundations for more dynamic growth in the coming years. Even though the pandemic and its consequences are keeping us busy right now, we are already looking ahead and setting the course for the medicine of the future. In this way, we are also securing our company’s sustainable economic success.”
FY/21 Group guidance
For FY/21, Fresenius projects sales growth1 in a low to mid-single-digit percentage range and at least broadly stable net income2,3 year-over-year, both in constant currency. Implicitly, net income2 for the Group excluding Fresenius Medical Care is expected to grow in a mid-to high single digit percentage range in constant currency. Fresenius projects net debt/EBITDA4 to be around the top-end of the self-imposed target corridor of 3.0x to 3.5x by the end of FY/21.
COVID-19 assumptions for guidance FY/21
COVID-19 will continue to impact Fresenius’ operations in 2021. Current burdens and constraints caused by COVID-19 are expected to recede only in H2/21. The expected improvement in the Group’s relevant business environment from H2/21 is heavily dependent on continuously increasing levels of vaccination coverage in Fresenius’ relevant markets. These assumptions are subject to considerable uncertainty.
Fresenius closely monitors the development of COVID-19 case numbers, and the associated various containment measures being enacted in many of the Company’s relevant markets. A possible significant deterioration of the situation associated with further containment measures that could have a significant and direct impact on the health care sector without any appropriate compensation is not reflected in the Group’s FY/21 guidance.
1 FY/20 base: €36,277 million
2 Net income attributable to shareholders of Fresenius SE & Co. KGaA
3 FY/20 base: €1,796 million; before special items; FY/21: before special items
4 At LTM average exchange rates for both net debt and EBITDA; pro forma closed acquisitions/divestitures; excluding further potential acquisitions; before special items
For a detailed overview of special items please see the reconciliation tables in the PDF document.
Efficiency and cost saving programs
COVID-19 has led and will lead to a shortfall relative to our original expectations in FY/20 and FY/21 as well as to ongoing incremental uncertainty. Fresenius is hence planning to launch group-wide strategic efficiency initiatives to further safeguard the confirmed medium-term targets and sustainably enhance profitability. These initiatives are expected to consist of operational excellence and cost-saving measures, targeted strengthening of future growth areas and portfolio optimizations. The operational excellence and cost-saving measures are targeted to result in cost savings of at least €100 million p.a. after tax and minority interest in 2023 with some further potential to increase thereafter. We anticipate that achieving these sustainable efficiencies will require significant up-front expenses. On average for the years 2021 to 2023, those expenses are expected to be in the order of magnitude of €100 million p.a. after tax and minority interest. They will be classified as special items. Further information will be provided during our Q1 earnings call on May 6, 2021.
Growth targets for 2020 – 2023 confirmed
Fresenius continues to expect Group sales to grow organically with a compounded annual growth rate (CAGR) of 4% to 7% during 2020 to 2023. Group net income1,2 is projected to increase organically with a CAGR of 5% to 9% during 2020 to 2023. Fresenius expects its sales growth and efficiency improvement initiatives as well as Fresenius Kabi’s biosimilars business to drive an acceleration of Group earnings growth over that period. Small and medium-sized acquisitions are expected to contribute an incremental CAGR of approx. 1%-point to both sales and net income growth.
28th consecutive dividend increase proposed
The Management Board of Fresenius will propose to the Supervisory Board a dividend increase of 5% to €0.88 per share for FY/20 (FY/19: €0.84). Provided the proposal is approved by the Supervisory Board and the Annual General Meeting, this will be the 28th consecutive dividend increase.
1 Net income attributable to shareholders of Fresenius SE & Co. KGaA
2 Before special items
For a detailed overview of special items please see the reconciliation tables in the PDF document.
5% sales growth in constant currency
Group sales remained on prior year’s level (increased by 5% in constant currency) at €9,304 million (Q4/19: €9,311 million). Organic growth was 2%. Acquisitions/ divestitures contributed net 3% to growth. Currency translation reduced sales growth by 5%. Excluding estimated COVID-19 effects1, Group sales growth would have been 7% to 8% in constant currency.
In FY/20, Group sales increased by 2% (5% in constant currency) to €36,277 million (FY/19: €35,409 million). Organic growth was 3%. Acquisitions/divestitures contributed net 2% to sales growth. Currency translation reduced sales growth by 3%. Excluding estimated COVID-19 effects1, Group sales growth would have been 7% to 8% in constant currency.
2% net income2,3 growth in constant currency
Group EBITDA before special items decreased by 3% (increased by 3% in constant currency) to €1,886 million (Q4/192: €1,937 million). Reported Group EBITDA was €1,854 million (Q4/19: €1,937 million).
In FY/20, Group EBITDA before special items remained on prior year’s level (increased by 2% in constant currency) at €7,132 million (FY/192: €7,104 million). Reported Group EBITDA was €7,100 million (FY/19: €7,083 million).
Group EBIT before special items decreased by 3% (increased by 2% in constant currency) to €1,251 million (Q4/192: €1,287 million). The constant currency increase is due to the positive development at Fresenius Medical Care and Fresenius Helios. Missing contributions from elective procedures, volume headwinds leading to underutilized production capacities, headwinds at Fresenius Kabi North America, COVID-19 related project delays at Fresenius Vamed as well as Group-wide incremental COVID-19 related expenses weighed on EBIT. The EBIT margin before special items was 13.4% (Q4/192: 13.8%). Reported Group EBIT was €1,024 million (Q4/19: €1,269 million). In FY/20, Group EBIT before special items decreased by 2% (0% in constant currency) to €4,612 million (FY/192: €4,688 million). The EBIT margin before special items was 12.7% (FY/192: 13.2%). Higher levels of investments in recent years triggered incremental depreciation charges. Reported Group EBIT was €4,385 million (FY/19: €4,631 million).
Group net interest before special items improved to -€159 million (Q4/192: -€182 million) mainly due to successful refinancing activities, lower interest rates as well as currency translation effects. Reported Group net interest improved to -€156 million (Q4/19: -€184 million).
1 For estimated COVID-19 effects in Q4/20 and FY/20 please see table on page 18 in the PDF document.
2 Before special items
3 Net income attributable to shareholders of Fresenius SE & Co. KGaA
For a detailed overview of special items please see the reconciliation tables in the PDF document.
In FY/20, Group net interest before special items improved to -€654 million (FY/191: - €714 million) while reported Group net interest improved to -€659 million (FY/19: -€719 million).
The Group tax rate before special items was 24.1% (Q4/191: 23.8%) and the reported Group tax rate was 29.4% (Q4/19: 23.0%). The increase is due to a not tax deductible €195 million impairment of goodwill and tradenames in the Latin America segment at Fresenius Medical Care. In FY/20, the Group tax rate before special items was 23.1% (FY/191: 23.3%) and the reported Group tax rate was 24.2% (FY/19: 22.6%).
Noncontrolling interests before special items were €335 million (Q4/191: €336 million) of which 93% were attributable to the noncontrolling interests in Fresenius Medical Care. Reported noncontrolling interests were €203 million (Q4/19 reported: €320 million). In FY/20, noncontrolling interests before special items were €1,248 million (FY/191: €1,170 million) of which 96% were attributable to the noncontrolling interests in Fresenius Medical Care. Reported noncontrolling interests were €1,116 million (FY/19 reported: €1,146 million).
Group net income2 before special items decreased by 2% (increased by 2% in constant currency) to €494 million (Q4/19: €506 million). Excluding estimated COVID-19 effects3, Group net income2 before special items would have grown 3% to 7% in constant currency. Reported Group net income2 decreased to €410 million (Q4/19: €515 million). The decrease is mainly due to an impairment of goodwill and tradenames in the Latin America segment at Fresenius Medical Care and the increased valuation of the biosimilars contingent purchase price liabilities at Fresenius Kabi. In FY/20, Group net income2 before special items decreased by 4% (-3% in constant currency) to €1,796 million (FY/191: €1,879 million). Excluding estimated COVID-19 effects3, Group net income2 before special items would have grown 2% to 6% in constant currency. Reported Group net income2 decreased to €1,707 million (FY/19: €1,883 million).
Earnings per share2 before special items decreased by 2% (increased by 2% in constant currency) to €0.88 (Q4/191: €0.90). Reported earnings per share2 were €0.73 (Q4/19: €0.92). In FY/20, earnings per share2 before special items decreased by 4% (-3% in constant currency) to €3.22 (FY/191: €3.37). Reported earnings per share2 were €3.06 (FY/191: €3.38).
1 Before special items
2 Net income attributable to shareholders of Fresenius SE & Co. KGaA
3 For estimated COVID-19 effects in Q4/20 and FY/20 please see table on page 18 in the PDF document.
For a detailed overview of special items please see the reconciliation tables in the PDF document.
Continued investment in growth
Spending on property, plant and equipment was €856 million corresponding to 9% of sales (Q4/19: €871 million; 9% of sales). These investments served primarily for the modernization and expansion of dialysis clinics, production facilities as well as hospitals and day clinics. Despite the COVID-19 pandemic, Fresenius has been largely able to continue its investment programs. In FY/20, spending on property, plant and equipment was €2,398 million corresponding to 7% of sales (FY/19: €2,463 million; 7% of sales).
Total acquisition spending was €251 million (Q4/19: €331 million). In FY/20, total acquisition spending was €902 million, mainly for the purchase of hospitals by Fresenius Helios in Germany and Colombia (FY/19: €2,623 million, mainly for the acquisition of NxStage by Fresenius Medical Care).
Good cash flow development
Group operating cash flow increased to €1,390 million (Q4/19: €1,286 million) with a margin of 14.9% (Q4/19: 13.8%). Free cash flow before acquisitions and dividends increased to €590 million (Q4/19: €442 million). Free cash flow after acquisitions and dividends increased to €329 million (Q4/19: €89 million).
In FY/20, Group operating cash flow increased to €6,549 million (FY/19: €4,263 million) with a margin of 18.1% (FY/19: 12.0%). The increase was largely driven by Fresenius Medical Care due to the U.S. federal relief funding and advanced payments under the Coronavirus Aid, Relief and Economic Security Act (CARES Act) as well as by the shorter payment periods of the COVID-19 governmental compensation and reimbursement scheme for Helios Germany. Also excluding these COVID-19 effects, Group operating cash flow would have grown year-over-year. Free cash flow before acquisitions and dividends increased to €4,183 million (FY/19: €1,830 million). Free cash flow after acquisitions and dividends increased to €2,478 million (FY/19: -€1,545 million, driven by Fresenius Medical Care’s acquisition of NxStage).
Solid balance sheet structure
Group total assets decreased by 1% (increased by 5% in constant currency) to €66,646 million (Dec. 31, 2019: €67,006 million). The decrease is mainly due to currency translation effects outweighing the expansion of business activities. Current assets increased by 3% (10% in constant currency) to €15,772 million (Dec. 31, 2019: €15,264 million), mainly driven by the increase of cash and cash equivalents. Non-current assets decreased by 2% (increased by 3% in constant currency) to €50,874 million (Dec. 31, 2019: €51,742 million).
Total shareholders’ equity decreased by 2% (increased by 6% in constant currency) to €26,023 million (Dec. 31, 2019: €26,580 million). The equity ratio was 39.0% (Dec. 31, 2019: 39.7%).
Group debt decreased by 5% (-2% in constant currency) to €25,913 million (Dec. 31, 2019: € 27,258 million). Group net debt decreased by 6% (-4% in constant currency) to € 24,076 million (Dec. 31, 2019: € 25,604 million), driven by the exceptional cash flow development.
As of December 31, 2020, the net debt/EBITDA ratio improved to 3.44x1,2 (Dec. 31, 2019: 3.61x1,2) driven by the exceptional cash flow development, despite COVID-19 effects weighing on EBITDA.
1 At LTM average exchange rates for both net debt and EBITDA; pro forma closed acquisitions/divestitures
2 Before special items
For a detailed overview of special items please see the reconciliation tables on pages 20-22 in the PDF document.
Business Segments
Fresenius Medical Care (Financial data according to Fresenius Medical Care press release)
Fresenius Medical Care is the world's largest provider of products and services for individuals with renal diseases. As of December 31, 2020, Fresenius Medical Care was treating 346,553 patients in 4,092 dialysis clinics. Along with its core business, the Renal Care Continuum, the company focuses on expanding in complementary areas and in the field of critical care.

- 2020 financial targets achieved: 5% revenue and 12% net income growth
- Reported earnings in Q4 negatively impacted by impairment in the Latin America region and accelerated excess mortality due to COVID-19
- Growth in home dialysis on track
Sales of Fresenius Medical Care decreased by 4% (increased by 4% in constant currency) to €4,400 million (Q4/19: €4,580 million). Thus, currency translation had a negative effect of 8%. Organic growth was 1%. Acquisitions/divestitures contributed net 3% to growth. In FY/20, Fresenius Medical Care increased sales by 2% (5% in constant currency) to €17,859 million (FY/19: €17,477 million). Thus, currency translation had a negative effect of 3%. Organic growth was 3%. Acquisitions/divestitures contributed net 2% to growth.
Reported EBIT decreased by 25% (-18% in constant currency) to €462 million (Q4/19: €616 million). The decrease was mainly due to a macro-economic driven impairment of goodwill and tradenames in the Latin America segment, unfavorable COVID-19 effects and a lower reimbursement for calcimimetics. The reported EBIT margin was 10.5% (Q4/19: 13.5%). EBIT on an adjusted basis decreased by 1% (increased by 5% in constant currency) to €657 million (Q4/19: €663 million). The EBIT margin on an adjusted basis was 14.9% (Q4/19: 14.5%).
In FY/20, reported EBIT increased by 2% (4% in constant currency) to €2,304 million (FY/19: €2,270 million). The reported EBIT margin was 12.9% (FY/19: 13.0%). EBIT on an adjusted basis increased by 6% (8% in constant currency) to €2,499 million (FY/19: €2,356 million). The EBIT margin on an adjusted basis was 14.0% (FY/19: 13.5%).
1 Before special items
2 Net income attributable to shareholders of Fresenius Medical Care AG & Co. KGaA
For a detailed overview of special items please see the reconciliation tables on pages 20-22 in the PDF document.
Reported net income1 decreased by 48% (-43% in constant currency) to €177 million (Q4/19: €343 million) and increased on an adjusted basis by 1% (6% in constant currency) to €372 million (Q4/19: €368 million). In FY/20, reported net income1 decreased by 3% (-1% in constant currency) to €1,164 million (FY/19: €1,200 million) and increased on an adjusted basis by 10% (12% in constant currency) to €1,359 million (FY/19: €1,236 million).
Operating cash flow was €584 million (Q4/19: €771 million) with a margin of 13.3% (Q4/19: 16.8%). In FY/20, operating cash flow was €4,233 million (FY/19: €2,567 million) with a margin of 23.7% (FY/19: 14.7%). The increase was largely driven by the U.S. federal relief funding and advanced payments under the CARES Act and other COVID-19 relief, as well as working capital improvements driven by cash collections.
For FY/21, Fresenius Medical Care expects revenue2 to grow at a low- to mid-single digit percentage range and net income1,3 to decline at a high-teens to mid-twenties percentage range against the higher than expected 2020 base4.
For further information, also on the FME25 program, please see Fresenius Medical Care’s press release at www.freseniusmedicalcare.com.
1 Net income attributable to shareholders of Fresenius Medical Care AG & Co. KGaA
2 FY/20 base: €17,859 million
3 FY/20 base: €1,359 million, before special items; FY/21: before special items
4 These targets are based on the 2020 results excluding the impairment of goodwill and trade names in the Latin America Segment of €195 million. They are inclusive of anticipated COVID-19 effects, in constant currency and exclude special items. Special items include costs related to FME25 and other effects that are unusual in nature and have not been foreseeable or not foreseeable in size or impact at the time of giving guidance.
For a detailed overview of special items please see the reconciliation tables on pages 20-22 in the PDF document.
Fresenius Kabi
Fresenius Kabi offers intravenously administered generic drugs, clinical nutrition and infusion therapies for seriously and chronically ill patients in the hospital and outpatient environments. The company is also a leading supplier of medical devices and transfusion technology products. In the biosimilars business, Fresenius Kabi develops products with a focus on oncology and autoimmune diseases.

- In North America fewer elective treatments, competitive pressure and temporary manufacturing issues outweighed extra demand for COVID-19 related products
- Europe showed strong organic sales growth in Q4 primarily based on extra demand for COVID-19 related products; China with healthy organic growth
- Strong EBIT growth in Emerging Markets with positive development in China only partially compensates EBIT decrease in North America
Sales increased by 3% (8% in constant currency) to €1,815 million (Q4/19: €1,766 million). Organic growth was 7%. Negative currency translation effects of 5% were mainly related to weakness of the US dollar, the Brazilian real and the Argentinian peso. Estimated COVID-19 effects made a slight positive contribution to sales growth. In FY/20, sales increased by 1% (4% in constant currency) to €6,976 million (FY/19: €6,919 million). Organic growth was 4%. Negative currency translation effects of 3% were mainly related to the weakness of the US dollar, the Brazilian real and the Argentinian peso. Estimated COVID-19 effects slightly reduced sales growth.
Sales in North America decreased by 10% (organic growth: -3%) to €549 million (Q4/19: €609 million). The decrease was driven by fewer elective treatments, supply constraints for certain products due to temporary manufacturing issues and competitive pressure, which outweighed extra demand for COVID-19 related products. In FY/20, sales in North America decreased by 2% (organic growth: 0%) to €2,376 million (FY/19: €2,424 million). Sales in Europe increased by 13% (organic growth: 9%) to €680 million (Q4/19: €604 million) mainly due to increased demand for COVID-19 related products. In FY/20, sales in Europe increased by 6% (organic growth: 6%) to €2,458 million (FY/19: €2,313 million). Sales in Asia-Pacific increased by 11% (organic growth: 14%) to €428 million (Q4/19: €385 million). While China saw a solid recovery based on increasing elective procedures, other Asian markets were lagging behind. In FY/20, sales in Asia-Pacific decreased by 1% (organic growth: 1%) to €1,497 million (FY/19: €1,506 million). Sales in Latin America/Africa decreased by 6% (organic growth: 16%) to €158 million (Q4/19: €168 million). In FY/20, sales in Latin America/Africa decreased by 5% (organic growth: 17%) to €645 million (FY/19: €676 million).
1 Before special items
2 Net income attributable to shareholders of Fresenius SE & Co. KGaA
For a detailed overview of special items please see the reconciliation tables on pages 20-22 in the PDF document.
EBIT before special items decreased by 17% (-10% in constant currency) to €236 million (Q4/191: €285 million) with an EBIT margin before special items of 13.0% (Q4/191:16.1%). The decline is driven by headwinds leading to some underutilized production capacities in the US, coupled with selective supply constraints due to temporary manufacturing issues, incremental COVID-19 related expenses, competitive pressure, a negative effect due to the bankruptcy of a customer as well as planned SG&A spending ahead of the launch of the company’s first US biosimilar. Lower corporate costs due to travel restrictions and phasing of projects partially offset the decline. Estimated COVID-19 effects had a moderate negative impact on EBIT growth in Q4/20. In FY/20, EBIT before special items decreased by 9% (-6% in constant currency) to €1,095 million (FY/191: €1,205 million) with an EBIT margin before special items of 15.7% (FY/191: 17.4%). Estimated COVID-19 effects had an insignificant impact on EBIT growth in FY/20.
Net income1,2 decreased by 19% (-11% in constant currency) to €148 million (Q4/191: €183 million). In FY/20, net income1,2 decreased by 8% (-5% in constant currency) to €730 million (FY/191: €797 million).
Operating cash flow increased to €307 million (Q4/19: €291 million) with a margin of 16.9% (Q4/19: 16.5%). In FY/20, operating cash flow increased by 11% to €1,143 million (FY/19: €1,028 million) with a margin of 16.4% (FY/19: 14.9%) due to the favorable working capital development.
For FY/21, Fresenius Kabi expects organic sales3 growth in a low to mid-single digit percentage range. Constant currency EBIT4 is expected to show a stable development up to low single digit percentage growth. Both sales and EBIT outlook include expected COVID-19 effects.
1 Before special items
2 Net income attributable to shareholders of Fresenius SE & Co. KGaA
3 FY/20 base: €6,976 million
4 FY/20 base: €1,095 million, before special items, FY/21: before special items
For a detailed overview of special items please see the reconciliation tables on pages 20-22 in the PDF document.
Fresenius Helios
Fresenius Helios is Europe's leading private hospital operator. The company comprises Helios Germany and Helios Spain (Quirónsalud). Helios Germany operates 89 hospitals, ~130 outpatient centers and 6 prevention centers. Quirónsalud operates 46 hospitals, 70 outpatient centers and around 300 occupational risk prevention centers. In addition, the company is active in Latin America with 6 hospitals and as a provider of medical diagnostics.

- Recovery of elective procedures in Spain in Q4
- Continued financial support provided by German government throughout Q4
- Helios Spain with strong organic sales and EBIT growth based on catch-up effects additionally fueled by contributions from acquisitions in Latin America
Sales increased by 13% (13% in constant currency) to €2,637 million (Q4/19: €2,344 million). Organic growth was 9%. Acquisitions contributed 4% to sales growth. COVID-19 effects had an insignificant effect on organic growth. In FY/20, sales increased by 6% (7% in constant currency) to €9,818 million (FY/19: €9,234 million). Organic growth was 4%. Acquisitions contributed 3% to sales growth. COVID-19 effects had a slight negative impact on organic growth.
Sales of Helios Germany increased by 11% (organic growth: 8%) to €1,637 million (Q4/19: €1,475 million). In FY/20, sales of Helios Germany increased by 7% (organic growth: 6%) to €6,340 million (FY/19: €5,940 million). COVID-19 effects were mitigated by government financial support and hence had only a slight negative impact on organic growth in both Q4/20 and FY/20.
Sales of Helios Spain increased by 15% (17% in constant currency) to €999 million (Q4/19: €867 million). Organic growth of 11% was driven by a strong recovery of elective procedures and a consistently high level of outpatient treatments. Thus, COVID-19 effects had a moderate positive impact on organic growth in Q4. The hospital acquisitions in Colombia contributed 6% to sales growth. In FY/20, sales of Helios Spain increased by 6% (7% in constant currency) to €3,475 million (FY/19: €3,292 million). Organic growth was 2%. Acquisitions contributed 5% to sales growth. COVID-19 effects had a significant negative impact on organic sales growth.
1 Net income attributable to shareholders of Fresenius SE & Co. KGaA
EBIT of Fresenius Helios increased by 12% (13% in constant currency) to €328 million (Q4/19: €294 million) with an EBIT margin of 12.4% (Q4/19: 12.5%). COVID-19 effects, in particular due to the strong recovery of elective procedures in Spain, had a significant positive effect on EBIT growth in Q4. In FY/20, EBIT of Fresenius Helios remained on prior year’s level (0% in constant currency) at €1,025 million (FY/19: €1,025 million) with an EBIT margin of 10.4% (FY/19: 11.1%). COVID-19 effects had a moderate negative impact on EBIT growth.
EBIT of Helios Germany increased by 10% to €157 million (Q4/19: €143 million) with an EBIT margin of 9.6% (Q4/19: 9.7%). Financial support provided by the German government under revised regulations focusing on regions with high COVID incidences broadly offset additional headwinds as Helios Germany continued to play a crucial role in treating COVID-19 patients. In FY/20, EBIT of Helios Germany increased by 4% to €602 million (FY/19: €577 million) with an EBIT margin of 9.5% (FY/19: 9.7%). Due to the comprehensive financial support provided by the German government, COVID-19 effects had an overall insignificant impact on the EBIT development.
EBIT of Helios Spain increased by 17% (19% in constant currency) to €159 million (Q4/19: €136 million) with an EBIT margin of 15.9% (Q4/19: 15.7%). The growth is driven by a recovery of elective procedures following the government-ordered postponement of planned surgical procedures in Q2, where medically justifiable. Thus, COVID-19 effects had a significant positive effect on EBIT growth in Q4. In FY/20, EBIT of Helios Spain decreased by 5% (-5% in constant currency) to €420 million (FY/19: €443 million) with an EBIT margin of 12.1% (FY/19: 13.5%). COVID-19 effects had a very significant negative impact on EBIT growth with missing or delayed elective procedures and higher expenses amid the comprehensive efforts to combat the pandemic.
Net income1 increased by 14% to €225 million (Q4/19: €197 million). In FY/20, net income1 remained on prior year’s level at €666 million (FY/19: €664 million).
Operating cash flow increased to €434 million (Q4/19: €226 million) with a margin of 16.5% (Q4/19: 9.6%), driven by phasing of payments under the German law to ease the financial burden on hospitals. In FY/20, operating cash flow increased to €1,149 million (FY/19: €733 million) with a margin of 11.7% (FY/19: 7.9%).
1 Net income attributable to shareholders of Fresenius SE & Co. KGaA
For FY/21, Fresenius Helios expects organic sales1 growth in a low to mid-single digit percentage range and constant currency EBIT2 growth in a mid to high single digit percentage range. Both sales and EBIT outlook include expected COVID-19 effects.
1 FY/20 base: €9,818 million
2 FY/20 base: €1,025 million; FY/21 before special items
Fresenius Vamed
Fresenius Vamed manages projects and provides services for hospitals and other health care facilities worldwide and is a leading post-acute care provider in Central Europe. The portfolio ranges along the entire value chain: from project development, planning, and turnkey construction, via maintenance and technical management to total operational management.

- Significant COVID-19 impact in the project business related to delays, cancellations and global supply chain restraints continued
- Good order intake in Q4 indicates first signs of recovery in project business
- Rehabilitation business continued to be impacted by less demand for rehabilitation treatments and postponements of elective surgeries; technical service business remained robust
Sales decreased by 22% (-22% in constant currency) to €577 million (Q4/19: €737 million). Organic growth was -22%. Acquisitions did not contribute to growth. Estimated COVID-19 effects had a very significant negative impact on growth. In FY/20, sales decreased by 6% (-6% in constant currency) to €2,068 million (FY/19: €2,206 million). Organic growth was -8%. Acquisitions contributed 2% to growth. Estimated COVID-19 effects had a very significant negative impact on growth.
Sales in the service business decreased by 1% to €372 million (Q4/19: €374 million).
Sales in the project business decreased by 44% to €205 million (Q4/19: €363 million), driven by postponements and cancellations of projects. In FY/20, sales in the service business grew by 3% to €1,435 million (FY/19: €1,399 million). Sales in the project business decreased by 22% to €633 million (FY/19: €807 million).
1 Net income attributable to shareholders of VAMED AG
EBIT decreased by 42% (-42% in constant currency) to €39 million (Q4/19: €67 million) with an EBIT margin of 6.8% (Q4/19: 9.1%). Estimated COVID-19 effects had a very significant negative impact on EBIT. Capacities in the post-acute care clinics were left partially empty given a generally lower intake of elective surgery patients from acute-care hospitals. Authority-instigated restrictions or even closures of individual facilities also had a negative effect. In the project business, project delays and global supply chain restraints triggered incremental expenses. In FY/20, EBIT decreased by 78% (-79% in constant currency) to €29 million (FY/19: €134 million) with an EBIT margin of 1.4% (FY/19: 6.1%). Estimated COVID-19 effects had a very significant negative impact on EBIT.
Net income1 decreased to €25 million (Q4/19: €44 million). In FY/20, net income1 decreased to €2 million (FY/19: €83 million).
Order intake was €648 million in Q4/20 (Q4/19: €576 million) and €1,010 million in FY/20 (FY/19: €1,314 million). As of December 31, 2020, order backlog was at €3,055 million (December 31, 2019: €2,865 million). Order intake and order backlog were marked by COVID-19 related cancellations and project delays.
Operating cash flow increased to €74 million (Q4/19: €0 million) with a margin of 12.8% (Q4/19: 0%), driven by a favorable working capital development mainly related to pre-payments. In FY/20, operating cash flow increased to €78 million (FY/19: -€17 million) with a margin of 3.8% (FY/19: -0.8%).
For FY/21, Fresenius Vamed expects organic sales2 growth in a mid to high single digit percentage range and EBIT3 to grow to a high double-digit euro million amount. Both sales and EBIT outlook include expected negative COVID-19 effects.
1 Net income attributable to shareholders of VAMED AG
2 FY/20 base: €2,068 million
3 FY/20 base: €29 million; FY/21 before special items
Conference Call
As part of the publication of the results for FY 2020, a conference call will be held on February 23, 2021 at 1:30 p.m. CET (7:30 a.m. EST). All investors are cordially invited to follow the conference call in a live broadcast over the Internet at www.fresenius.com/investors. Following the call, a replay will be available on our website.
For additional information on the performance indicators used please refer to our website https://www.fresenius.com/alternative-performance-measures.
This release contains forward-looking statements that are subject to various risks and uncertainties. Future results could differ materially from those described in these forward-looking statements due to certain factors, e.g. changes in business, economic and competitive conditions, regulatory reforms, results of clinical trials, foreign exchange rate fluctuations, uncertainties in litigation or investigative proceedings, and the availability of financing. Fresenius does not undertake any responsibility to update the forward-looking statements in this release.