

Environment
As a healthcare Group, Fresenius feels a responsibility to protect the environment and use natural resources carefully because only a healthy environment can be a home for healthy people. It is important to avoid possible negative effects on the environment and health. To this end, we identify and evaluate potential hazards and take the necessary measures to protect the environment.
Since the requirements in our healthcare products and healthcare services market segments differ, environmental management is decentralized and organized according to the business model of the business segments. The common foundation of our environmental management approaches is the ISO 14001 standard. All business segments have implemented local, regional, or global management systems that take into account the respective business models and adapt processes accordingly.
Water management
For decades, water consumption has been increasing worldwide and water shortages are occurring in more and more regions. We, too, need this resource at our production plants and in our healthcare facilities and want to handle it responsibly. We work with management systems and control systems globally to ensure that water quality meets internal and external regulatory requirements.
It is our ambition that water in any area of our business can be used safely and that it is sufficiently available at all times. We further aim to avoid unnecessarily polluting the sources from which we obtain water or into which we discharge our wastewater.
Climate protection: energy and emissions
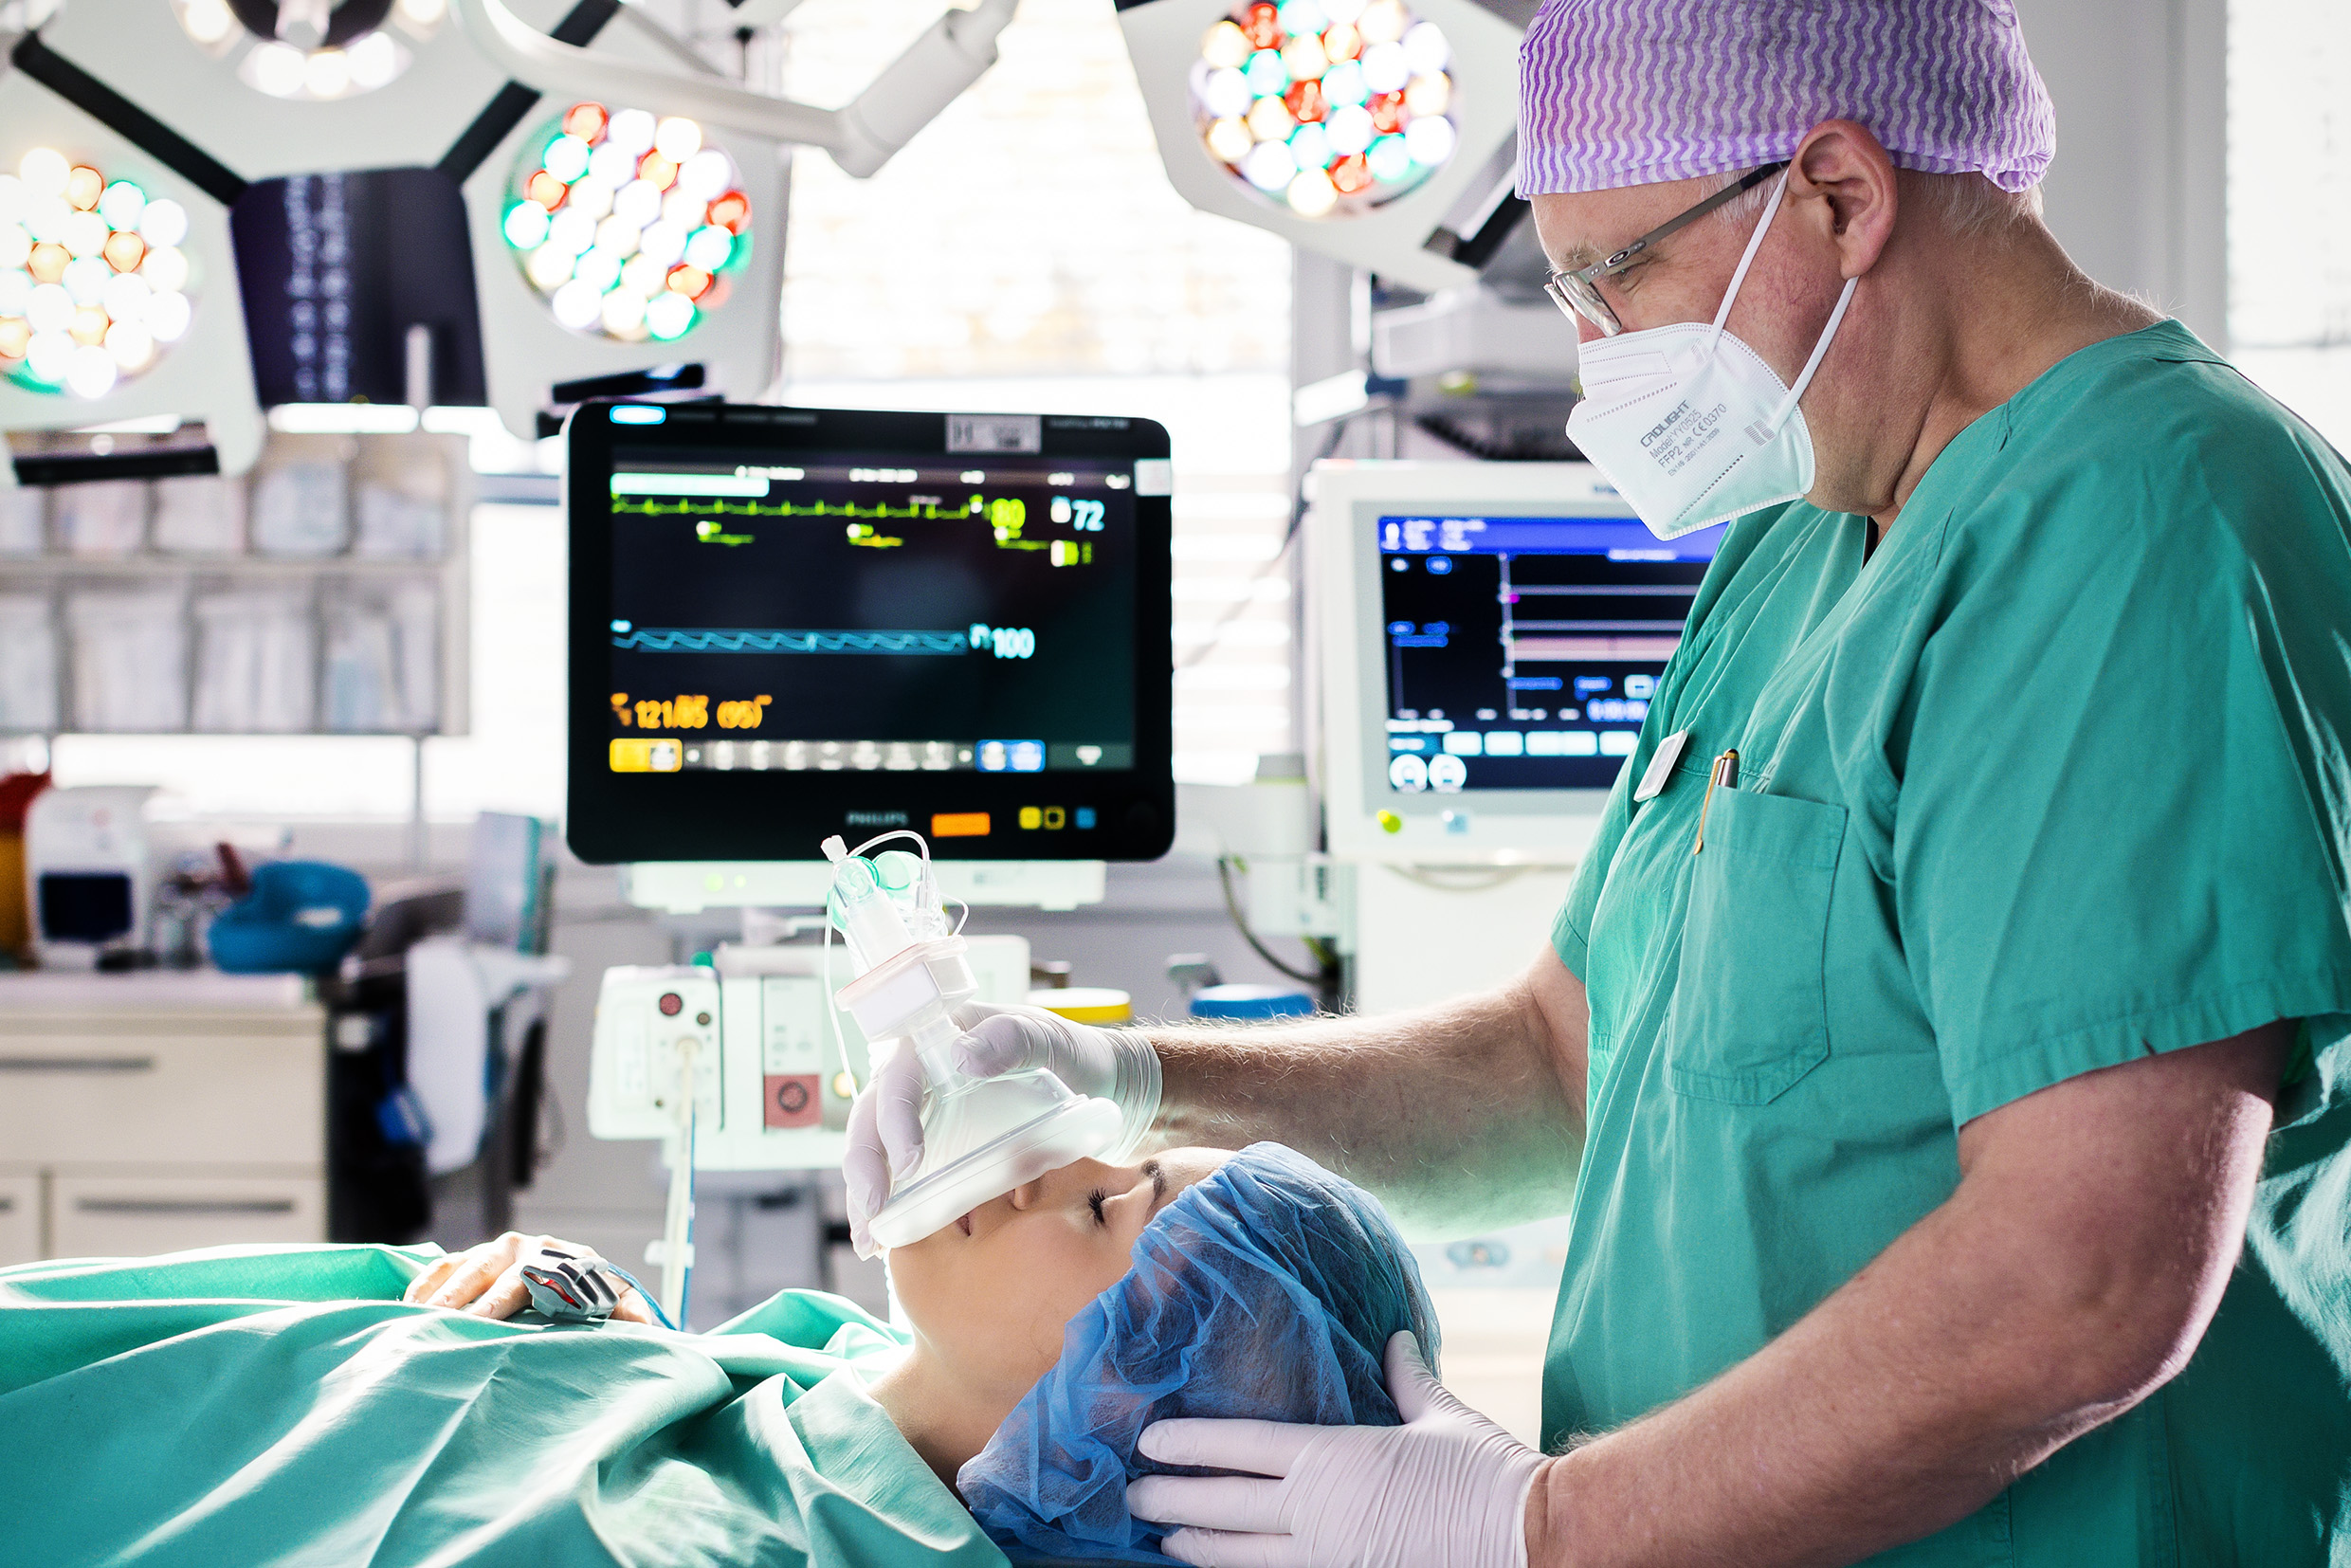
Climate change and its effects are also impacting Fresenius: in healthcare facilities, we have to prepare for rising temperatures and the increase in severe weather events in order to continue to protect the health of patients in the best way possible.
Our production processes and the operation of healthcare facilities require a high level of energy input. Energy-efficiency measures can lead to short- and long-term cost savings. In addition, through the increased usage and generation of renewable energies, we also want to make an important contribution to climate protection. At the same time, uninterrupted energy supply is a top priority for Fresenius in order to ensure patient safety and reliable production or care. Within this context, we implement energy-saving measures wherever possible. The energy management system is geared to the requirements of our business models and is certified according to ISO 50001. We aim to expand the number of certified sites.
Overall, in energy management and climate protection, our aim is to go beyond the legal framework to identify ways of minimizing the impact on the climate and the environment and to implement these in our management approaches.
Climate neutral by 2040
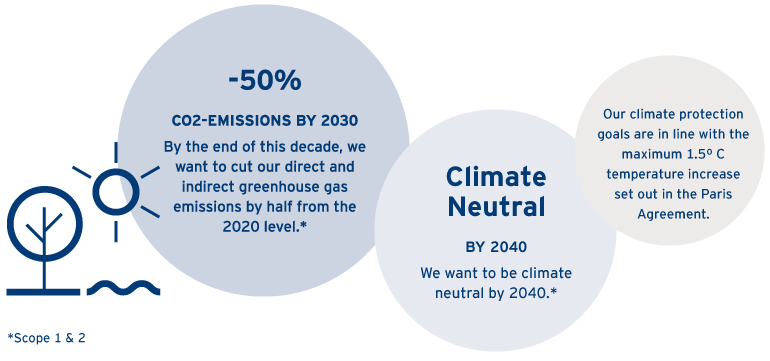
We will be climate neutral in our own operations by 2040. This applies both to direct and indirect CO2 emissions (Scope 1 and 2). Our climate target is in line with the Paris climate agreement’s scientifically based goal to limit global warming to 1.5° C.
We have defined a concrete roadmap to achieve this target: By 2030 we plan to cut our direct and indirect CO2 emissions (Scope 1 and 2) by half from the 2020 level of about 1.5 million metric tons. Any emissions from organic business growth are included.
Our long-term goal is to reach net zero by 2050. Hence, we will further intensify our management of emissions stemming from the upstream and downstream supply chain (Scope 3). For an overview of our Scope 3 emissions please refer to our externally audited Scope 3 Greenhouse Gas Report 2023.
Waste and recycling management
Natural resources are becoming increasingly scarce all over the world. We can only operate sustainably if we use the raw materials available to us efficiently. This also includes the responsible handling of waste – because it contains valuable resources that can be returned to production. Through systematic waste management, we aim to reduce our material consumption and minimize the amount of waste produced.
The handling of waste in the health sector is strictly regulated. Fundamentally, waste must not pose a danger to our patients or the environment, either. Our production processes and treatments in healthcare facilities must be hygienic and sterile at all times. All business segments must always dispose of their waste professionally and safely. With clear internal guidelines, training, and comprehensive controls, we ensure that the respective requirements are complied with.
Contact
If you have any questions about sustainability, please contact us:
sustainability@fresenius.com