
March 26, 2025
Bad Homburg, Germany
Publication Annual Report 2024
Consolidated Financial Statements and Management Report (IFRS)

Fresenius entered an agreement with Worldwide Hospital Group (WWH) to fully divest Vamed’s international project business (Health Tech Engineering, HTE). In May 2024, Fresenius originally announced a gradual wind-down of the HTE project business, largely to be completed by 2026, as part of Fresenius’ structured exit from its Investment Company Vamed. The divestment will now accelerate the exit and enable Fresenius to further increase focus and management capacity on the ongoing progress of its core businesses Fresenius Kabi and Fresenius Helios, in line with #FutureFresenius. For the employees of Vamed’s international project business, the transaction offers the perspective of the continuation of the business.
Worldwide Hospitals Group (WWH), a healthcare company based in Germany, specializes in delivering flexible modular hospital solutions—both at sea and on land. Vamed's international project business will complement and enhance WWH's core business.
Closing is expected mid of 2025 and subject to the fulfilment of certain closing conditions.
This release contains forward-looking statements that are subject to various risks and uncertainties. Future results could differ materially from those described in these forward-looking statements due to certain factors, e.g. changes in business, economic and competitive conditions, regulatory reforms, results of clinical trials, foreign exchange rate fluctuations, uncertainties in litigation or investigative proceedings, the availability of financing and unforeseen impacts of international conflicts. Fresenius does not undertake any responsibility to update the forward-looking statements in this release
Fresenius entered an agreement with Worldwide Hospital Group (WWH) to fully divest Vamed’s international project business (Health Tech Engineering, HTE). In May 2024, Fresenius originally announced a gradual wind-down of the HTE project business, largely to be completed by 2026, as part of Fresenius’ structured exit from its Investment Company Vamed. The divestment will now accelerate the exit and enable Fresenius to further increase focus and management capacity on the ongoing progress of its core businesses Fresenius Kabi and Fresenius Helios, in line with #FutureFresenius. For the employees of Vamed’s international project business, the transaction offers the perspective of the continuation of the business.
Worldwide Hospitals Group (WWH), a healthcare company based in Germany, specializes in delivering flexible modular hospital solutions—both at sea and on land. Vamed's international project business will complement and enhance WWH's core business.
Closing is expected mid of 2025 and subject to the fulfilment of certain closing conditions.
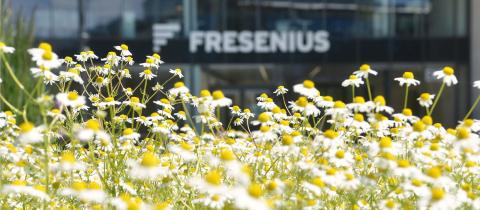
Fresenius SE & Co. KGaA (Frankfurt/Xetra: FRE) is a global healthcare company headquartered in Bad Homburg v. d. Höhe, Germany. In the 2023 fiscal year, Fresenius generated €22.3 billion in annual revenue. Fresenius offers solutions to the social challenges posed by a growing and ageing population and the resulting need for affordable, high-quality healthcare. Fresenius currently counts over 175,000 employees. The Fresenius Group comprises the operating companies Fresenius Kabi and Fresenius Helios as well as the investment company Fresenius Medical Care. With 140 hospitals and countless outpatient facilities, Fresenius Helios is the leading private hospital operator in Germany and Spain, treating around 26 million patients every year. Fresenius Kabi’s product portfolio includes a range of highly complex biopharmaceuticals, clinical nutrition, medical technology, and generic intravenous drugs. Fresenius was established in 1912 by the Frankfurt pharmacist Dr. Eduard Fresenius. After his death, Else Kröner took over management of the company in 1952. She laid the foundations for a global enterprise that today pursues the goal of improving people’s health. The largest shareholder is the non-profit Else Kröner-Fresenius Foundation, which is dedicated to advancing medical research and supporting humanitarian projects.
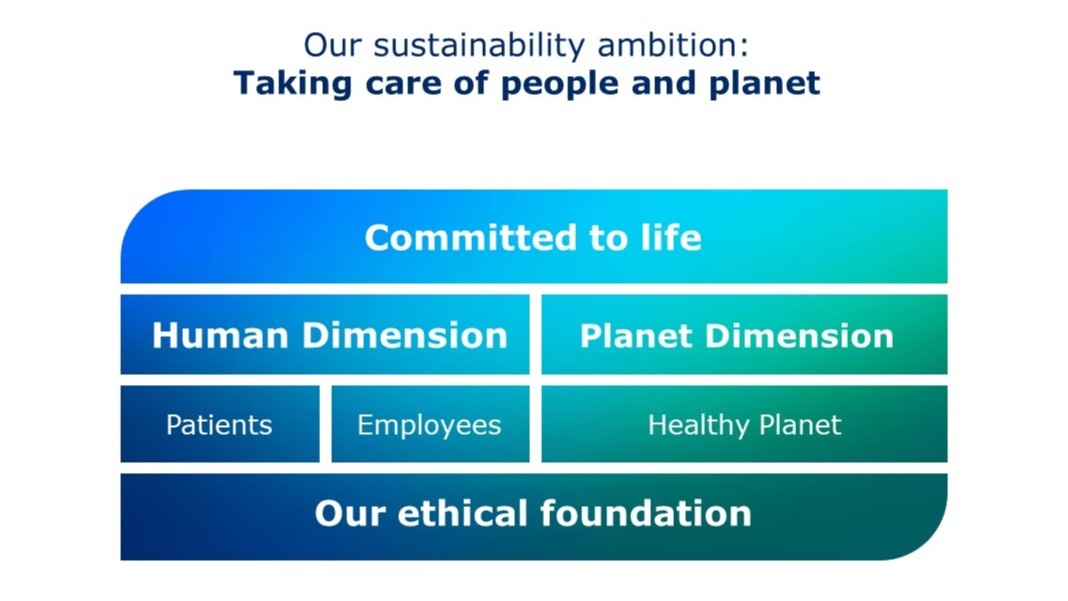
Sustainability is a dynamic field, with new issues constantly emerging and regulatory requirements increasing. For us, however, sustainable activity means more than merely complying with regulations. It is a key aspect of our corporate promise: We are “Committed to Life.”
What exactly is behind our commitment to sustainability?
Sarah Tix: As a healthcare company, it goes without saying that we take care of people – it is part of our DNA. Ever since our company was founded over 100 years ago, there has always been an ethical element to the high quality of our products and therapies – after all, the health of millions of people depends on it.
In concrete terms, our commitment means that we give the subject of sustainability a structure within which we define goals and metrics. That is how we firmly embed them in the entire business, taking two major aspects into consideration: people and planet. The people are our employees, patients, and other stakeholders. When it comes to the planet, we are talking about the environment and climate action.
What exactly does this mean for people and planet?
Sarah Tix: We want to offer our patients high-quality treatments and products. This means achieving above-average results in treatments and delivering markedly better product quality, which simply isn’t possible without our employees. That is why we want to create optimal working conditions for them. Moreover, it is about integrity and doing what is morally right. By this we mean complying with legal requirements and rules, but also taking a stance on social and entirely fundamental issues, such as human rights.
A healthy planet is a key prerequisite for health. That is why climate action is an important part of our activities. The healthcare industry accounts for about five percent of global carbon emissions. As such, our aim is to continuously reduce the carbon footprint along the entire value chain and thus achieve net zero by 2050. In our own line of business, we want to halve our so-called Scope 1 and Scope 2 emissions by 2030 and be a climate-neutral company by 2040.
The subject of sustainability has long been considered the key issue of the future, but there is also currently a great deal of controversy surrounding it. Is the subject still relevant?
Sarah Tix: Yes, absolutely. In our view, sustainability management represents a real opportunity and is essential for securing the resilience, competitiveness, and long-term success of companies. Far from being a short-term trend, sustainability leads to better patient care and contributes to a stable market position in the long term.
-
Hospital operations rely on many products that are procured by the purchasing department. -
![]()
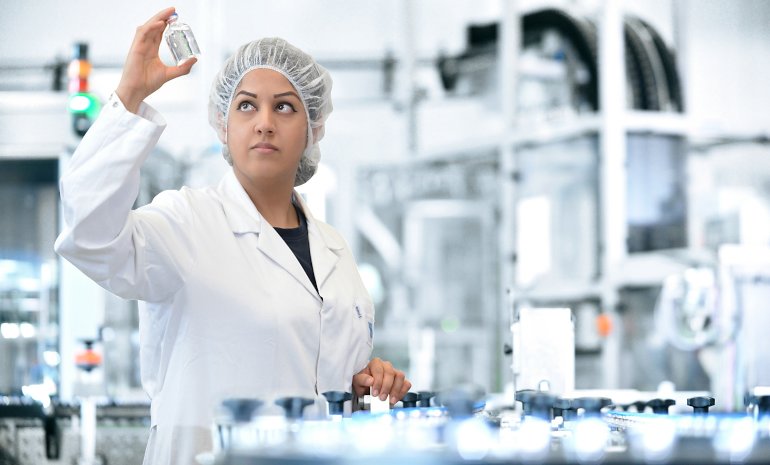
The production of medicines is dependent on the purchase of chemical precursors.
What are the focus areas for 2025?
Sarah Tix: This year, we will continue to drive our sustainability ambition while working on its operationalization and transparency aspects. For instance, we will firm up our climate transition plan. We want to further reduce our energy consumption and increase the use of renewable energy in order to achieve our reduction targets for Scope 1 and Scope 2 emissions.
Our Scope 3 emissions – those in our supply chains – account for the most substantial part of our footprint. We have identified relevant emission categories over the past year, including, for example, the purchase of primary chemical products for medicines at Fresenius Kabi and the procurement of medicines at Helios and Quirónsalud. Going forward, we will concentrate on setting a company-wide target for reducing these types of emissions.
In addition, we will continue to focus on issues such as water consumption. Our aim is to reduce our process water consumption at sites in areas of water stress by 20 percent by 2030. We will also ramp up our sustainability communication activities and stakeholder engagement.
You mention stakeholders. Who are you referring to and what does engagement mean in this regard?
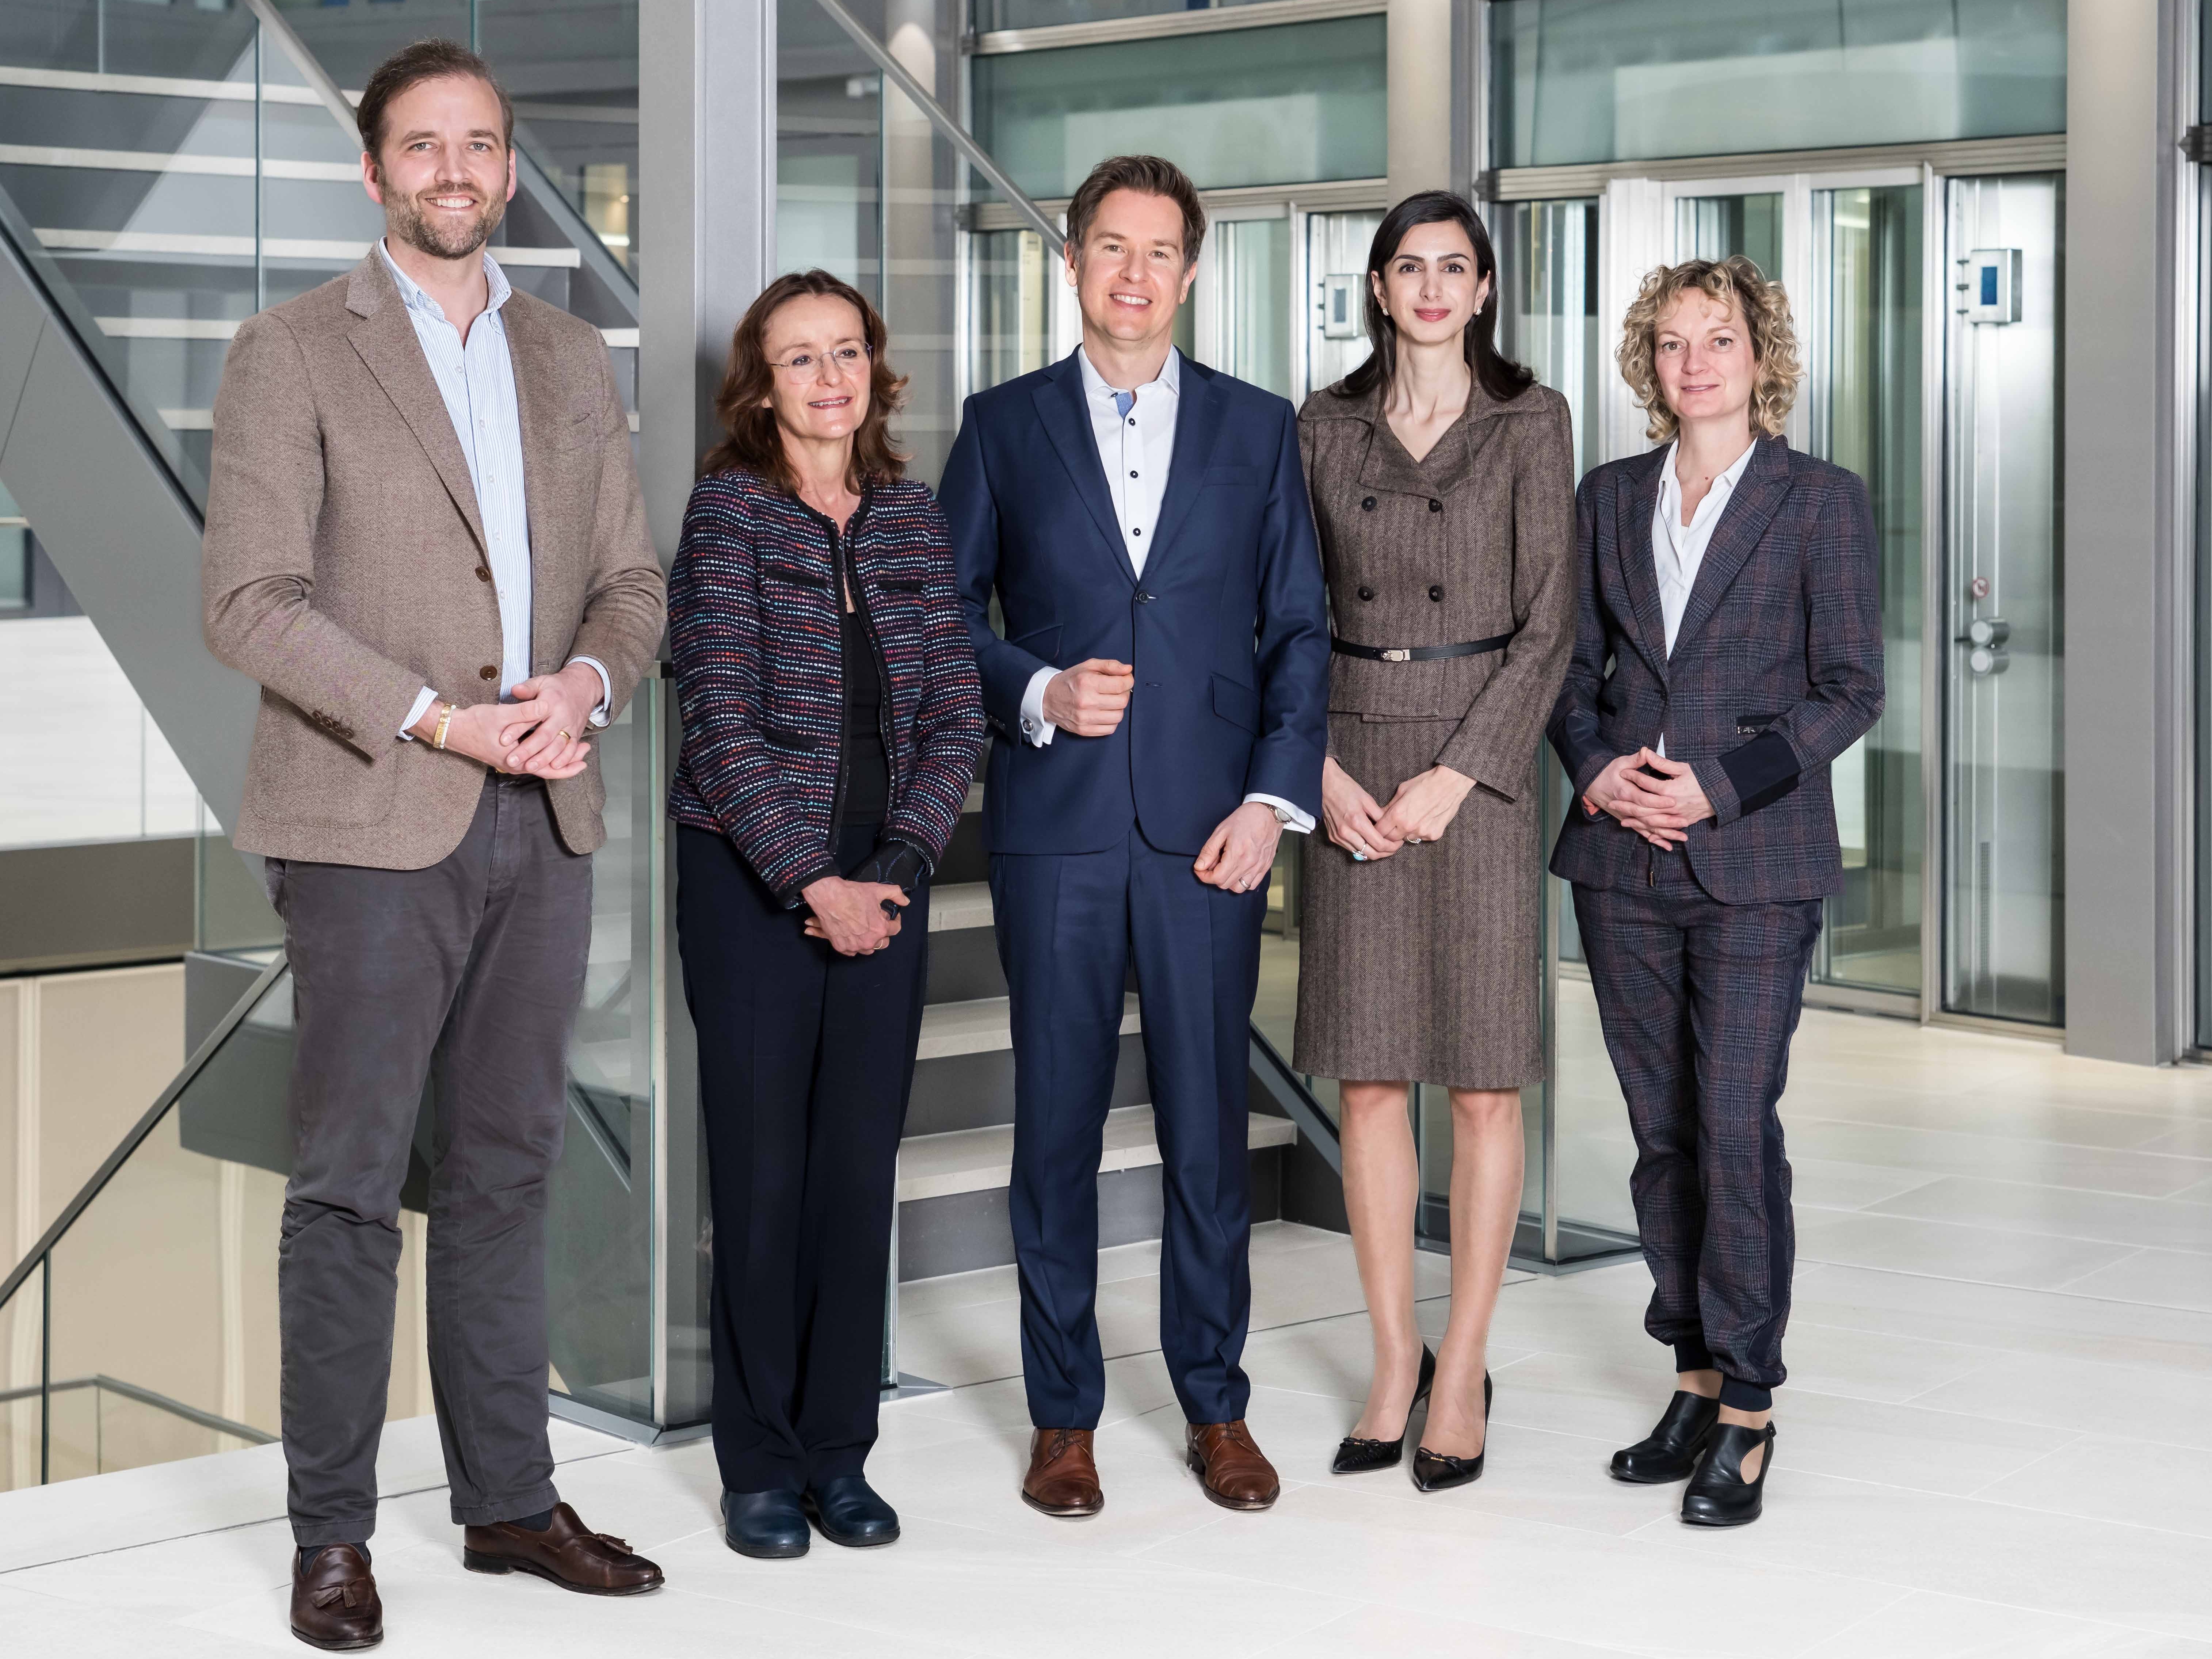
Sarah Tix: We are involved in various organizations and professional bodies. What’s more, we engage in direct dialogue with our employees, patients, and investors. Last year, we set up an external Sustainability Advisory Board to assist us as we continue to develop our activities. Its members possess real expertise in the areas of relevance to us – covering matters such as sustainability in healthcare, environmental protection, human rights, and sustainable human resource management. In the first year of working with the board, we received valuable input – on our strategic approach, for example. We value the open and constructive dialogue and the commitment of all members who support us both as a body and as individuals.
Worldwide
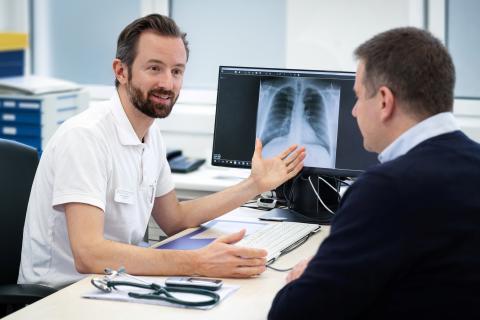
Lung cancer screening: A game changer
For a long time, lung cancer was only discovered when it was almost too late for those affected. A new lung cancer screening program is now helping to change the situation – giving millions of people a real chance of early diagnosis and treatment.
Germany
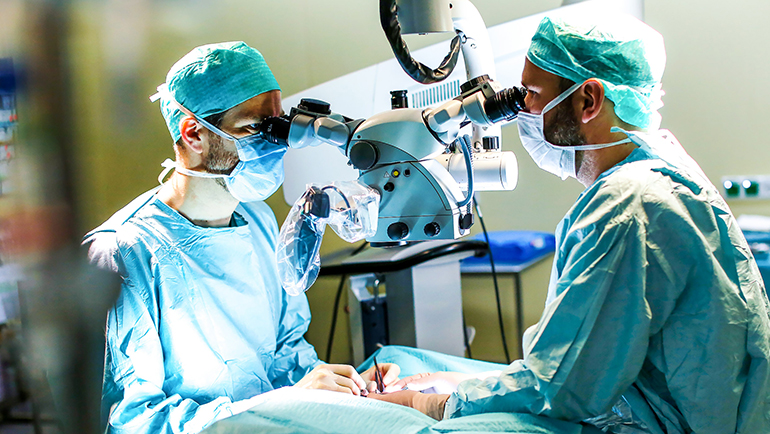
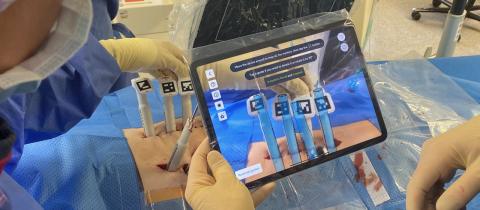
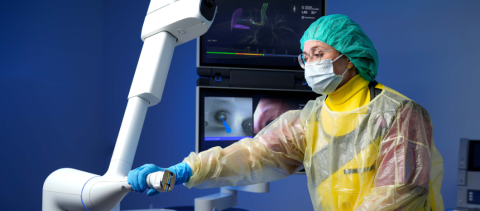
“We combine various innovative solutions to achieve better patient outcomes step by step.”
Helios Hospital Berlin-Buch is one of the first hospitals in Germany to use augmented reality in the operating room.
Germany
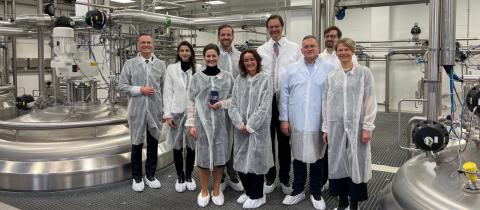
First meeting of the year for the Sustainability Advisory Board in Friedberg
Our Sustainability Advisory Board got together for the first meeting of this year at Fresenius Kabi’s production and logistics site in Friedberg.

Worldwide
How Fresenius employees help people with cancer in every phase of the disease
They serve patients beyond expectations and always give their best – not just in the fight against cancer, but also when striving for the highest possible quality of life.
Worldwide
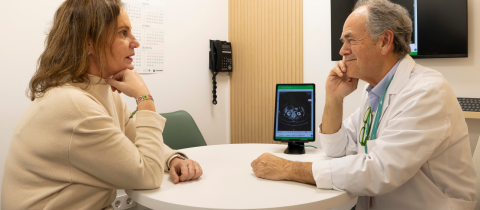
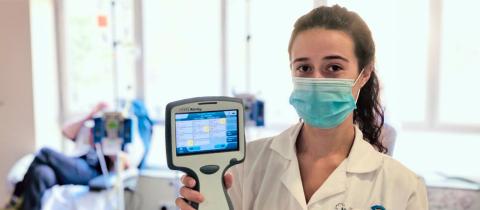
More time for patients thanks to AI in the consulting room
With Scribe, our Quirónsalud hospitals are revolutionizing the Spanish healthcare system. The Ai-powered application enhances efficiency and quality while also strengthening the doctor–patient relationship – for more humanity in medicine.

Worldwide
Antimicrobial resistance is on the rise: How Fresenius responds across all businesses
Antimicrobial resistance (AMR) is a growing global threat. Fresenius is stepping up, through responsible manufacturing, hospital hygiene, and targeted antibiotic use, to help ensure these life-saving medicines remain effective.
Worldwide
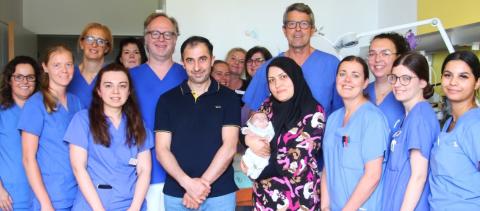
On World Prematurity Day:
A little medical miracle at the Helios hospital in Pforzheim

Worldwide
Walking in a Patient’s Shoes
How Fresenius Kabi is using immersive simulations to deepen understanding of chronic illness.

Worldwide
Celebrating 50 Years of Fresubin
This year marks a major milestone in our company’s history: the 50th anniversary of Fresubin®. What began as a clinical solution in 1975 has grown into a trusted and comprehensive enteral nutrition product brand for patients around the world.
Worldwide
Earlier detection, more targeted treatment: Helios sets new standards in diagnosing lung cancer
Doctors are already setting new standards in the early diagnosis of disease with the robot-assisted “Ion endoluminal system” for bronchoscopy.

Deutschland
Committed to Life: Fresenius now fresher and more modern with new brand identity
#FutureFresenius is making the company fit for the future. And the brand identity must reflect and support this.

Worldwide
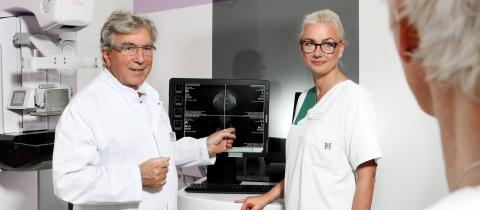
Comprehensive Care and Compassion: Fresenius' Commitment in Breast Cancer Treatment
Fresenius highlights its commitment to delivering excellent patient care and advancing medical innovation. One patient’s story shows how we bring hope and compassion when it matters most.
Worldwide
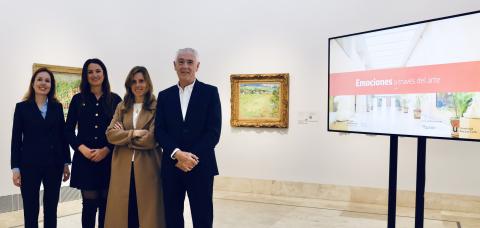
When Art Becomes Measurable
How Quirónsalud explores the impact of images on our well-being and the implications for new approaches in patient care

Worldwide
The people behind cancer care
On today’s World Cancer Day, Fresenius highlights what individualized cancer care means in practice. One patient’s story shows why seeing the whole person behind the diagnosis matters across the entire patient journey.

Worldwide
How Fresenius turns science into better patient care
Advances in medicine can save lives – but only when they reach patients. On today’s World Health Day, explore how Fresenius’ businesses bring research & development, new technology, and care together to help improve outcomes for patients.
Worldwide
Sustainability at Fresenius: Three questions for Mapi Henríquez de Armas, Director Sustainability at Quirónsalud
"While adapting to climate change is managed at a local level, we have set global emission reduction targets that help us to meet related expectations and to coordinate our efforts."
Worldwide
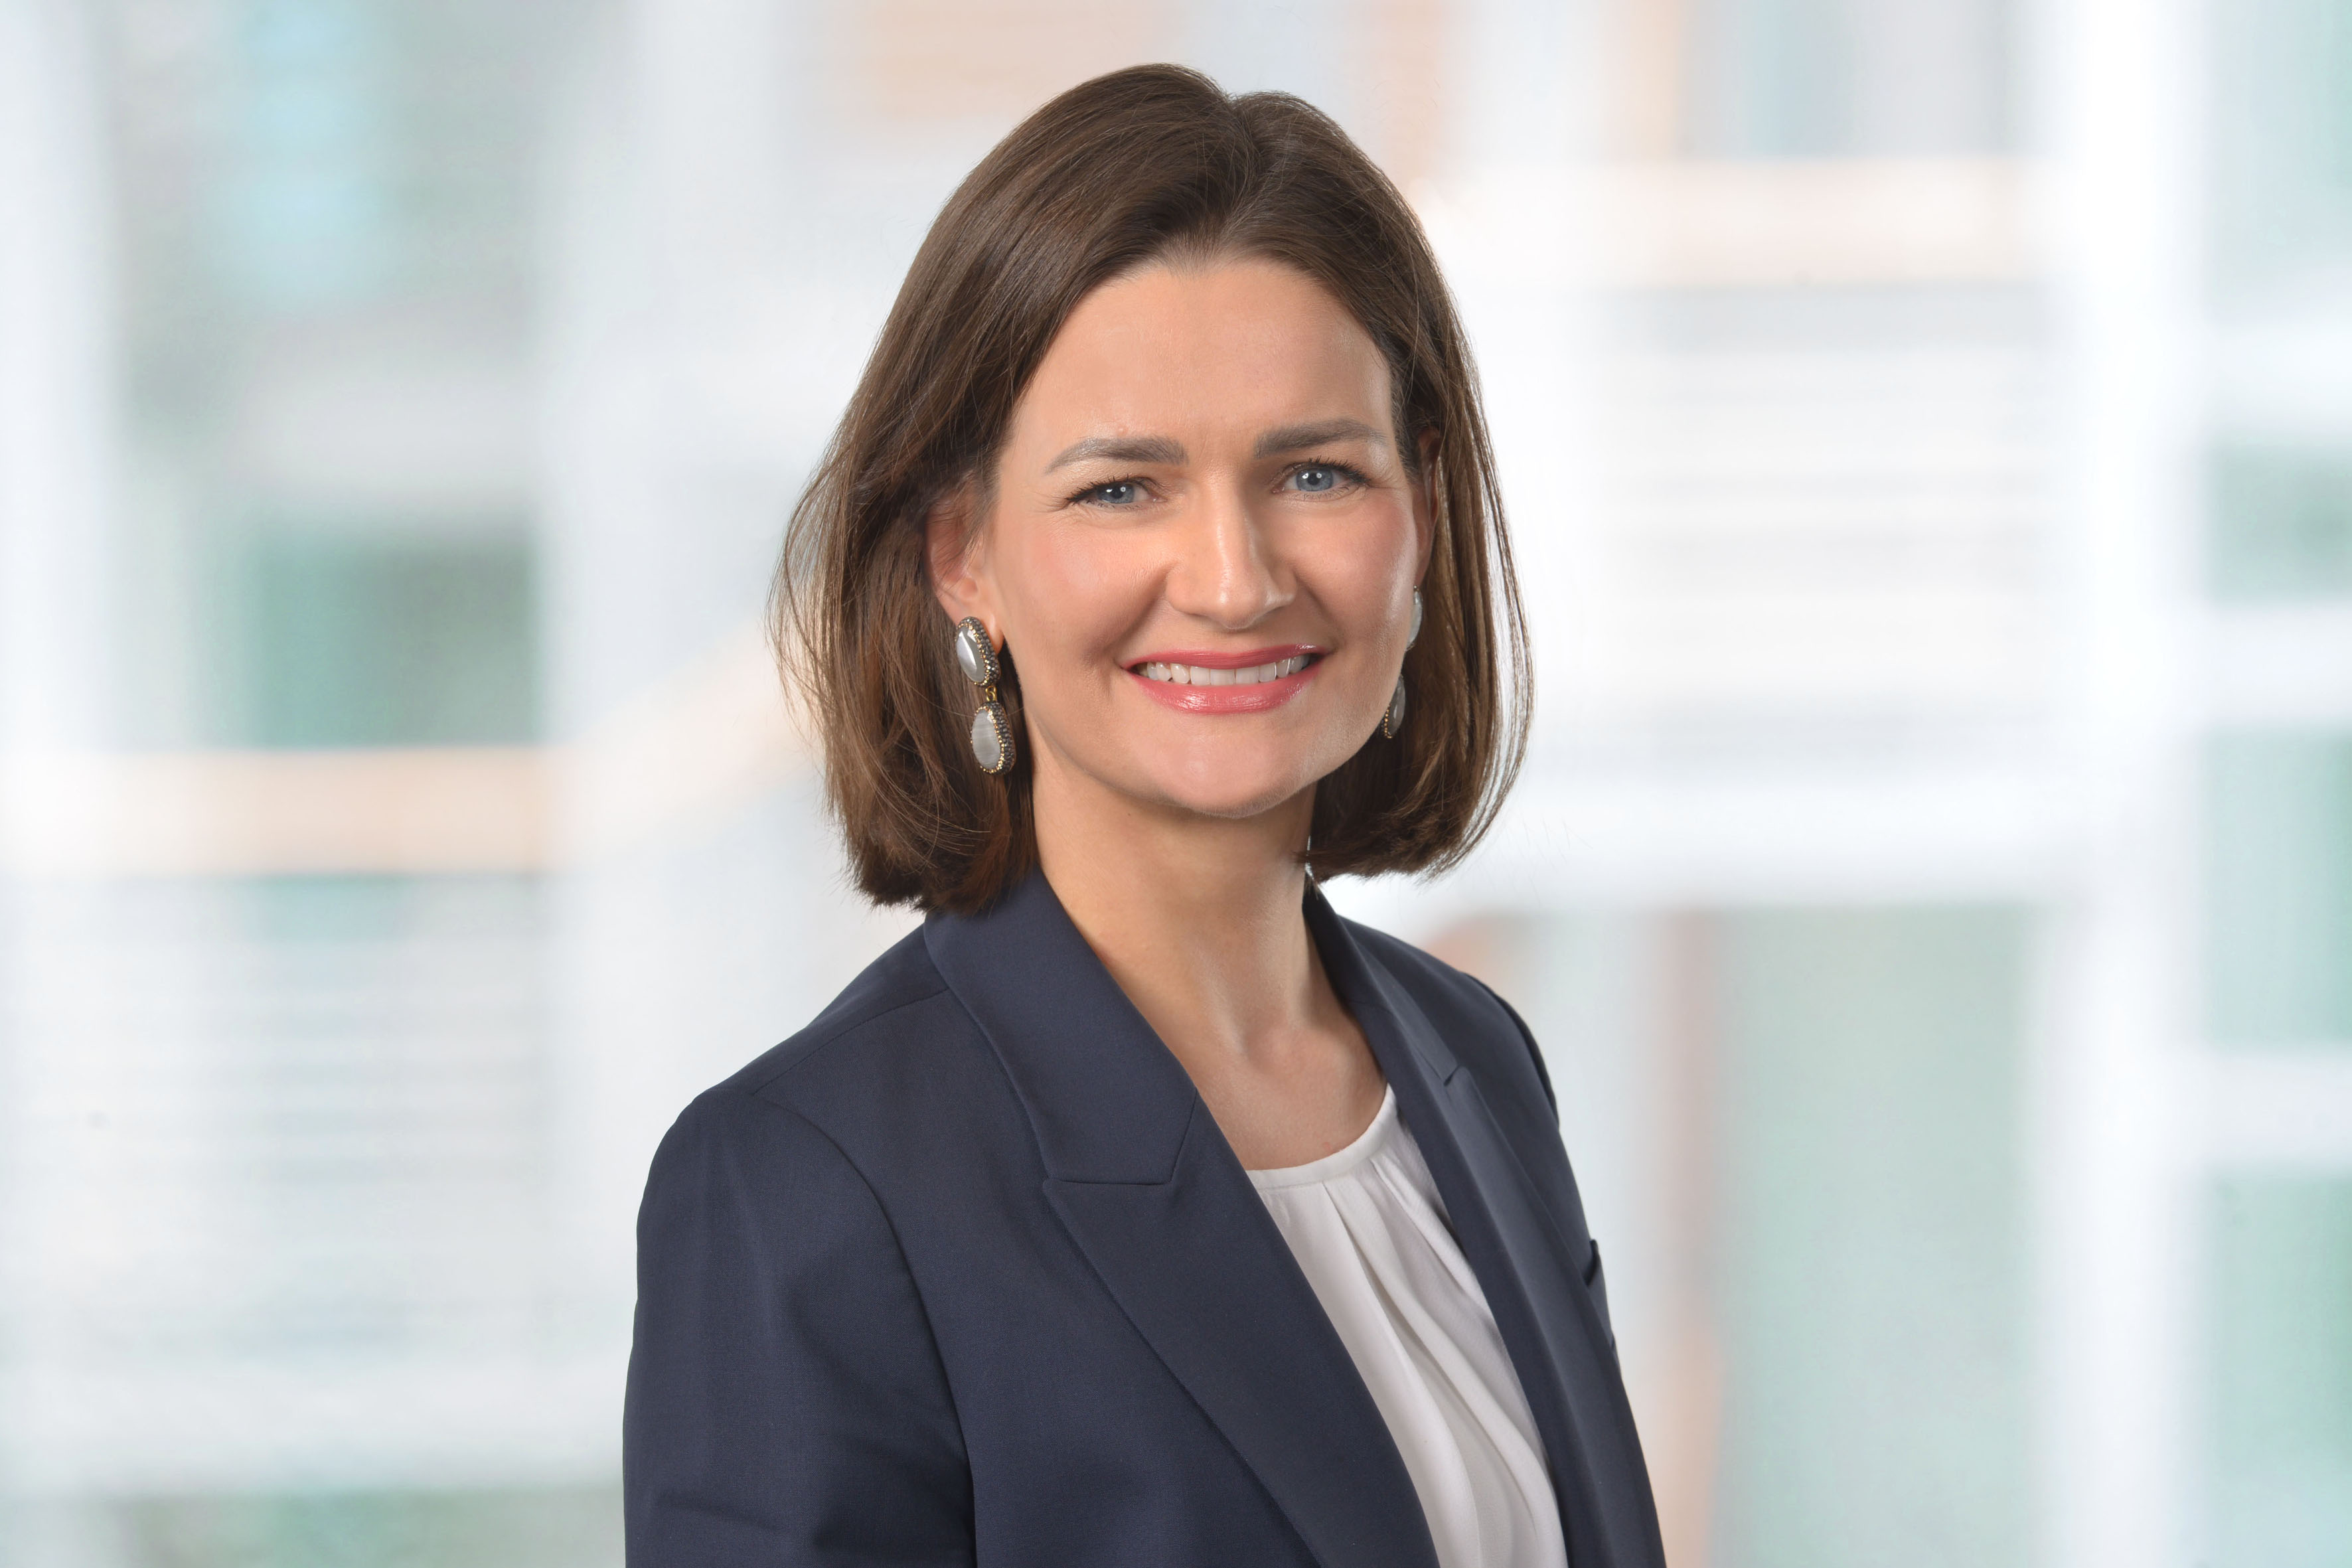
Sustainability at Fresenius: Five questions for Sarah Tix, Head of Group Sustainability
"In our view, sustainability management represents a real opportunity and is essential for securing the resilience, competitiveness, and long-term success of companies."
Germany
“The new ADC medicines represent a real revolution in treatment. This promising therapy can give many patients new hope.”
Professor Dr. Michael Untch from Helios Hospital Berlin-Buch explains how the new antibody-drug conjugates (ADCs) are changing the fight against cancer.
USA
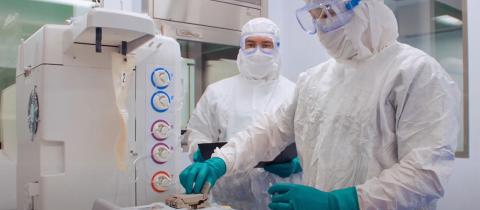
“The flexibility of our Lovo and Cue cell processing systems was the key to success!”
Read our interview with Chris Wegener, to find out more about the device development for CAR-T cell therapy at Fresenius Kabi.

Germany
CAR-T cell therapy: Revolutionary chances of a cure, but costs still too high
How Fresenius Kabi is revolutionizing the treatment of cancer patients with the help of the Lovo and Cue cell processing systems.
Europe
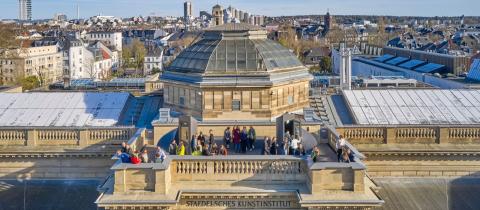
Fresenius is a new partner of the Städel Museum
By supporting the renowned museum foundation, the healthcare company demonstrates its social responsibility. The partnership is at the same time a clear commitment to Frankfurt and the Rhine-Main region.

Germany
"Immunotherapies: Boosting Cures and more Patient Wellbeing"
Read our interview to find out what Dr. Anna Ossami Saidy, a doctor in training at the Helios Clinic Berlin-Buch, is currently researching.

Germany
Optimized colorectal cancer screening with AI
How artificial intelligence helps to detect polyps that can’t be seen by the human eye

Germany
CAR T cell therapy: Innovative therapy with the aid of genetically modified cells
“Personalized tumor medicine can be more effective at fighting tumors and produce beneficial therapies with fewer side effects.”

Germany
Welcome to our new podcast format: “Talk Time – CEO Insights with Michael Sen”!
Get to know more about how this year started for Michael Sen, his view on trends like AI in health care and health equity.
Germany
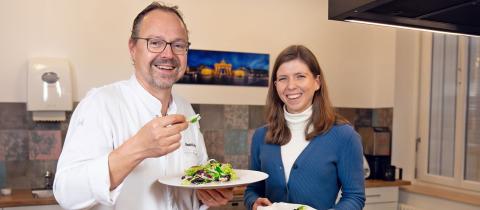
New year, good resolutions: Eating a vegan diet can do a lot for your health and the environment!
Hendrik Otto and Verena Kaiser from Helios explain the benefits of changing your diet
Europe
HOPE gives hope
Quirónsalud focuses on digitalisation to improve oncology patient care
Germany
"This is a tremendous win for the patients"
Interview with Prof. Iwasaki, winner of the Else Kröner Fresenius Prize for Medical Research 2023, endowed with 2.5 million euros.

Germany
Sustainably anesthetized
Anesthetic gas recycling reduces greenhouse gas emissions by 90 percent
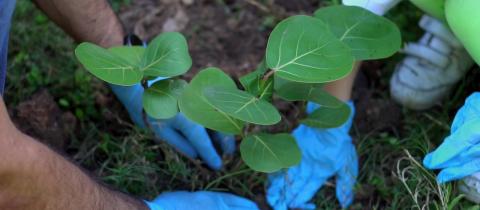
Latin America
Planting trees and changing hearts
Fresenius Kabi Employees in the Dominican Republic are working to create a healthier environment.

Europe
‘Sometimes we understand each other without words’
Dr. Veronika Wolter is the first deaf person in Germany to achieve the position of chief physician. She herself uses a hearing prosthesis, and understands her patients very well.
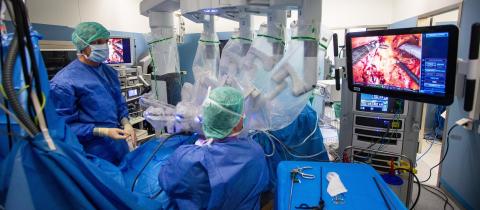
Europe
A robot at the operating table
Fresenius Helios uses the latest robotic technology to make surgery gentler for patients – for example at Helios Hospital Erfurt in Germany.
Europe
Growing up with parenteral nutrition
How two brave adventurers from Switzerland are exploring the world step-by-step.
Europe
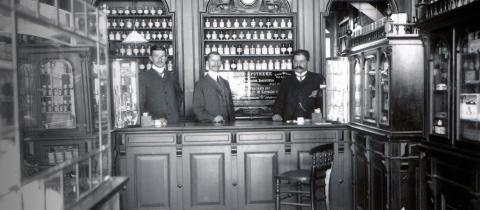
From a local pharmacy to a global corporation
As a leading global healthcare group we are dedicated to medicine and human health - values we have upheld since our founding as a pharmacy lab in 1912.
Fresenius, via its operating company Fresenius Kabi, announced today that the U.S. Food and Drug Administration (FDA) has granted 510(k) clearance to its Adaptive Nomogram, an alternate algorithm that will be available in the Aurora Xi Plasmapheresis System.
The Adaptive Nomogram enables an average 11.5% increase in plasma collection per donation while maintaining safe and effective operation. This enhanced capability will allow plasma centers to improve collection efficiency. Plasma-derived therapies are essential for treating a wide range of conditions, including immune deficiencies, bleeding disorders, and neurological diseases. By increasing plasma collection efficiency, Fresenius Kabi reinforces its commitment to improving access to these critical therapies. The clearance received for the Adaptive Nomogram is another milestone in line with #FutureFresenius.