
If no timeframe is specified, information refers to Q1-3/2017
Q3/2017:
- Sales: €8.3 billion (+12%, +15% in constant currency)
- EBIT1: €1,129 million (+5%, +9% in constant currency)
- Net income2,3 (adjusted): €423 million (+11%, +14% in constant currency)
- Net income2: €396 million (+4%, +7% in constant currency)
Q1-3/2017:
- Sales: €25.2 billion (+16%, +16% in constant currency)
- EBIT1: €3,522 million (+15%, +15% in constant currency)
- Net income2,3 (adjusted): €1,339 million (+20%, +20% in constant currency)
- Net income2: €1,303 million (+17%, +17% in constant currency)
Stephan Sturm, CEO of Fresenius, said: “We can report another very good quarter, once again boosted by strong sales and earnings growth. The prospects for our businesses remain excellent. We are therefore confirming our guidance and are heading towards yet another record year. From this position of strength, we intend to swiftly close and integrate our strategically important acquisitions. Thus, we are expanding our range of high-quality, affordable healthcare products and services for the benefit of our patients and our company.“
1 Before acquisition-related expenses2 Net income attributable to shareholders of Fresenius SE & Co. KGaA3 Consistent with scope of original guidance: before acquisition-related expenses; before expenditures for further development of biosimilars business
For a detailed overview of adjustments, please see the reconciliation tables on page 15-16 in the pdf document.
2017 Group guidance confirmed
Fresenius confirms its guidance for 2017. Group sales are expected to increase by 15% to 17% in constant currency. Group net income1,2,3 is expected to grow by 19% to 21% in constant currency.
Including the acquisition of Merck KGaA’s biosimilars business and pro forma the acquisition of Akorn, the net debt/EBITDA4 ratio is expected to be approximately 3.3 at the end of 2017.
16% sales growth in constant currency
Group sales increased by 16% (16% in constant currency) to €25,191 million (Q1-3/2016: €21,651 million). Organic sales growth was 6%5 while acquisitions contributed 10%. In Q3/2017, Group sales increased by 12% (15% in constant currency) to €8,297 million (Q3/2016: €7,433 million). Negative currency translation effects (-3%) were mainly related to the devaluation of the US dollar. Organic sales growth was 6% while acquisitions contributed 9%.
1 Net income attributable to shareholders of Fresenius SE & Co. KGaA2 Before acquisition-related expenses of ~€50 m3 Before expected expenditures for further development of biosimilars business of ~€60 m4 Net debt and EBITDA at FY average exchange rates; before acquisition-related expenses of ~€50 m; excluding further potential acquisitions5 Excluding effects of Fresenius Medical Care’s agreement with the United States Departments of Veterans Affairs and Justice (VA agreement)
For a detailed overview of adjustments, please see the reconciliation tables on page 15-16 in the pdf document.

20% adjusted net income2,3 growth in constant currency
Group EBITDA4 increased by 16% (16% in constant currency) to €4,579 million (Q1-3/2016: €3,959 million). Group EBIT4 increased by 15% (15% in constant currency) to €3,522 million (Q1-3/2016: €3,058 million) with an EBIT margin4 of 14.0% (Q1-3/2016: 14.1%). In Q3/2017, Group EBIT4 increased by 5% (9% in constant currency) to €1,129 million (Q3/2016: €1,071 million) with an EBIT margin4 of 13.6% (Q3/2016: 14.4%).
Group net interest4 reached -€484 million (Q1-3/2016: -€433 million). The increase is mainly driven by the financing of the Quirónsalud acquisition.
1 Including effects of VA agreement2 Net income attributable to shareholders of Fresenius SE & Co. KGaA3 Consistent with scope of original guidance: before acquisition-related expenses; before expenditures for further development of biosimilars business4 Before acquisition-related expenses
For a detailed overview of adjustments, please see the reconciliation tables on page 15-16 in the pdf document.
The Group tax rate1 was 28.1% (Q1-3/2016: 28.2%). In Q3/2017, the Group tax rate1 decreased to 27.4% (Q3/2016: 27.9%), mainly driven by a re-evaluation of estimated future tax payments at Fresenius Medical Care.
Noncontrolling interest increased to €854 million (Q1-3/2016: €768 million), of which 95% was attributable to the noncontrolling interest in Fresenius Medical Care.
Adjusted Group net income2,3 increased by 20% (20% in constant currency) to €1,339 million (Q1-3/2016: €1,118 million). Adjusted earnings per share2,3 increased by 19% (19% in constant currency) to €2.42 (Q1-3/2016: €2.04). In Q3/2017, adjusted Group net income2,3 increased by 11% (14% in constant currency) to €423 million (Q3/2016: €382 million). Adjusted earnings per share2,3 increased by 11% (14% in constant currency) to €0.77 (Q3/2016: €0.69).
Group net income before acquisition-related expenses1,2 increased by 19% (19% in constant currency) to €1,329 million (Q1-3/2016: €1,118 million). Earnings per share1,2 increased by 18% (18% in constant currency) to €2.40 (Q1-3/2016: €2.04). In Q3/2017, Group net income1,2 increased by 8% (11% in constant currency) to €413 million (Q3/2016: €382 million). Earnings per share1,2 increased by 8% (11% in constant currency) to €0.75 (Q3/2016: €0.69).
Group net income2 increased by 17% (17% in constant currency) to €1,303 million (Q1-3/2016: €1,118 million). Earnings per share2 increased by 15% (15% in constant currency) to €2.35 (Q1-3/2016: €2.04). In Q3/2017, Group net income2 increased by 4% (7% in constant currency) to €396 million (Q3/2016: €382 million). Earnings per share2 increased by 3% (6% in constant currency) to €0.71 (Q3/2016: €0.69).
1 Before acquisition-related expenses2 Net income attributable to shareholders of Fresenius SE & Co. KGaA3 Consistent with scope of original guidance: before acquisition-related expenses; before expenditures for further development of biosimilars business
For a detailed overview of adjustments, please see the reconciliation tables on page 15-16 in the pdf document.
Continued investment in growth
Spending on property, plant and equipment was €1,137 million (Q1-3/2016: €1,059 million), primarily for the modernization and expansion of dialysis clinics, production facilities as well as hospitals and day clinics. Total acquisition spending of €6,662 million (Q1-3/2016: €592 million) was mainly related to the acquisitions of Quirónsalud and Merck KGaA’s biosimilars business.
Strong operating cash flow
Operating cash flow increased by 24% to €2,821 million (Q1-3/2016: €2,273 million). The cash flow margin increased to 11.2% (Q1-3/2016: 10.5%). In Q3/2017, operating cash flow increased by 21% to €1,138 million (Q3/2016: €940 million), with a margin of 13.7% (Q3/2016: 12.6%).
Free cash flow before acquisitions and dividends increased by 41% to €1,705 million (Q1-3/2016: €1,206 million). Free cash flow after acquisitions and dividends was -€5,233 million (Q1-3/2016: €252 million).
Solid balance sheet structure
The Group’s total assets increased by 14% (20% in constant currency) to €53,097 million (Dec. 31, 2016: €46,697 million), mainly due to the acquisition of Quirónsalud. Current assets grew by 10% (16% in constant currency) to €12,870 million (Dec. 31, 2016: €11,744 million). Non-current assets increased by 15% (22% in constant currency) to €40,227 million (Dec. 31, 2016: € 34,953 million).
Total shareholders’ equity grew by 2% (10% in constant currency) to €21,167 million (Dec. 31, 2016: €20,849 million). The equity ratio was 39.9% (Dec. 31, 2016: 44.6%).
Group debt increased by 32% (37% in constant currency) to €19,496 million (Dec. 31, 2016: € 14,780 million), mainly driven by the acquisition financing of Quirónsalud. As of September 30, 2017, the net debt/EBITDA ratio was 2.971,2 (Dec. 31, 2016: 2.331; pro forma Quirónsalud 3.091).
1 Net debt and EBITDA at LTM average exchange rates2 Before acquisition-related expenses
For a detailed overview of adjustments, please see the reconciliation tables on page 15-16 in the pdf document.
Business Segments
Fresenius Medical Care
Fresenius Medical Care is the world's largest provider of products and services for individuals with chronic kidney failure. As of September 30, 2017, Fresenius Medical Care was treating 317,792 patients in 3,714 dialysis clinics. Along with its core business, the company seeks to expand the range of medical services in the field of care coordination.

- Solid Q3 despite impact from natural disasters in North America
- 8% constant currency sales growth in Q3
- 2017 outlook confirmed2
Sales increased by 10% (10% in constant currency, 7% organic) to €13,355 million (Q1-3/2016: €12,153 million). Acquisitions and the agreement with the United States Departments of Veterans Affairs and Justice (VA agreement) contributed 3% in total. In Q3/2017, sales increased by 3% (8% in constant currency, 6% organic) to €4,336 million (Q3/2016: €4,211 million).
Health Care Services sales (dialysis services and care coordination) increased by 11% (10% in constant currency) to €10,950 million (Q1-3/2016: €9,910 million). Product sales increased by 7% (7% in constant currency) to €2,404 million (Q1-3/2016: €2,244 million).
In North America, sales increased by 10% (10% in constant currency) to €9,715 million (Q1-3/2016: €8,828 million). Health Care Services sales grew by 10% (10% in constant currency) to €9,086 million (Q1-3/2016: €8,224 million). Product sales increased by 4% (4% in constant currency) to €629 million (Q1-3/2016: €604 million).
Sales outside North America increased by 9% (10% in constant currency) to €3,628 million (Q1-3/2016: €3,315 million). Health Care Services sales increased by 11% (11% in constant currency) to €1,864 million (Q1-3/2016: €1,686 million). Product sales increased by 8% (8% in constant currency) to €1,764 million (Q1-3/2016: €1,630 million).
1 Net income attributable to shareholders of Fresenius Medical Care AG & Co. KGaA2 Excluding effects of VA agreement and natural disaster costs
EBIT increased by 10% (10% in constant currency) to €1,843 million (Q1-3/2016: €1,679 million). The EBIT margin was 13.8% (Q1-3/2016: 13.8%). In Q3/2017, EBIT was on the prior-year level (increased by 4% in constant currency) at €608 million (Q3/2016: €611 million). Foreign currency effects, lower contributions from the vascular business, higher costs in the pharmacy services business and natural disaster costs in North America negatively impacted EBIT, while organic growth and lower research and development expenses contributed positively. The EBIT margin was 14.0% (Q3/2016: 14.5%).
Net income1 increased by 13% (14% in constant currency) to €886 million (Q1-3/2016: €781 million). Consistent with the original scope of guidance, i.e. excluding the effects of the VA agreement and natural disaster costs, net income1 increased by 8% in constant currency. In Q3/2017, net income1 grew by 2% (6% in constant currency) to €309 million (Q3/2016: €304 million). Excluding the effects of the VA agreement and natural disaster costs, net income1 increased by 5% (8% in constant currency).
Operating cash flow increased by 43% to €1,664 million (Q1-3/2016: €1,160 million). The cash flow margin increased to 12.5% (Q1-3/2016: 9.5%). In Q3/2017, operating cash flow increased by 56% to €612 million (Q3/2016: €393 million) with a cash flow margin of 14.1% (Q3/2016: 9.3%). The increase is primarily attributable to last year’s cash contribution to a pension plan in the United States as well as other working capital items.
Fresenius Medical Care confirms its outlook for 2017. The company expects sales to grow by 8% to 10%2 in constant currency. Net income1,3 is expected to increase by 7% to 9% in constant currency.
For further information, please see Fresenius Medical Care’s Investor News at www.freseniusmedicalcare.com.
1 Net income attributable to shareholders of Fresenius Medical Care AG & Co. KGaA2 Excluding effects of VA agreement3 Excluding effects of VA agreement and natural disaster costs
Fresenius Kabi
Fresenius Kabi offers intravenously administered generic drugs, clinical nutrition and infusion therapies for seriously and chronically ill patients in the hospital and outpatient environments. The company is also a leading supplier of medical devices and transfusion technology products.

- 7% organic sales growth in Q3; positive contributions from all regions
- 11% adjusted EBIT growth2 in constant currency in Q3
- 2017 outlook confirmed
Sales increased by 7% (7% in constant currency, 7% organic) to €4,764 million (Q1-3/2016: €4,457 million). Acquisitions/divestitures had no meaningful impact on sales. In Q3/2017, sales increased by 3% (7% in constant currency, 7% organic) to €1,562 million (Q3/2016: €1,511 million). Negative currency translation effects (-4%) were mainly related to the devaluation of the US dollar and the Chinese yuan against the Euro.
Sales in Europe increased by 4% (5% organic) to €1,635 million (Q1-3/2016: €1,569 million). In Q3/2017, sales increased by 3% (4% organic) to €538 million (Q3/2016: €521 million).
Sales in North America increased by 7% (6% organic) to €1,736 million (Q1-3/2016: €1,628 million). In Q3/2017, sales increased by 1% (7% organic) to €549 million (Q3/2016: €542 million).
Sales in Asia-Pacific increased by 9% (11% organic) to €894 million (Q1-3/2016: €821 million). In Q3/2017, sales increased by 8% (12% organic) to €312 million (Q3/2016: €290 million).
Sales in Latin America/Africa increased by 14% (10% organic) to €499 million (Q1-3/2016: €439 million). In Q3/2017, sales increased by 3% (8% organic) to €163 million (Q3/2016: €158 million).
1 Before acquisition-related expenses2 Consistent with scope of original guidance: before acquisition-related expenses; before expenditures for further development of biosimilars business3 Net income attributable to shareholders of Fresenius SE & Co. KGaA
For a detailed overview of adjustments, please see the reconciliation tables on page 15-16 in the pdf document.
Adjusted EBIT1 increased by 6% (7% in constant currency) to €919 million (Q1-3/2016: €863 million). The adjusted EBIT margin1 was 19.3% (Q1-3/2016: 19.4%). In Q3/2017, adjusted EBIT1 increased by 6% (11% in constant currency) to €297 million (Q3/2016: €281 million), despite expenses related to hurricane Maria on Puerto Rico. The adjusted EBIT margin1 increased to 19.0% (Q3/2016: 18.6%).
EBIT2 increased by 5% (6% in constant currency) to €905 million (Q1-3/2016: €863 million). The EBIT margin2 was 19.0% (Q1-3/2016: 19.4%). In Q3/2017, EBIT2 increased by 1% (6% in constant currency) to €283 million (Q3/2016: €281 million). Given the €14 million expenditure for the further development of the biosimilars business, the EBIT margin2 decreased to 18.1% (Q3/2016: 18.6%).
Adjusted net income1,3 increased by 13% (14% in constant currency) to €554 million (Q1-3/2016: €491 million). In Q3/2017, adjusted net income1,3 increased by 13% (19% in constant currency) to €175 million (Q3/2016: €155 million).
While operating cash flow reached a very strong €640 million, it could not match the exceptional prior-year figure (Q1-3/2016: €661 million). The same applied to the strong margin of 13.4% (Q1-3/2016: 14.8%). In Q3/2017, operating cash flow reached a healthy €245 million (Q3/2016: €322 million) despite a cash prepayment for the biosimilars business and adverse currency translation effects. The cash flow margin was 15.7% (Q3/2016: 21.3%). Excluding the prepayment, operating cash flow was €290 with a margin of 18.6%.
Fresenius Kabi confirms its outlook for 2017 and expects 5% to 7% organic sales growth and EBIT growth in constant currency of 6% to 8%4,5.
1 Consistent with scope of original guidance: before acquisition-related expenses; before expenditures for further development of biosimilars business2 Before acquisition-related expenses3 Net income attributable to shareholders of Fresenius SE & Co. KGaA4 Before acquisition-related expenses of ~€50 m5 Before expected expenditures for further development of biosimilars business of ~€60 mFor a detailed overview of adjustments, please see the reconciliation tables on page 15-16 in the pdf document.
Fresenius Helios
Fresenius Helios is Europe's leading private hospital operator. The company comprises Helios Kliniken in Germany and Quirónsalud in Spain. Helios Kliniken operates 111 hospitals, thereof 88 acute care clinics and 23 post-acute care clinics, and treats more than 5.2 million patients annually. Quirónsalud operates 44 hospitals, 44 outpatient centers and around 300 occupational risk prevention centers, and treats approximately 9.7 million patients per year.

- 47% sales growth (4% excluding Quirónsalud) in Q3
- 33% EBIT increase (9% excluding Quirónsalud) in Q3
- 2017 outlook confirmed
Fresenius Helios increased sales by 47% (4% organic) to €6,422 million (Q1-3/2016: €4,382 million). Acquisitions, mainly Quirónsalud, increased sales by 43%. In Q3/2017, sales increased by 47% (4% organic) to €2,166 million (Q3/2016: €1,470 million).
Sales of Helios Kliniken2 increased by 4% (4% organic) to €4,562 million (Q1-3/2016: €4,382 million). In Q3/2017, sales increased by 4% (4% organic) to €1,524 million (Q3/2016: €1,470 million). Quirónsalud has been consolidated since February 1, 2017 and generated sales of €1,860 million (thereof €642 million in Q3/2017).
Fresenius Helios grew EBIT by 52% to €769 million (Q1-3/2016: €507 million). The EBIT margin increased to 12.0% (Q1-3/2016: 11.6%). In Q3/2017, EBIT increased by 33% to €232 million (Q3/2016: €175 million). The EBIT margin decreased to 10.7% (Q3/2016: 11.9%) due to the anticipated lower contribution of Quirónsalud during the summer months.
EBIT of Helios Kliniken2 increased by 8% to €549 million (Q1-3/2016: €507 million) with a margin of 12.0% (Q1-3/2016: 11.6%). In Q3/2017, EBIT of Helios Kliniken2 increased by 9% to €190 million (Q3/2016: €175 million) with a margin of 12.5% (Q3/2016: 11.9%). EBIT of Quirónsalud was €220 million (thereof €42 million in Q3/2017) with a margin of 11.8% (Q3/2017: 6.5%).
Fresenius Helios increased net income1 by 31% to €526 million (Q1-3/2016: €402 million). In Q3/2017, net income1 increased by 9% to €153 million (Q3/2016: €140 million).
Operating cash flow increased by 28% to €560 million (Q1-3/2016: €437 million) driven by the first-time consolidation of Quirónsalud. The margin was 8.7% (Q1-3/2016: 10.0%).
Fresenius Helios confirms its outlook for 2017 and projects organic sales growth of 3% to 5%2 and sales of ~€8.6 billion (thereof Quirónsalud ~€2.5 billion3). EBIT is expected to increase to €1,020 to €1,070 million (thereof Quirónsalud €300 to 320 million3).
1 Net income attributable to shareholders of Fresenius SE & Co. KGaA2 Helios Kliniken Germany, excluding Quirónsalud3 Quirónsalud consolidated for 11 months
Fresenius Vamed
Fresenius Vamed manages projects and provides services for hospitals and other health care facilities worldwide. The portfolio ranges along the entire value chain: from project development, planning, and turnkey construction, via maintenance and technical management, to total operational management.

- 9% sales growth in service business in Q3
- Project business with strong order intake of €285 million in Q3
- 2017 outlook confirmed
Sales increased by 1% (1% organic) to €748 million (Q1-3/2016: €740 million). Sales in the project business decreased by 7% to €301 million (Q1-3/2016: €325 million). Sales in the service business grew by 8% to €447 million (Q1-3/2016: €415 million). In Q3/2017, sales remained stable at €267 million (Q3/2016: €268 million).
EBIT increased by 3% to €32 million (Q1-3/2016: €31 million). The EBIT margin increased to 4.3% (Q1-3/2016: 4.2%). In Q3/2017, EBIT of €15 million (margin 5.6%) remained unchanged from previous year’s quarter.
Net income1 remained stable at €21 million (Q1-3/2016: €21 million). In Q3/2017, net income1 remained unchanged at €10 million (Q3/2016: €10 million).
Order intake reached a strong €697 million (Q1-3/2016: €674 million). In Q3/2017 order intake increased by 36% to €285 million. As of September 30, 2017, order backlog grew to an all-time high of €2,345 million (December 31, 2016: €1,961 million).
Fresenius Vamed confirms its outlook for 2017 and expects both organic sales growth and EBIT growth in the range of 5% to 10%.
1 Net income attributable to shareholders of VAMED AG
Conference Call
As part of the publication of the results for the first nine months of 2017, a conference call will be held on November 2, 2017 at 2 p.m. CET (9 a.m. EDT). All investors are cordially invited to follow the conference call in a live broadcast over the Internet at www.fresenius.com/investors. Following the call, a replay will be available on our website.
For additional information on the performance indicators, please refer to our website www.fresenius.com/alternative-performance-measures.
Diese Mitteilung enthält zukunftsbezogene Aussagen, die gewissen Risiken und Unsicherheiten unterliegen. Die zukünftigen Ergebnisse können erheblich von den zur Zeit erwarteten Ergebnissen abweichen, und zwar aufgrund verschiedener Risikofaktoren und Ungewissheiten wie zum Beispiel Veränderungen der Geschäfts-, Wirtschafts- und Wettbewerbssituation, Gesetzesänderungen, Ergebnisse klinischer Studien, Wechselkursschwankungen, Ungewissheiten bezüglich Rechtsstreitigkeiten oder Untersuchungsverfahren und die Verfügbarkeit finanzieller Mittel. Fresenius übernimmt keinerlei Verantwortung, die in dieser Mitteilung enthaltenen zukunftsbezogenen Aussagen zu aktualisieren.
Fresenius Helios continues to invest in the expansion and modernization of its hospitals and clinics. HELIOS Clinic Geesthacht, located just east of Hamburg, has opened an extension with 20 additional neurological rehabilitation places for young people. The investment in the specialist clinic for neurology and neurological rehabilitation is €4.6 million. In the state of Saxony, meanwhile, work has started on a new building for the emergency ward at HELIOS Hospital Leisnig. This €3.3 million project is scheduled for completion in autumn 2018.
If no timeframe is specified, information refers to H1/2017
Q2/2017:
- Sales: €8.5 billion (+18%, +17% in constant currency)
- EBIT1: €1,177 million (+14%, +13% in constant currency)
- Net income1,2: €459 million (+21%, +21% in constant currency)
H1/2017:
- Sales €16.9 billion (+19%, +17% in constant currency)
- EBIT1: €2,393 million (+20%, +19% in constant currency)
- Net income1,2: €916 million (+24%, +23% in constant currency)
Stephan Sturm, CEO of Fresenius, said: “We were able to sustain our strong momentum also in the second quarter. Strong increases in sales and earnings have put us well on track to reach our full-year targets. We are very pleased with the business development of Quirónsalud while its integration into Fresenius is proceeding according to plan. A focus in the second half will be to close the acquisitions announced by Fresenius Kabi. Those will put our business on an even broader foundation for future growth.”
1 Before special items2 Net income attributable to shareholders of Fresenius SE & Co. KGaA
2017 Group guidance confirmed
Fresenius confirms its guidance for 2017. Group sales are expected to increase by 15% to 17% in constant currency. Group net income1,2,3 is expected to grow by 19% to 21% in constant currency.
Pro forma the acquisitions of Akorn and Merck KGaA’s biosimilars business, the net debt/EBITDA4 ratio is expected to be approximately 3.3 at the end of 2017.
17% sales growth in constant currency
Group sales increased by 19% (17% in constant currency) to €16,894 million (H1/2016: €14,218 million). Organic sales growth was 6%5. Positive currency translation effects (2%) were mainly related to the appreciation of the U.S. dollar against the Euro. Acquisitions and the agreement with the United States Departments of Veterans Affairs and Justice at Fresenius Medical Care (“VA agreement”) contributed 11%. In Q2/2017, Group sales increased by 18% (17% in constant currency) to €8,532 million (Q2/2016: €7,203 million). Organic sales growth was 5%. Acquisitions contributed 12% while divestitures had no meaningful impact on sales.
1 Before transaction costs of ~€50 million for the acquisitions of Akorn, Inc. and Merck KGaA’s biosimilars business2 Before expected expenditures for the further development of Merck KGaA’s biosimilars business of ~€50 million (expected closing Q3/17)3 Net income attributable to shareholders of Fresenius SE & Co. KGaA4 Calculated at expected FY average exchange rates for both net debt and EBITDA; before transaction costs of ~€50 million; excluding further potential acquisitions5 Excluding effects of VA agreementFor a detailed overview of special items please see the reconciliation tables on page 15 in the PDF document.
Group sales by region:

23% net income2 growth in constant currency
Group EBITDA3 increased by 20% (18% in constant currency) to €3,098 million (H1/2016: €2,586 million). Group EBIT3 increased by 20% (19% in constant currency) to €2,393 million (H1/2016: €1,987 million). The EBIT margin3 increased to 14.2% (H1/2016: 14.0%). In Q2/2017, Group EBIT3 increased by 14% (13% in constant currency) to €1,177 million (Q2/2016: €1,028 million), with an EBIT margin3 of 13.8% (Q2/2016: 14.3%).
Group net interest reached -€326 million3 (H1/2016: -€291 million), mainly due to the financing of the Quirónsalud acquisition.
The Group tax rate increased to 28.5%3 (H1/2016: 28.3%), mainly driven by the higher proportion of U.S. pre-tax income, primarily due to the VA agreement. In Q2/2017, the Group tax rate was 27.9%3 (Q2/2016: 28.2%).
1 Including effects of VA agreement2 Net income attributable to shareholders of Fresenius SE & Co. KGaA; before special items3 Before special itemsFor a detailed overview of special items please see the reconciliation tables on page 15 in the PDF document.
Noncontrolling interest increased to €562 million (H1/2016: €480 million), of which 96% was attributable to the noncontrolling interest in Fresenius Medical Care.
Group net income1 increased by 24% (23% in constant currency) to €916 million (H1/2016: €736 million). The VA agreement increased net income1 growth by 2%-points. Earnings per share1 increased by 22% (21% in constant currency) to €1.65 (H1/2016: €1.35). In Q2/2017, Group net income1 increased by 21% (21% in constant currency) to €459 million (Q2/2016: €378 million). Earnings per share1 increased by 19% (19% in constant currency) to €0.82 (Q2/2016: €0.70).
1 Net income attributable to shareholders of Fresenius SE & Co. KGaA; before special itemsFor a detailed overview of special items please see the reconciliation tables on page 15 in the PDF document.
Continued investment in growth
Spending on property, plant and equipment was €709 million (H1/2016: €674 million), primarily for the modernization and expansion of dialysis clinics, production facilities as well as hospitals and day clinics. Total acquisition spending of €6,421 million (H1/2016: €505 million) was mainly related to the acquisition of Quirónsalud.
Strong operating cash flow
Operating cash flow increased by 26% to €1,683 million (H1/2016: €1,333 million), mainly driven by the excellent development at Fresenius Medical Care and Fresenius Kabi. The cash flow margin increased to 10.0% (H1/2016: 9.4%). Operating cash flow in Q2/2017 increased by 21% to €1,207 million (Q2/2016: €997 million), with a margin of 14.1% (Q2/2016: 13.8%). As expected, the operating cash flow of Fresenius Medical Care improved considerably in Q2/2017.
Free cash flow before acquisitions and dividends increased by 54% to €998 million (H1/2016: €649 million). Free cash flow after acquisitions and dividends was -€5,645 million
(H1/2016: -€207 million).
Solid balance sheet structure
The Group’s total assets increased by 13% (18% in constant currency) to €52,897 million (Dec. 31, 2016: €46,697 million), mainly due to the acquisition of Quirónsalud. Current assets grew by 9% (14% in constant currency) to €12,799 million (Dec. 31, 2016: €11,744 million). Non-current assets increased by 15% (19% in constant currency) to €40,098 million (Dec. 31, 2016: € 34,953 million).
Total shareholders’ equity grew by 1% (6% in constant currency) to €21,020 million (Dec. 31, 2016: €20,849 million). The equity ratio was 39.7% (Dec. 31, 2016: 44.6%).
Group debt increased by 35% (39% in constant currency) to €19,910 million (Dec. 31, 2016: € 14,780 million), mainly driven by the acquisition financing of Quirónsalud. As of June 30, 2017, the net debt/EBITDA ratio was 3.001 (Dec. 31, 2016: 2.331; pro forma Quirónsalud 3.091).
1 Net debt and EBITDA at LTM average exchange rates; before special itemsFor a detailed overview of special items please see the reconciliation tables on page 15 in the PDF document.
Business Segments
Fresenius Medical Care
Fresenius Medical Care is the world's largest provider of products and services for individuals with chronic kidney failure. As of June 30, 2017, Fresenius Medical Care was treating 315,305 patients in 3,690 dialysis clinics. Along with its core business, the company seeks to expand the range of medical services in the field of care coordination.

- 9% sales growth in constant currency in Q2
- 46% operating cash flow growth in Q2
- 2017 outlook confirmed
Sales increased by 14% (11% in constant currency, 7% organic) to €9,019 million (H1/2016: €7,942 million). Acquisitions/divestitures and the VA agreement contributed 4% in total. In Q2/2017, sales increased by 11% (9% in constant currency, 6% organic) to €4,471 million (Q2/2016: €4,026 million).
Health Care Services sales (dialysis services and care coordination) increased by 15% (11% in constant currency) to €7,418 million (H1/2016: €6,472 million). Product sales increased by 9% (7% in constant currency) to €1,601 million (H1/2016: €1,470 million).
In North America, sales increased by 14% to €6,600 million (H1/2016: €5,778 million). Health Care Services sales grew by 15% to €6,182 million (H1/2016: €5,383 million). Product sales increased by 6% to €418 million (H1/2016: €395 million).
Sales outside North America increased by 12% (10% in constant currency) to €2,410 million (H1/2016: €2,156 million). Health Care Services sales increased by 14% (11% in constant currency) to €1,236 million (H1/2016: €1,089 million). Product sales increased by 10% (8% in constant currency) to €1,174 million (H1/2016: €1,068 million).
EBIT increased by 16% (13% in constant currency) to €1,235 million (H1/2016: €1,068 million). The EBIT margin was 13.7% (H1/2016: 13.5%). Excluding the VA agreement EBIT increased by 7% (5% in constant currency). In Q2/2017, EBIT increased by 2% (stable in constant currency) to €584 million (Q2/2016: €571 million). The EBIT margin was 13.0% (Q2/2016: 14.2%).
Net income1 increased by 21% (19% in constant currency) to €577 million (H1/2016: €477 million). Excluding the VA agreement net income1 increased by 10% (8% in constant currency). In Q2/2017, net income1 grew by 2% (stable in constant currency) to €269 million (Q2/2016: €264 million).
Operating cash flow increased by 37% to €1,052 million (H1/2016: €767 million). The cash flow margin increased to 11.7% (H1/2016: 9.7%). In Q2/2017, operating cash flow increased by 46% to €882 million (Q2/2016: €604 million) with a cash flow margin of 19.7% (Q2/2016: 15.0%).
Fresenius Medical Care confirms its outlook for 2017. The company expects sales to grow by 8% to 10%2 in constant currency. Net income1,2 is expected to increase by 7% to 9% in constant currency.
1 Net income attributable to shareholders of Fresenius Medical Care AG & Co. KGaA2 Excluding effects of VA agreement
For further information, please see Fresenius Medical Care’s Investor News at www.freseniusmedicalcare.com.
Fresenius Kabi
Fresenius Kabi offers intravenously administered generic drugs, clinical nutrition and infusion therapies for seriously and chronically ill patients in the hospital and outpatient environments. The company is also a leading supplier of medical devices and transfusion technology products.

- 7% organic sales growth in Q2; positive contributions from all regions
- 9% constant currency EBIT growth in Q2
- 2017 outlook confirmed
Sales increased by 9% (7% in constant currency, 7% organic) to €3,202 million (H1/2016: €2,946 million). Acquisitions/divestitures had no meaningful impact on sales. In Q2/2017, sales increased by 8% (7% in constant currency and organic) to €1,598 million (Q2/2016: €1,476 million).
Sales in Europe increased by 5% (6% organic) to €1,097 million (H1/2016: €1,048 million). Currency translation effects had no meaningful impact. In Q2/2017, sales increased by 3% (4% organic) to €553 million (Q2/2016: €536 million).
Sales in North America increased by 9% (6% organic) to €1,187 million (H1/2016: €1,086 million). In Q2/2017, sales increased by 11% (9% organic) to €568 million (Q2/2016: €510 million).
Sales in Asia-Pacific increased by 10% (10% organic) to €582 million (H1/2016: €531 million). In Q2/2017, sales increased by 9% (10% organic) to €302 million (Q2/2016: €277 million).
Sales in Latin America/Africa increased by 20% (11% organic) to €336 million (H1/2016: €281 million), mainly due to inflation-driven price increases. In Q2/2017, sales increased by 14% (8% organic) to €175 million (Q2/2016: €153 million).
EBIT1 increased by 7% (6% in constant currency) to €622 million (H1/2016: €582 million). The EBIT margin1 was 19.4% (H1/2016: 19.8%). In Q2/2017, EBIT1 increased by 11% (9% in constant currency) to €309 million (Q2/2016: €279 million). The EBIT margin1 increased to 19.3% (Q2/2016: 18.9%).
Net income2 increased by 13% (11% in constant currency) to €379 million (H1/2016: €336 million). In Q2/2017, net income2 increased by 15% (13% in constant currency) to €188 million (Q2/2016: €163 million).
Operating cash flow increased by 17% to €395 million (H1/2016: €339 million) driven by strong operating results and improved net working capital. The margin increased to 12.3% (H1/2016: 11.5%). In Q2/2017, operating cash flow was €203 million (Q2/2016: €212 million). The cash flow margin was 12.7% (Q2/2016: 14.4%).
Fresenius Kabi confirms its outlook for 2017 and expects 5% to 7% organic sales growth and EBIT growth in constant currency of 6% to 8%3,4.
1 Before special items2 Net income attributable to shareholders of Fresenius SE & Co. KGaA; before special items3 Before transaction costs of ~€50 million for the acquisitions of Akorn, Inc. and Merck KGaA’s biosimilars business4 Before expected expenditures for the further development of Merck KGaA’s biosimilars business of ~€50 million (expected closing Q3/17)For a detailed overview of special items please see the reconciliation tables on page 15 in the PDF document.
Fresenius Helios
Fresenius Helios is Europe's leading private hospital operator. The company comprises HELIOS Kliniken in Germany and Quirónsalud in Spain. HELIOS Kliniken operates 112 hospitals, thereof 88 acute care clinics and 24 post-acute care clinics, and treats more than 5.2 million patients annually. Quirónsalud operates 44 hospitals, 44 outpatient centers and around 300 occupational risk prevention centers, and treats approximately 9.7 million patiens per year.

- 52% sales growth (2% excluding Quirónsalud) in Q2
- 63% EBIT increase (3% excluding Quirónsalud) in Q2
- 2017 outlook confirmed
Sales increased by 46% (4% organic) to €4,256 million (H1/2016: €2,912 million). Acquisitions, mainly Quirónsalud, increased sales by 42%. In Q2/2017, sales increased by 52% (2% organic) to €2,238 million (Q2/2016: €1,477 million).
Sales of HELIOS Kliniken2 increased by 4% (4% organic) to €3,038 million (H1/2016: €2,912 million). In Q2/2017, sales increased by 2% (2% organic) to €1,510 million (Q2/2016: €1,477 million). Quirónsalud is consolidated since February 1, 2017 and generated sales of €1,218 million (thereof €728 million in Q2/2017).
EBIT grew by 62% to €537 million (H1/2016: €332 million). The EBIT margin increased to 12.6% (H1/2016: 11.4%). In Q2/2017, EBIT increased by 63% to €282 million (Q2/2016: €173 million). The EBIT margin increased to 12.6% (Q2/2016: 11.7%).
EBIT of HELIOS Kliniken2 increased by 8% to €359 million with a margin of 11.8% (H1/2016: 11.4%). In Q2/2017, EBIT increased by 3% to €178 million (Q2/2016: €173 million). EBIT of Quirónsalud was €178 million (thereof €104 million in Q2/2017) with a margin of 14.6%.
Net income1 increased by 42% to €373 million (H1/2016: €262 million). In Q2/2017, net income1 increased by 39% to €192 million (Q2/2016: €138 million).
1 Net income attributable to shareholders of Fresenius SE & Co. KGaA2 HELIOS Kliniken Germany, excluding Quirónsalud
Operating cash flow increased by 32% to €304 million (H1/2016: €230 million) driven by the first-time consolidation of Quirónsalud and good operating results. The margin was 7.1% (H1/2016: 7.9%).
Fresenius Helios confirms its outlook for 2017 and projects organic sales growth of 3% to 5%1 and sales of ~€8.6 billion (thereof Quirónsalud: ~€2.5 billion2). EBIT is expected to increase to €1,020 to €1,070 million (thereof Quirónsalud: €300 to 320 million2).
1 HELIOS Kliniken Germany, excluding Quirónsalud2 Quirónsalud consolidated for 11 months
Fresenius Vamed
Fresenius Vamed manages projects and provides services for hospitals and other health care facilities worldwide. The portfolio ranges along the entire value chain: from project development, planning, and turnkey construction, via maintenance and technical management, to total operational management.

- 2% sales growth in Q2 driven by service business
- Project business with strong order intake of €412 million in H1
- 2017 outlook confirmed
Sales increased by 2% (2% organic) to €481 million (H1/2016: €472 million). Sales in the project business decreased by 6% to €184 million (H1/2016: €195 million). Sales in the service business grew by 7% to €297 million (H1/2016: €277 million). In Q2/2017, sales increased by 2% (1% organic) to €258 million (Q2/2016: €254 million).
EBIT increased by 6% to €17 million (H1/2016: €16 million). The EBIT margin increased to 3.5% (H1/2016: 3.4%). In Q2/2017, EBIT increased by 22% to €11 million (Q2/2016: €9 million) with an EBIT margin of 4.3%.
Net income1 remained unchanged at €11 million. In Q2/2017, net income1 increased by 17% to €7 million (Q2/2016: €6 million).
Order intake reached a strong €412 million, but could not quite match the previous year’s excellent level (H1/2016: €465 million). As of June 30, 2017, order backlog grew to an all-time high of €2,188 million (December 31, 2016: €1,961 million).
Fresenius Vamed confirms its outlook for 2017 and expects both organic sales growth and EBIT growth in the range of 5% to 10%.
1 Net income attributable to shareholders of VAMED AG
Conference Call
As part of the publication of the results for the first half of 2017, a conference call will be held on August 1, 2017 at 2 p.m. CEDT (8 a.m. EDT). All investors are cordially invited to follow the conference call in a live broadcast over the Internet at www.fresenius.com/investors. Following the call, a replay will be available on our website.
For additional information on the performance indicators, please refer to our website www.fresenius.com/alternative-performance-measures.
This release contains forward-looking statements that are subject to various risks and uncertainties. Future results could differ materially from those described in these forward-looking statements due to certain factors, e.g. changes in business, economic and competitive conditions, regulatory reforms, results of clinical trials, foreign exchange rate fluctuations, uncertainties in litigation or investigative proceedings, and the availability of financing. Fresenius does not undertake any responsibility to update the forward-looking statements in this release.
Q1/2017:
• Sales: €8.4 billion (+19%, +17% in constant currency)
• EBIT: €1,216 million (+27%, +25% in constant currency)
• Net income1 : €457 million (+28%, +26% in constant currency)
1 Net income attributable to shareholders of Fresenius SE & Co. KGaA
Stephan Sturm, CEO of Fresenius, said: “Fresenius made an excellent start in 2017. All four business segments developed very well in the first quarter and continue to have healthy growth prospects. That makes us all the more optimistic as we look ahead. From this position of strength, and bolstered by strategically important acquisitions, we are building an even stronger foundation for our long-term success.”
2017 Group earnings guidance raised1,2,3
Based on the Group’s strong Q1 results and ongoing bright prospects for the remainder of the year, Fresenius raises its 2017 Group earnings guidance published in February 2017. Group net income3 on a like-for-like basis, i.e. before effects of the recently announced acquisitions at Fresenius Kabi, is now expected to grow by 19% to 21% in constant currency (previously: 17% to 20%).
Including expenditures for the further development of Merck KGaA’s biosimilars business, which is expected to be acquired in the second half of 2017, Fresenius projects net income3 growth in constant currency within the previous range of 17% to 20%.
Fresenius confirms its sales guidance. Group sales are expected to increase by 15% to 17% in constant currency.
Pro forma the acquisitions of Akorn and Merck KGaA’s biosimilars business, the net debt/EBITDA4ratio is expected to be approximately 3.3 at the end of 2017.
17% sales growth in constant currency
Group sales increased by 19% (17% in constant currency) to €8,362 million (Q1/2016: €7,015 million). Organic sales growth was 7%5. Positive currency translation effects (2%) were mainly related to the appreciation of the US-Dollar against the Euro. Divestitures had no impact on sales. Acquisitions and the €100 million agreement with the United States Departments of Veterans Affairs and Justice at Fresenius Medical Care North America (“VA agreement”) contributed 10%.
1 Before transaction costs of ~€50 million for the acquisitions of Akorn, Inc. and Merck KGaA’s biosimilars business2 Before expected expenditures for the further development of Merck KGaA’s biosimilars business of ~€50 million (expected closing H2/17)3 Net income attributable to shareholders of Fresenius SE & Co. KGaA4 Calculated at expected FY average exchange rates for both net debt and EBITDA; before transaction costs of ~€50 million; excluding further potential acquisitions5 Excluding effects of VA-agreement
Group sales by region:

26% net income1 growth in constant currency
Group EBITDA increased by 26% (23% in constant currency) to €1,560 million (Q1/2016: €1,241 million). Group EBIT increased by 27% (25% in constant currency) to €1,216 million (Q1/2016: €959 million). The EBIT margin increased to 14.5% (Q1/2016: 13.7%).
Group net interest increased to -€157 million (Q1/2016: -€152 million), mainly due to the financing of the Quirónsalud acquisition.
The Group tax rate increased to 29.1% (Q1/2016: 28.4%), mainly driven by the higher proportion of U.S. pre-tax income, primarily due to the VA-agreement.
Noncontrolling interest increased to €294 million (Q1/2016: €220 million), of which 96% was attributable to the noncontrolling interest in Fresenius Medical Care.
Group net income1 increased by 28% (26% in constant currency) to €457 million (Q1/2016: €358 million). The VA-agreement increased net income1 by €18 million or 5%-points. Earnings per share1 increased by 28% (25% in constant currency) to €0.83 (Q1/2016: €0.65).
1 Net income attributable to shareholders of Fresenius SE & Co. KGaA
Continued investment in growth
Spending on property, plant and equipment was €328 million (Q1/2016: €315 million), primarily for the modernization and expansion of dialysis clinics, production facilities and hospitals. Total acquisition spending of €6,083 million (Q1/2016: €204 million) was mainly related to the acquisition of Quirónsalud.
Strong operating cash flow
Operating cash flow increased by 42% to €476 million (Q1/2016: €336 million), mainly driven by the excellent development at Fresenius Kabi and Fresenius Helios. The cash flow margin was 5.7% (Q1/2016: 4.8%).
Free cash flow before acquisitions and dividends increased to €148 million (Q1/2016: €2 million). Free cash flow after acquisitions and dividends was -€5,393 million
(Q1/2016: -€241 million).
Solid balance sheet structure
The Group’s total assets increased by 17% (17% in constant currency) to €54,418 million (Dec. 31, 2016: €46,697 million), mainly due to the acquisition of Quirónsalud. Current assets grew by 11% (12% in constant currency) to €13,077 million (Dec. 31, 2016: €11,744 million). Non-current assets increased by 18% (19% in constant currency) to €41,341 million (Dec. 31, 2016: €?34,953 million).
Total shareholders’ equity grew by 5% (6% in constant currency) to €21,921 million (Dec. 31, 2016: €20,849 million). The equity ratio was 40.3% (Dec. 31, 2016: 44.6%).
Group debt increased by 37% (37% in constant currency) to €20,210 million (Dec. 31, 2016: €?14,780 million), mainly driven by the acquisition financing of Quirónsalud. As of March 31, 2017, the net debt/EBITDA ratio was 2.981,3 (Dec. 31, 2016: 2.331,3/3.091,2,3).
1 Net debt and EBITDA at LTM average exchange rates2 Pro forma Quirónsalud3 Pro forma acquisitions
Increased number of employees
As of March 31, 2017, the number of employees increased by 13% to 263,957 (Dec. 31, 2016: 232,873).
Business segments
Fresenius Medical Care
Fresenius Medical Care is the world's largest provider of products and services for individuals with chronic kidney failure. As of March 31, 2017, Fresenius Medical Care was treating 310,473 patients in 3,654 dialysis clinics. Along with its core business, the company seeks to expand the range of medical services in the field of care coordination.

• 12% sales growth in constant currency (10% excluding the VA-agreement)
• 41% net income growth1 in constant currency (14% excluding the VA-agreement)
• 2017 outlook confirmed
1 Net income attributable to shareholders of Fresenius Medical Care AG & Co. KGaA
Sales increased by 16% (12% in constant currency) to €4,548 million (Q1/2016: €3,916 million). Organic sales growth was 8%. Acquisitions/divestitures and the VA agreement contributed 4% in total.
Health Care services sales (dialysis services and care coordination) increased by 18% (14% in constant currency) to €3,769 million (Q1/2016: €3,199 million). Product sales increased by 8% (6% in constant currency) to €779 million (Q1/2016: €718 million).
In North America, sales increased by 18% (14% excluding the VA-agreement) to €3,375 million (Q1/2016: €2,862 million). Health Care services sales grew by 19% to €3,165 million (Q1/2016: €2,670 million). Product sales increased by 9% to €210 million (Q1/2016: €192 million).
Sales outside North America increased by 11% (8% in constant currency) to €1,169 million (Q1/2016: €1,051 million). Health Care services sales increased by 14% (10% in constant currency) to €604 million (Q1/2016: €528 million). Product sales increased by 8% (6% in constant currency) to €564 million (Q1/2016: €523 million).
EBIT increased by 31% (28% in constant currency) to €651 million (Q1/2016: €497 million). The EBIT margin was 14.3% (Q1/2016: 12.7%). Excluding the VA-agreement (€99 million) EBIT increased by 11% (8% in constant currency).
Net income1 increased by 45% (41% in constant currency) to €308 million (Q1/2016: €213 million). Excluding the VA-agreement (€59 million) net income1 increased by 17% (14% in constant currency).
Operating cash flow increased by 4% to €170 million (Q1/2016: €163 million). The cash flow margin was 3.7% (Q1/2016: 4.2%). The VA-agreement partially offset the impact of seasonality in invoicing at Fresenius Medical Care in North America. Fresenius Medical Care expects that this timing effect will have no meaningful impact on the full year 2017.
Fresenius Medical Care confirms its outlook for 2017. The company expects sales to grow by 8% to 10%2 in constant currency. Net income1,2 is expected to increase by 7% to 9% in constant currency.
1 Net income attributable to shareholders of Fresenius Medical Care AG & Co. KGaA2 Excluding effects of VA-agreementFor further information, please see Fresenius Medical Care’s press release at www.freseniusmedicalcare.com.
Fresenius Kabi
Fresenius Kabi offers intravenously administered generic drugs, clinical nutrition and infusion therapies for seriously and chronically ill patients in the hospital and outpatient environments. The company is also a leading supplier of medical devices and transfusion technology products.

• 7% organic sales growth; positive contributions from all regions
• 2% constant currency EBIT growth despite very strong PY quarter
• 2017 outlook raised: 6% to 8%2,3, EBIT growth in constant currency expected
Sales increased by 9% (organic growth: 7%) to €1,604 million (Q1/2016: €1,470 million). Positive currency translation effects (2%) were mainly related to the appreciation of the US-Dollar against the Euro. Acquisitions/divestitures had no impact on sales.
Sales in Europe increased by 6% (organic growth: 7%) to €544 million (Q1/2016: €512 million). Currency translation effects reduced sales by 1%.
Sales in North America increased by 7% (organic growth: 4%) to €619 million (Q1/2016: €576 million).
Sales in Asia-Pacific increased by 10% (organic growth: 10%) to €280 million (Q1/2016: €254 million).
Sales in Latin America/Africa increased by 26% to €161 million (Q1/2016: €128 million). Organic sales growth was 14%, mainly due to inflation-driven price increases.
EBIT increased by 3% (2% in constant currency) to €313 million (Q1/2016: €303 million). The EBIT margin was 19.5% (Q1/2016: 20.6%).
Net income1 increased by 10% (9% in constant currency) to €191 million (Q1/2016: €173 million).
Operating cash flow increased by 51% to €192 million (Q1/2016: €127 million) driven by strong operating results and improved net working capital. The margin increased to 12.0% (Q1/2016: 8.6%).
Fresenius Kabi raises its outlook for 2017 and now expects EBIT growth in constant currency of 6% to 8%2,3, (previously 5% to 7%). The company confirms its guidance of 5% to 7% organic sales growth.
1 Net income attributable to shareholders of Fresenius SE & Co. KGaA2 Before transaction costs of ~€50 million for the acquisitions of Akorn, Inc. and Merck KGaA’s biosimilars business3 Before expected expenditures for the further development of Merck KGaA’s biosimilars business of ~€50 million (expected closing H2/17)
Fresenius Helios
Fresenius Helios is Europe's leading private hospital operator. The company comprises HELIOS Kliniken in Germany and Quirónsalud in Spain. HELIOS Kliniken operates 112 hospitals, thereof 88 acute care clinics and 24 post-acute care clinics, and treats more than 5.2 million patients annually. Quirónsalud operates 44 hospitals, 43 outpatient centers and around 300 occupational risk prevention centers, and treats approximately 9.7 million patiens per year.

• 5% organic sales growth
• 60% EBIT increase (14% excluding Quirónsalud)
• 2017 outlook confirmed
Sales increased by 41% (organic growth: 5%) to €2,018 million (Q1/2016: €1,435 million). Acquisitions, mainly Quirónsalud, increased sales by 36%. Quirónsalud is consolidated since February 1, 2017. Sales of Quirónsalud were €490 million in February and March 2017.
Sales of HELIOS Kliniken2 increased by 6% (organic growth: 5%) to €1,528 million.
EBIT grew by 60% to €255 million (Q1/2016: €159 million). The EBIT margin increased to 12.6% (Q1/2016: 11.1%).
EBIT of HELIOS Kliniken2 increased by 14% to €181 million with a margin of 11.8% (Q1/2016: 11.1%). EBIT of Quirónsalud was €74 million with a margin of 15.1%.
Net income1 increased by 46% to €181 million (Q1/2016: €124 million).
1 Net income attributable to shareholders of Fresenius SE & Co. KGaA2 HELIOS Kliniken Germany, excluding Quirónsalud
Operating cash flow increased by 179% to €184 million (Q1/2016: €66 million) driven by the first time consolidation of Quirónsalud and good operating results. The margin increased to 9.1% (Q1/2016: 4.6%).
Fresenius Helios confirms its outlook for 2017 and projects organic sales growth of 3% to 5%1 and sales of ~€8.6 billion (thereof Quirónsalud: ~€2.5 billion2). EBIT is expected to increase to €1,020 to €1,070 million (thereof Quirónsalud: €300 to 320 million2).
1 HELIOS Kliniken Germany, excluding Quirónsalud2 Quirónsalud consolidated for 11 months
Fresenius Vamed
Fresenius Vamed manages projects and provides services for hospitals and other health care facilities worldwide. The portfolio ranges along the entire value chain: from project development, planning, and turnkey construction, via maintenance and technical management, to total operational management.

• 2% organic sales growth driven by service business
• Project business with strong order intake of €220 million
• 2017 outlook confirmed
Sales increased by 2% (organic growth: 2%) to €223 million (Q1/2016: €218 million). Sales in the project business decreased by 9% to €77 million (Q1/2016: €85 million). Sales in the service business grew by 10% to €146 million (Q1/2016: €133 million).
EBIT decreased by 14% to €6 million (Q1/2016: €7 million). The EBIT margin decreased to 2.7% (Q1/2016: 3.2%).
Net income1 decreased by 20% to €4 million (Q1/2016: €5 million).
Order intake reached a strong €220 million, could not quite match the previous year’s excellent level (Q1/2016: €237 million). As of March 31, 2017, order backlog grew to a record €2,104 million (December 31, 2016: €1,961 million).
Fresenius Vamed confirms its outlook for 2017 and expects both organic sales growth and EBIT growth in the range of 5% to 10%.
1 Net income attributable to shareholders of VAMED AG
Conference Call
As part of the publication of the results for the first quarter of 2017, a conference call will be held on May 3, 2017 at 2 p.m. CEDT (8 a.m. EDT). All investors are cordially invited to follow the conference call in a live broadcast over the Internet at www.fresenius.com/investors. Following the call, a replay will be available on our website.
# # #
For additional information on the performance indicators used please refer to our website https://www.fresenius.com/alternative-performance-measures.
This release contains forward-looking statements that are subject to various risks and uncertainties. Future results could differ materially from those described in these forward-looking statements due to certain factors, e.g. changes in business, economic and competitive conditions, regulatory reforms, results of clinical trials, foreign exchange rate fluctuations, uncertainties in litigation or investigative proceedings, and the availability of financing. Fresenius does not undertake any responsibility to update the forward-looking statements in this release.
If no timeframe is specified, information refers to fiscal year 2016.
Fiscal year 2016:
- Sales: €29.1 billion
(+5%, +6% in constant currency) - EBIT1: €4,327 million
(+9%, +10% in constant currency) - Net income1,2:€1,593 million
(+12%, +13% in constant currency) - Dividend proposal: +13% to €0.62 per share
Q4/2016:
- Sales: €7.7 billion
(+7%, +6% in constant currency) - EBIT1 €1,235 million
(+11%, +11% in constant currency) - Net income1,2 €439 million
(+6%, +7% in constant currency)
Group guidance 20173:
- Sales growth of 15% to 17% in constant currency
- Net income2 growth of 17% to 20% in constant currency
Targets 20203:
- Group sales4: between €43 billion and €47 billion
- Group net income2,4: between €2.4 billion and €2.7 billion
1 2015 before special items2 Net income attributable to shareholders of Fresenius SE & Co. KGaA3 Guidance according to IFRS; for a detailed overview of 2016 IFRS figures please see p. 14 of the pdf file4 At comparable exchange rates; includes small and mid-size acquisitions; at current IFRS-rules
Stephan Sturm, CEO of Fresenius, said: “Fresenius had another truly outstanding year in 2016, setting new sales and earnings records. All four business segments again developed very successfully. The company’s prospects are excellent, and in the coming years Fresenius is targeting continued, dynamic growth. We never forget that patients are at the center of everything we do. Providing them with high-quality yet affordable healthcare around the world is the key to our business success."
Positive Group guidance for 20171
For 2017, Fresenius projects sales growth of 15% to 17% in constant currency. Net income2 is expected to grow by 17% to 20% in constant currency.
The net debt/EBITDA3 ratio is expected to be within the bottom half of Fresenius’ self-imposed target range of 2.5 to 3.0 at the end of 2017.
New ambitious targets for 20201,4
For 2020, Group sales are expected to reach €43 billion to €47 billion. Calculated on the basis of reported 2016 IFRS sales (€29,471 million) and the mid-point of the target range (€45 billion), this corresponds to a compounded annual growth rate (CAGR) of 11.2%. Based on the very strong guidance for 2017, this would result in a 2018-2020 CAGR of 8.7%.5
Group net income2 is expected to increase to €2.4 billion to €2.7 billion. Calculated on the basis of reported 2016 IFRS net income (€1,560 million) and the mid-point of the target range (€2,550 million) this corresponds to a CAGR of 13.1%. Based on the very strong guidance for 2017, this would result in a 2018-2020 CAGR of 10.5%.6
24th consecutive dividend increase proposed
Based on the strong financial results, the Management Board will propose to the Supervisory Board a dividend increase of 13% to €0.62 per share (2015: €0.55). The expected total dividend distribution is €343 million.
1 Guidance according to IFRS; for a detailed overview of 2016 IFRS figures please see p. 14of the pdf file2 Net income attributable to shareholders of Fresenius SE & Co. KGaA3 Calculated at expected annual average exchange rates, for both net debt and EBITDA; without large unannounced acquisitions4 At comparable exchange rates; including small and mid-size acquisitions; at current IFRS rules5 Based on the mid-point of the 2017 sales guidance, adjusted for current exchange rates (~€35 bn), and the mid-point of the 2020 sales target range (€45 bn)6 Based on the mid-point of the 2017 net income guidance, adjusted for current exchange rates (~€1,890 m), and the mid-point of the 2020 net income target range (€2,550 m)
6% sales growth in constant currency
Group sales increased by 5% (6% in constant currency) to €29,083 million (2015: €27,626 million). Organic sales growth was 6%. Acquisitions contributed 1% and divestitures reduced sales by 1%. Slightly negative currency translation effects (1%) were mainly driven by the devaluation of Latin American currencies and the Chinese yuan against the Euro. In Q4/2016, Group sales increased by 7% (6% in constant currency) to €7,738 million (Q4/2015: €7,257 million). Organic sales growth was 5%. Acquisitions contributed 1%, while divestitures had no major impact on sales.
Group sales by region:

13% net income1,2 growth in constant currency
Group EBITDA2 increased by 8% (9% in constant currency) to €5,500 million (2015: €5,073 million). Group EBIT2 increased by 9% (10% in constant currency) to €4,327 million (2015: €3,958 million). The EBIT margin2 increased to 14.9% (2015: 14.3%).
In Q4/2016, Group EBIT2 increased by 11% (11% in constant currency) to €1,235 million (Q4/2015: €1,109 million), the EBIT margin2 improved to 16.0% (Q4/2015: 15.3%).
Group net interest decreased to -€582 million (2015: -€613 million), mainly due to favourable financing terms and interest savings on lower average debt. In Q4/2016, Group net interest increased to -€149 million (Q4/2015: -€137 million) mainly due to the bridge financing for the Quirónsalud acquisition.
The Group tax rate2 decreased to 28.1% (2015: 29.4%). The decrease is mainly due to released tax liabililities at Fresenius Medical Care in Q3/2016. In Q4/2016, the Group tax rate also decreased to 28.1% (Q4/2015: 28.8%).
Noncontrolling interest was €1,101 million (2015: €939 million), of which 96% was attributable to the noncontrolling interest in Fresenius Medical Care.
Group net income1,2 increased by 12% (13% in constant currency) to €1,593 million (2015: €1,423 million). Earnings per share1,2 increased by 12% (13% in constant currency) to €2.92 (2015: €2.61). In Q4/2016, Group net income1,2 increased by 6% (7% in constant currency) to €439 million (Q4/2015: €414 million). Earnings per share1,2 increased by 7% (8% in constant currency) to €0.81 (Q4/2015: €0.75).
Continued investment in growth
Spending on property, plant and equipment was €1,621 million (2015: €1,512 million), primarily for the modernization and expansion of dialysis clinics, production facilities and hospitals. This corresponds to 5.6% of sales.
Total acquisition spending increased to €926 million (2015: €517 million), mainly related to acquisitions at Fresenius Medical Care.
1 Net income attributable to shareholders of Fresenius SE & Co. KGaA2 2015 before special items
For a detailed overview of special items please see the reconciliation tables on pages 17-18 of the pdf file.
Excellent cash flow development
Operating cash flow increased by 7% to €3,574 million (2015: €3,327 million) with a margin of 12.3% (2015: 12.0%). The excellent cash flow was driven by a strong cash flow generation at Fresenius Medical Care and especially the record cash flow at Fresenius Kabi. Operating cash flow in Q4/2016 increased by 12% to €1,315 million (Q4/2015: €1,176 million) with a margin of 17.0% (Q4/2015: 16.2%).
Free cash flow before acquisitions and dividends increased by 6% to €1,971 million (2015: €1,865 million), with a margin of 6.8% (2015: 6.8%). Free cash flow after acquisitions and dividends was €748 million (2015: €1,194 million).
Solid balance sheet structure
The Group’s total assets increased by 8% (6% in constant currency) to €46,447 million (Dec. 31, 2015: €42,959 million), driven by its growing scale of operations. Current assets grew by 13% (11% in constant currency) to €11,799 million (Dec. 31, 2015: €10,479 million). Non-current assets increased by 7% (5% in constant currency) to €34,648 million (Dec. 31, 2015: € 32,480 million).
Total shareholders’ equity increased by 13% (11% in constant currency) to €20,420 million (Dec. 31, 2015: €18,003 million). The equity ratio increased to 44.0% (Dec. 31, 2015: 41.9%).
Group debt remained nearly unchanged (-2% in constant currency) at €14,780 million (Dec. 31, 2015: € 14,769 million). Group net debt decreased by 4% (-5% in constant currency) to € 13,201 million (Dec. 31, 2015: € 13,725 million). As of December 31, 2016, the net debt/EBITDA ratio was 2.341 (December 31, 2015: 2.682). EBITDA growth and net debt reduction made an about equal contribution to this substantial improvement of the ratio.
Increased number of employees
As of December 31, 2016, the number of employees increased by 5% to 232,873 (Dec. 31, 2015: 222,305).
1 At LTM average exchange rates for both net debt and EBITDA; pro forma acquisitions2 Before special items; at LTM average exchange rates for both net debt and EBITDA
For a detailed overview of special items please see the reconciliation tables on pages 17-18 of the pdf file.
Business Segments
Fresenius Medical Care
Fresenius Medical Care is the world's largest provider of products and services for individuals with renal diseases. As of December 31, 2016, Fresenius Medical Care was treating 308,471 patients in 3,624 dialysis clinics. Along with its core business, the company seeks to expand the range of medical services in the field of care coordination.

- 7% sales growth, 16% net income growth1,2
- Health Care services with positive growth momentum (sales +8%)
- 2017 outlook3: 8% to 10% sales growth in constant currency and 7 to 9% net income growth1,5 in constant currency expected
Sales increased by 7% (8% in constant currency) to US$17,911 million (2015: US$16,738 million). Organic sales growth was 7%. Acquisitions and divestitures increased sales by 1%. Currency translation effects reduced sales by 1%. In Q4/2016, sales increased by 8% (9% in constant currency) to US$4,687 million (Q4/2015: US$4,348 million).
Health Care services sales (dialysis services and care coordination) increased by 8% (9% in constant currency) to US$14,519 million (2015: US$13,392 million). Dialysis product sales increased by 1% (4% in constant currency) to US$3,392 million (2015: US$3,346 million).
In North America, sales increased by 9% to US$12,886 million (2015: US$11,813 million). Health Care services sales grew by 10% to US$11,982 million (2015: US$10,932 million). Dialysis product sales increased by 3% to US$904 million (2015: US$881 million).
1 Net income attributable to shareholders of Fresenius Medical Care AG & Co. KGaA2 2016 before acquisitions (US$ 15 million after tax), 2015 before settlement costs for an agreement in principle for GranuFlo® / NaturaLyte® case (- US$ 37 million after tax), and acquisitions (US$ 9 million after tax)3 Guidance according to IFRS and in Euro currency; for a detailed overview of 2016 IFRS figures please see p. 15 of the pdf file4 Based on 2016 sales of €16,570 million. The effects of the agreement with the U.S. Departments of Veterans Affairs and Justice are excluded.5 Based on 2016 net income of €1,144 million. The effects of the agreement with the U.S. Departments of Veterans Affairs and Justice are excluded.
Sales outside North America increased by 2% (7% in constant currency) to US$5,011 million (2015: US$4,897 million). Health Care services sales increased by 3% (9% in constant currency) to US$2,537 million (2015: US$2,459 million). Dialysis product sales increased by 2% (5% in constant currency) to US$2,474 million (2015: US$2,437 million).
EBIT increased by 13% (14% in constant currency) to US$2,638 million (2015: US$2,327 million). The EBIT margin was 14.7% (2015: 13.9%). Adjusted for one-time items1, EBIT increased by 10%. In Q4/2016, EBIT increased by 19% (19% in constant currency) to US$786 million (Q4/2015: US$662 million). The EBIT margin was 16.8% (Q4/2015: 15.2%).
Net income attributable to shareholders of Fresenius Medical Care AG & Co. KGaA excluding one-time items2 increased by 16% to US$1,228 million (2015: US$1,057 million). Net income5 including one-time items increased by 21% (21% in constant currency). Net income attributable to non-controlling interest increased by 8% to US$306 million. In Q4/2016, net income5 increased by 23% to US$388 million (2015: US$317 million).
Operating cash flow increased by 9% to US$2,140 million (2015: US$1,960 million), despite a discretionary cash contribution of US$100 million to Fresenius Medical Care’s pension plan assets in the United States in Q3/2016. The cash flow margin was 11.9% (2015: 11.7%). In Q4/2016, operating cash flow reached an excellent US$844 million (Q4/2015: US$548 million) with a margin of 18.0% (Q4/2015: 12.6%).
For 2017, Fresenius Medical Care expects sales to grow by 8% to 10%3,4 in constant currency. Net income attributable to shareholders of Fresenius Medical Care AG & Co. KGaA is expected to increase by 7% to 9%3,5,6 in constant currency in 2017. The effects of the agreement with the U.S. Departments of Veterans Affairs and Justice are excluded.
For further information, please see Fresenius Medical Care’s Investor News at www.freseniusmedicalcare.com.
1 2016 before acquisitions (US$39 million before tax), 2015 before settlement costs for an agreement in principle for GranuFlo® / NaturaLyte® case (- US$ 60 million before tax), and acquisitions (US$ 16 million before tax)2 2016 before acquisitions (US$ 15 million after tax), 2015 before settlement costs for an agreement in principle for GranuFlo® / NaturaLyte® case (- US$ 37 million after tax), and acquisitions (US$ 9 million after tax)3 Guidance according to IFRS and in Euro currency; for a detailed overview of 2016 IFRS figures please see p. 15 of the pdf file4 Based on 2016 sales of €16,570 million.5 Net income attributable to shareholders of Fresenius Medical Care AG & Co. KGaA6 Based on 2016 net income of €1,144 million.
Fresenius Kabi
Fresenius Kabi offers intravenously administered generic drugs, clinical nutrition and infusion therapies for seriously and chronically ill patients in the hospital and outpatient environments. The company is also a leading supplier of medical devices and transfusion technology products.

- 5% organic sales growth, 5% EBIT1 growth in constant currency
- Operating cash flow and cash flow margin at all-time high
- 2017 outlook3: 5% to 7% organic sales growth and 5% to 7% EBIT growth in constant currency expected
Sales increased by 1% (4% in constant currency) to €6,007 million (2015: €5,950 million). Organic sales growth was 5%. Divestitures reduced sales by 1%. Negative currency translation effects (-3%) were mainly related to the devaluation of Latin American currencies and the Chinese yuan against the Euro. In Q4/2016, sales increased by 2% (3% in constant currency) to €1,550 million (Q4/2015: €1,519 million). Organic sales growth was 3%.
Sales in Europe grew by 1% (organic growth: 3%) to €2,135 million (2015: €2,123 million). Divestments, including the sale of the German oncology compounding business in February 2015, reduced sales by 1%.
Sales in North America increased by 4% (organic growth: 3%) to €2,170 million (2015: €2,093 million), mainly driven by new product launches. Asia-Pacific sales decreased by 3% (organic growth: 8%) to €1,108 million (2015: €1,141 million) due to currency translation effects. With €594 million (2015: €593 million), sales in Latin America/Africa was on prior year level (organic growth: 14%).
EBIT1 increased by 3% (5% in constant currency) to €1,224 million (2015: €1,189 million). The EBIT margin1 improved to 20.4% (2015: 20.0%). In Q4/2016, EBIT1 decreased by 3% ( 1% in constant currency) to €308 million (Q4/2015: €317 million). The EBIT margin1 was 19.9% (Q4/2015: 20.9%).
Net income2 increased by 7% (9% in constant currency) to €716 million (2015: €669 million). In Q4/2016, net income2 decreased by 3% (-2% in constant currency) to €184 million (Q4/2015: €190 million).
Operating cash flow reached an all-time high of €991 million (2015: €913 million). The cash flow margin increased to 16.5% (2015: 15.3%). In Q4/2016, operating cash flow increased by 6% to €345 million (Q4/2015: €324 million) driven by excellent operating results, lower sequential inventory and a reduction of the Days Sales Outstanding (DSO). The margin reached an outstanding 22.3% (Q4/2015: 21.3%).
For 2017, Fresenius Kabi expects organic sales growth of 5% to 7%3 and EBIT growth in constant currency of 5% to 7%3.
1 2015 before special items2 Net income attributable to shareholders of Fresenius Kabi AG; 2015 before special items3 Guidance according to IFRS; for a detailed overview of 2016 IFRS figures please see p. 15 of the pdf fileFor a detailed overview of special items please see the reconciliation tables on pages 17-18 of the pdf file
Fresenius Helios
Fresenius Helios is Europe’s largest private hospital operator. In Germany, HELIOS operates 112 hospitals, thereof 88 acute care clinics (including seven maximum care hospitals in Berlin-Buch, Duisburg, Erfurt, Krefeld, Schwerin, Wiesbaden and Wuppertal) and 24 post-acute care clinics. Through Quirónsalud, Fresenius Helios operates 43 hospitals, 39 outpatient centers and around 300 Occupational Risk Prevention (ORP) centers in Spain.

- 4% organic sales growth, €682 million EBIT1
- Acquisition of Quirónsalud closed as of January 31, 2017
- 2017 outlook3: 3% to 5%4 organic sales growth, sales of ~€8.6 bn (thereof Quirónsalud €2.5 bn5) and EBIT of €1,020 to €1,070 million (thereof Quirónsalud €300 to €320 million5,6) expected
Sales increased by 5% to €5,843 million (2015: €5,578 million). Organic sales growth was 4%. Acquisitions contributed 1%. In Q4/2016, sales increased by 4% to €1,461 million (Q4/2015: €1,411 million), organic sales growth was 2%.
EBIT1 grew by 7% to €682 million (2015: €640 million). The EBIT margin1 increased to 11.7% (2015: 11.5%). In Q4/2016, EBIT1 increased by 4% to €175 million (Q4/2015: €168 million) with a margin1 of 12.0% (Q4/2015: 11.9%).
Net income2 increased by 12% to €543 million (2015: €483 million). In Q4/2016, net income2 increased by 8% to €141 million (Q4/2015: €131 million).
Operating cash flow increased by 1% to €622 million (2015: €618 million) with a margin of 10.6% (2015: 11.1%). In Q4/2016, operating cash flow reached a strong €185 million, but could not match the exceptional prior-year quarter (Q4/2015: €232 million). The same applies to the cash flow margin of 12.7% (Q4/2015: 16.4%).
For 2017, Fresenius Helios expects organic sales growth of 3% to 5%3,4 and sales of ~€8.6 bn3 (thereof Quirónsalud ~€2.5 bn5). EBIT is expected to increase to €1,020 to €1,070 million3 (thereof Quirónsalud €300 to €320 million5,6).
1 2015 before special items2 Net income attributable to shareholders of HELIOS Kliniken GmbH; before special items3 Guidance according to IFRS; for a detailed overview of 2016 IFRS figures please see p. 15 of the pdf file4 Helios Kliniken Germany, excluding Quirónsalud5 Quirónsalud consolidated for 11 months6 EBITDA of €480 to €500 million, Amortization of €80 million and depreciation of €100 million
For a detailed overview of special items please see the reconciliation tables on pages 17-18 of the pdf file.
Fresenius Vamed
Fresenius Vamed manages projects and provides services for hospitals and other health care facilities worldwide. The portfolio ranges along the entire value chain: from project development, planning, and turnkey construction, via maintenance and technical management, to total operational management.

- 5% organic sales growth, 8% EBIT growth
- Order intake of €1,017 million at all-time high
- 2017 outlook1: 5% to 10% organic sales growth and 5% to 10% EBIT growth expected
Sales increased by 4% (4% in constant currency) to €1,160 million (2015: €1,118 million). Organic sales growth was 5%. Sales in the project business increased by 3% to €594 million (2015: €575 million). Sales in the service business grew by 4% to €566 million (2015: €543 million). In Q4/2016, sales increased to €420 million (Q4/2015: €387 million). Organic sales growth was 10%.
EBIT grew by 8% to €69 million (2015: €64 million). The EBIT margin increased to 5.9% (2015: 5.7%). In Q4/2016, EBIT increased by 12% to €38 million (Q4/2015: €34 million). The EBIT margin increased to 9.0%.
Net income2 grew by 2% to €45 million (2015: €44 million). In Q4/2016, net income2 remained unchanged at €24 million (Q4/2015: €24 million).
Order intake increased to €1,017 million (2015: €904 million), reaching an all-time high. As of December 31, 2016, order backlog was €1,961 million (Dec. 31, 2015: €1,650 million).
For 2017, Fresenius Vamed expects organic sales growth in the range of 5% to 10%1 and EBIT growth of 5% to 10%1.
1 Guidance according to IFRS; for a detailed overview of 2016 IFRS figures please see p. 15 of the pdf file2 Net income attributable to shareholders of VAMED AG
Conference Call
As part of the publication of the results for fiscal year 2016, a conference call will be held on February 22, 2017 at 2 p.m. CET (8 a.m. EST). All investors are cordially invited to follow the conference call in a live broadcast over the Internet at www.fresenius.com/investors. Following the call, a replay will be available on our website.
This release contains forward-looking statements that are subject to various risks and uncertainties. Future results could differ materially from those described in these forward-looking statements due to certain factors, e.g. changes in business, economic and competitive conditions, regulatory reforms, results of clinical trials, foreign exchange rate fluctuations, uncertainties in litigation or investigative proceedings, and the availability of financing. Fresenius does not undertake any responsibility to update the forward-looking statements in this release.
Fresenius SE & Co. KGaA (“Fresenius”) will focus its reporting on financial statements in accordance with International Financial Reporting Standards (IFRS) starting with the 2017 fiscal year on January 1, 2017. The company will then no longer provide U.S. GAAP financial information.
Fresenius, as a publicly traded company based in a European Union member country, is required to prepare and publish its consolidated financial statements in accordance with International Financial Reporting Standards (IFRS) pursuant to Section 315a of the German Commercial Code (HGB).
In addition to this compulsory IFRS accounting, Fresenius also publishes consolidated financial statements in accordance with U.S. GAAP. This has provided comparability with the Group’s largest subsidiary, Fresenius Medical Care, which was required to report in accordance with U.S. GAAP under a so-called Pooling Agreement. However, Fresenius Medical Care’s 2016 Annual General Meeting has lifted this obligation.
In the interest of harmonizing the management and accounting of the Fresenius Group and all of its business segments, the Fresenius Group and all of its business segments will report solely in accordance with IFRS starting with the 2017 fiscal year on January 1, 2017.
For the 2016 fiscal year, Fresenius will as in past years provide both U.S. GAAP and IFRS consolidated financial statements.
No significant differences between IFRS and U.S. GAAP financial statements
Past reporting showed only limited differences between the consolidated U.S. GAAP and IFRS accounts of Fresenius SE & Co. KGaA. Historic IFRS figures for the Fresenius Group and its individual business segments are provided on our Investor Relations website.
No effect on the ADR program
The discontinuation of U.S. GAAP reporting will not affect the sponsored Level 1 American Depositary Receipt (ADR) program of Fresenius SE & Co. KGaA in the United States. The ADRs will continue to trade under the FSNUY ticker on the over-the-counter OTCQX International Premier market.
This release contains forward-looking statements that are subject to various risks and uncertainties. Future results could differ materially from those described in these forward-looking statements due to certain factors, e.g. changes in business, economic and competitive conditions, regulatory reforms, results of clinical trials, foreign exchange rate fluctuations, uncertainties in litigation or investigative proceedings, and the availability of financing. Fresenius does not undertake any responsibility to update the forward-looking statements in this release.
If no timeframe is specified, information refers to Q1-3/2016
Q1-3/2016:
- Sales: €21.3 billion (+5%, +6% in constant currency)
- EBIT1: €3,092 million (+9%, +9% in constant currency)
- Net income1,2: €1,154 million (+14%, +15% in constant currency)
Q3/2016:
- Sales: €7.3 billion (+6%, +7% in constant currency)
- EBIT1: €1,082 million (+5%, +6% in constant currency)
- Net income1,2: €399 million (+9%, +10% in constant currency)
Stephan Sturm, CEO of Fresenius, said: “We achieved substantial earnings growth in the third quarter, following our very strong development in the first half. Each business segment continued to grow organically in every region. That makes us even more confident for the full year 2016. We are also full of optimism about our medium-term prospects. The acquisition of the Spanish hospital group Quirónsalud will further broaden our foundation for continued strong growth. This will be reflected in the ambitious targets for the coming years that we will announce with our forecast for 2017.”
1 2015 before special items2 Net income attributable to shareholders of Fresenius SE & Co. KGaAFor a detailed overview of special items please see the reconciliation tables on pages 15-16 of the pdf file.
Lower end of 2016 Group earnings guidance raised
Based on the Group’s excellent financial results and strong prospects for the remainder of the year, Fresenius raises the lower end of its 2016 Group earnings guidance range. The upper end of the Group’s earnings guidance remains unchanged, due to the offsetting effect of financing costs related to the Quirónsalud acquisition. Net income1,2 , is now expected to grow by 12% to 14% in constant currency. Previously, Fresenius expected net income1,2 growth of 11% to 14% in constant currency. The company confirms its Group sales guidance. Sales are expected to increase by 6% to 8% in constant currency.
The net debt/EBITDA3 ratio is expected to be approximately 2.5 at the end of 2016.
1Net income attributable to shareholders of Fresenius SE & Co. KGaA22015 before special items3Calculated at FY average exchange rates for both net debt and EBITDA; excluding potential acquisitionsFor a detailed overview of special items please see the reconciliation tables on pages 15-16 of the pdf file.
6% sales growth in constant currency
Group sales increased by 5% (6% in constant currency) to €21,345 million (Q1-3/2015: €20,369 million). Organic sales growth was 6%. The minor negative currency translation effects (-1%) were mainly related to the devaluation of Latin American currencies against the Euro. Acquisitions contributed 1% and divestitures reduced sales by 1%. In Q3/2016, Group sales increased by 6% (7% in constant currency) to €7,339 million (Q3/2015: €6,940 million). Organic sales growth was 6%. Acquisitions contributed 1%.
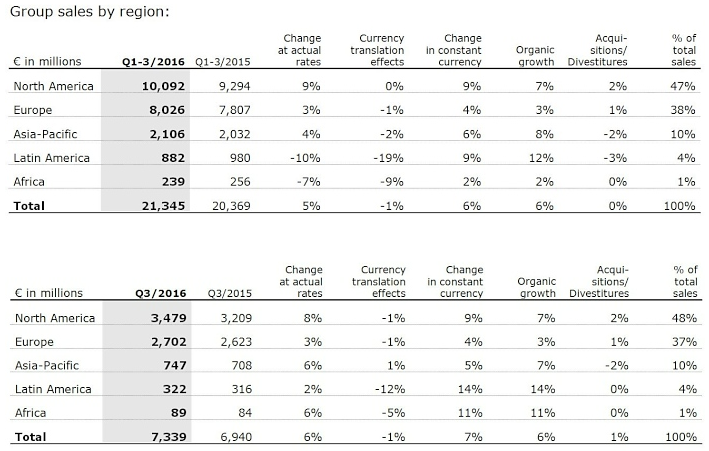
15% net income1,2 growth in constant currency
Group EBITDA2 increased by 7% (8% in constant currency) to €3,949 million (Q1-3/2015: €3,674 million). Group EBIT2 increased by 9% (9% in constant currency) to €3,092 million (Q1-3/2015: €2,849 million). The EBIT margin2 increased to 14.5% (Q1-3/2015: 14.0%). In Q3/2016, Group EBIT2 increased by 5% (6% in constant currency) to €1,082 million (Q3/2015: €1,027 million), the EBIT margin2 was 14.7% (Q3/2015: 14.8%).
Group net interest decreased to -€433 million (Q1-3/2015: -€476 million), mainly due to more favorable financing terms and lower net debt.
With 28.1%, the Group tax rate2 was below the previous year (Q1 3/2015: 29.6%). The decrease is mainly due to released tax accruals at Fresenius Medical Care in Q3/2016. In Q3/2016, the Group tax rate was 27.1% (Q3/2015: 29.7%).
Noncontrolling interest increased to €759 million (Q1-3/2015: €661 million), of which 96% was attributable to the noncontrolling interest in Fresenius Medical Care.
Group net income1,2 , increased by 14% (15% in constant currency) to €1,154 million (Q1-3/2015: €1,009 million). Earnings per share1,2 increased by 13% (15% in constant currency) to €2.11 (Q1-3/2015: €1.86). In Q3/2016, Group net income1,2 increased by 9% (10% in constant currency) to €399 million (Q3/2015: €367 million). Earnings per share1,2 increased by 7% (9% in constant currency) to €0.73 (Q3/2015: €0.68).
1Net income attributable to shareholders of Fresenius SE & Co. KGaA22015 before special items
For a detailed overview of special items please see the reconciliation tables on pages 15-16 of the pdf file.
Continued investment in growth
Spending on property, plant and equipment was €1,044 million (Q1-3/2015: €950 million), primarily for the modernization and expansion of dialysis clinics, production facilities and hospitals.
Total acquisition spending was €592 million (Q1-3/2015: €272 million), including the acquisition of dialysis clinics and further expansion in the field of care coordination at Fresenius Medical Care, the acquisition of a U.S. pharmaceutical plant for ready-to-administer prefilled syringes at Fresenius Kabi and the acquisition of the municipal hospital Niederberg at Fresenius Helios.
Strong operating cash flow
Operating cash flow increased by 5% to €2,259 million (Q1-3/2015: €2,151 million) with a margin of 10.6% (Q1-3/2015: 10.6%). With €929 million, operating cash flow in Q3/2016 was slightly above the level of the strong prior-year quarter (Q3/2015: €900 million), despite of a US$100 million discretionary cash contribution of Fresenius Medical Care to its pension plan assets in the United States. The cash flow margin was 12.7% (Q3/2015: 13.0%).
Free cash flow before acquisitions and dividends decreased slightly to €1,207 million (Q1-3/2015: €1,219 million). Free cash flow after acquisitions and dividends was €253 million (Q1-3/2015: €574 million).
Solid balance sheet structure
The Group’s total assets increased by 3% (4% in constant currency) to €44,075 million (Dec. 31, 2015: €42,959 million), driven by its growing scale of operations. Current assets grew by 6% (7% in constant currency) to €11,135 million (Dec. 31, 2015: €10,479 million). Non-current assets increased by 1% (3% in constant currency) to €32,940 million (Dec. 31, 2015: € 32,480 million).
Total shareholders’ equity grew by 6% (7% in constant currency) to €19,086 million (Dec. 31, 2015: €18,003 million). The equity ratio increased to 43.3% (Dec. 31, 2015: 41.9%).
Group debt decreased by 2% (1% in constant currency) to €14,530 million (Dec. 31, 2015: € 14,769 million). As of September 30, 2016, the net debt/EBITDA ratio was 2.501,2, (Dec. 31, 2015: 2.681).
Increased number of employees
As of September 30, 2016, the number of employees increased by 4% to 231,432 (Dec. 31, 2015: 222,305).
12015 before special items; at LTM average exchange rates for both net debt and EBITDA2Pro forma acquisitions
For a detailed overview of special items please see the reconciliation tables on pages 15-16 of the pdf file.
Business Segments
Fresenius Medical Care
Fresenius Medical Care is the world's largest provider of products and services for individuals with chronic kidney failure. As of September 30, 2016, Fresenius Medical Care was treating 306,366 patients in 3,579 dialysis clinics. Along with its core business, the company seeks to expand the range of medical services in the field of care coordination.
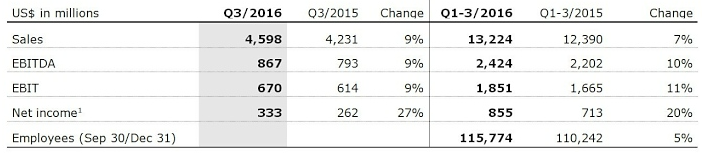


- 9% sales growth in constant currency in Q3
- 27% net income growth in Q3 (17% before one-time items1)
- 2016 outlook confirmed
1Net income attributable to shareholders of Fresenius Medical Care AG & Co. KGaA22015 before divestiture of dialysis business in Venezuela (-US$27 million after tax) and European pharmaceutical business (US$5 million after tax)
Sales increased by 7% (8% in constant currency) to US$13,224 million (Q1-3/2015: US$12,390 million). Organic sales growth was 7%. Acquisitions contributed 1%. In Q3/2016, sales increased by 9% (9% in constant currency) to US$4,598 million (Q3/2015: US$4,231 million). Organic sales growth was 7%.
Health Care services sales (dialysis services and care coordination) increased by 8% (9% in constant currency) to US$10,720 million (Q1-3/2015: US$9,929 million). Dialysis product sales increased by 2% (4% in constant currency) to US$2,504 million (Q1-3/2015: US$2,461 million).
In North America, sales increased by 9% to US$9,512 million (Q1-3/2015: US$8,730 million). Health Care services sales grew by 9% to US$8,838 million (Q1-3/2015: US$8,087 million). Dialysis product sales increased by 5% to US$674 million (Q1-3/2015: US$642 million).
Sales outside North America increased by 2% (7% in constant currency) to US$3,700 million (Q1-3/2015: US$3,639 million). Health Care services sales increased by 2% (9% in constant currency) to US$1,882 million (Q1-3/2015: US$1,842 million). Dialysis product sales remained nearly unchanged at (increased by 5% in constant currency to) US$1,819 million (Q1-3/2015: US$1,797 million).
EBIT increased by 11% (12% in constant currency) to US$1,851 million (Q1-3/2015: US$1,665 million). The EBIT margin was 14.0% (Q1-3/2015: 13.4%). EBIT before one-time items1 increased by 10%. In Q3/2016, EBIT increased by 9% (10% in constant currency) to US$670 million (Q3/2015: US$614 million). The EBIT margin was 14.6% (Q3/2015: 14.5%). EBIT before one-time items1 increased by 6%.
Net income2 increased by 20% (20% in constant currency) to US$855 million (Q1-3/2015: US$713 million). Net income before one-time items2,3, increased by 16%. In Q3/2016, net income2 grew by 27% (28% in constant currency) to US$333 million (Q3/2015: US$262 million). Net income before one-time items2,3 increased by 17%.
Operating cash flow decreased by 8% to US$1,296 million (Q1-3/2015: US$1,412 million). The cash flow margin was 9.8% (Q1-3/2015: 11.4%). The decrease is mainly attributable to a discretionary cash contribution of US$100 million to Fresenius Medical Care’s pension plan assets in the United States. As a consequence, in Q3/2016, operating cash flow decreased to US$439 million (Q3/2015: US$579 million) with a cash flow margin of 9.5% (Q3/2015: 13.7%).
Fresenius Medical Care confirms its outlook for 2016. The company expects sales to grow by 7% to 10% in constant currency. Net income1 is expected to increase by 15% to 20%4 .
For further information, please see Fresenius Medical Care’s Investor News at www.freseniusmedicalcare.com.
1 2015 before divestiture of dialysis business in Venezuela (-US$26 million before tax) and European pharmaceutical business (US$8 million before tax)
2 Net income attributable to shareholders of Fresenius Medical Care AG & Co. KGaA
3 2015 before divestiture of dialysis business in Venezuela (-US$27 million after tax) and European pharmaceutical business (US$5 million after tax)
4 2015 before GranuFlo®/NaturaLyte® settlement costs (-US$37 million after tax) and before acquisitions (US$9 million after tax); hence the basis for expected net income growth is US$1,057 million.
Fresenius Kabi
Fresenius Kabi offers intravenously administered generic drugs, clinical nutrition and infusion therapies for seriously and chronically ill patients in the hospital and outpatient environments. The company is also a leading supplier of medical devices and transfusion technology products.
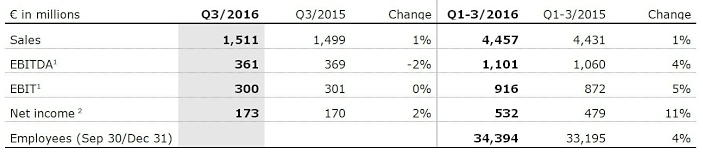


- 5% organic sales growth in Q3
- 1% constant currency EBIT1 growth in Q3
- 2016 outlook raised: both, organic sales growth and EBIT1 growth in constant currency of 4% to 6% expected
Sales increased by 4% in constant currency to €4,457 million (Q1-3/2015: €4,431 million). Organic sales growth was 6%. The divestment of the Australian and German oncology compounding business reduced sales by 2%. In Q3/2016, sales increased by 1% (by 3% in constant currency) to €1,511 million (Q3/2015: €1,499 million). Negative currency translation effects (-2%) were mainly related to the devaluation of the Chinese yuan and the Argentine peso against the Euro. Organic sales growth was 5%.Sales in Europe remained nearly unchanged at €1,569 million (Q1-3/2015: €1,566 million). Organic sales growth was 2%. Divestitures reduced sales by 2%. In Q3/2016, sales of €521 million were slightly above prior-year level (Q3/2015: €514 million). Organic sales growth was 3%.
Sales in North America increased by 5% (organic growth: 5%) to €1,628 million (Q1-3/2015: €1,555 million), mainly driven by new product launches. In Q3/2016, sales increased by 2% (organic growth: 2%) to €542 million (Q3/2015: €529 million).
Sales in Asia-Pacific decreased by 5% (organic growth: 8%) to €821 million (Q1-3/2015: €862 million). Adverse currency translation effects reduced sales by 5%, divestitures by another 8%. In Q3/2016, sales decreased by 3% (organic growth: 9%) to €290 million (Q3/2015: €298 million).
Given adverse currency translation effects, sales in Latin America/Africa decreased by 2% (organic growth: 16%, in particular due to inflation driven price increases) to €439 million (Q1-3/2015: €448 million). In Q3/2016, sales remained unchanged at €158 million (Q3/2015: €158 million). Organic sales growth was 7%.
EBIT1 increased by 5% (7% in constant currency) to €916 million (Q1-3/2015: €872 million). The EBIT margin1 improved to 20.6% (Q1-3/2015: 19.7%). In Q3/2016, EBIT1 remained virtually unchanged at €300 million (Q3/2015: €301 million). EBIT1 increased by 1% in constant currency. The EBIT margin1 was 19.9% (Q3/2015: 20.1%).
Net income2 increased by 11% (12% in constant currency) to €532 million (Q1-3/2015: €479 million). In Q3/2016, net income2 increased by 2% (3% in constant currency) to €173 million (Q3/2015: €170 million).
Operating cash flow increased by 10% to €646 million (Q1-3/2015: €589 million) with a margin of 14.5% (Q1-3/2015: 13.3%). In Q3/2016, operating cash flow increased by 32% to €311 million (Q3/2015: €235 million), due to a catch-up from Q2/2016 and temporarily reduced net working capital requirements. The cash flow margin increased to 20.6% (Q3/2015: 15.7%).
Fresenius Kabi raises its outlook for 2016 and now expects both organic sales growth and EBIT1 growth in constant currency of 4% to 6%. Previously, Fresenius Kabi had projected 3% to 5% for both metrics.
12015 before special items2Net income attributable to shareholders of Fresenius Kabi AG; 2015 before special itemsFor a detailed overview of special items please see the reconciliation tables on pages 15-16 of the .pdf file.
Fresenius Helios
Fresenius Helios is Germany’s largest hospital operator. HELIOS operates 112 hospitals, thereof 88 acute care clinics (including seven maximum care hospitals in Berlin-Buch, Duisburg, Erfurt, Krefeld, Schwerin, Wiesbaden and Wuppertal) and 24 post-acute care clinics. HELIOS treats more than 4.7 million patients per year, thereof approximately 1.3 million inpatients, and operates approximately 35,000 beds.
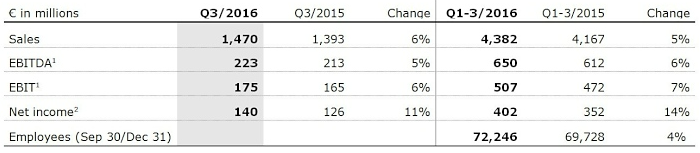


- 4% organic sales growth in Q3
- 20 bps sequential EBIT margin increase
- 2016 outlook confirmed
Sales increased by 5% to €4,382 million (Q1-3/2015: €4,167 million). Organic sales growth was 4%. Acquisitions increased sales by 1%. In Q3/2016, sales increased by 6% to €1,470 million (Q3/2015: €1,393 million). Organic sales growth was 4%.
EBIT1 grew by 7% to €507 million (Q1-3/2015: €472 million). The EBIT margin1 increased to 11.6% (Q1-3/2015: 11.3%). In Q3/2016, EBIT1 increased by 6% to €175 million (Q3/2015: €165 million). Sequentially, the EBIT margin increased by 20 bps to 11.9%.
Net income2 increased by 14% to €402 million (Q1-3/2015: €352 million). In Q3/2016, net income2 increased by 11% to €140 million (Q3/2015: €126 million).
Operating cash flow increased by 13% to €437 million (Q1-3/2015: €386 million) with a margin of 10.0% (Q1-3/2015: 9.3%). In Q3/2016 operating cash flow increased by 34% to €207 million (Q3/2015: €155 million), mainly driven by decreased working capital. The cash flow margin increased to 14.1% (Q3/2015: 11.1%).
Fresenius Helios confirms its outlook for 2016 and projects organic sales growth of 3% to 5%. EBIT is expected to increase to €670 to €700 million.
Fresenius Helios expects the acquisition of Quirónsalud to close in Q1/2017.
12015 before special items2Net income attributable to shareholders of HELIOS Kliniken GmbH; 2015 before special items
For a detailed overview of special items please see the reconciliation tables on pages 15-16 of the pdf file.
Fresenius Vamed
Fresenius Vamed manages projects and provides services for hospitals and other health care facilities worldwide. The portfolio ranges along the entire value chain: from project development, planning, and turnkey construction, via maintenance and technical management, to total operational management.
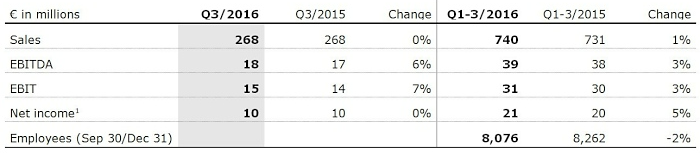


- Strong order intake of €209 million in Q3
- 2016 outlook confirmed
Sales increased by 1% (1% in constant currency) to €740 million (Q1-3/2015: €731 million). Organic sales growth was 2%. Sales in the project business decreased by 2% to €325 million (Q1-3/2015: €333 million). Sales in the service business grew by 4% to €415 million (Q1-3/2015: €398 million). In Q3/2016, sales remained unchanged at €268 million (Q3/2015: €268 million). Organic sales growth was 1%.
EBIT increased by 3% to €31 million (Q1-3/2015: €30 million). The EBIT margin increased to 4.2% (Q1-3/2015: 4.1%). In Q3/2016, EBIT increased by 7% to €15 million (Q3/2015: €14 million). The EBIT margin increased to 5.6% (Q3/2015: 5.2%).
Net income1 grew by 5% to €21 million (Q1-3/2015: €20 million). In Q3/2016, net income1 of €10 million was at prior-year level (Q3/2015: €10 million).
Order intake increased by 42% to €674 million (Q1-3/2015: €476 million). In Q3/2016, order intake increased by 9% to €209 million (Q3/2015: €192 million). As of September 30, 2016, order backlog grew to €1,995 million (December 31, 2015: €1,650 million).
Fresenius Vamed confirms its outlook for 2016 and expects organic sales growth in the range of 5% to 10% and EBIT growth of 5% to 10%.
1Net income attributable to shareholders of VAMED AG
Conference Call
As part of the publication of the results for the first nine months of 2016, a conference call will be held on October 27, 2016 at 2 p.m. CEDT (8 a.m. EDT). All investors are cordially invited to follow the conference call in a live broadcast over the Internet at www.fresenius.com/media. Following the call, a replay will be available on our website.
This release contains forward-looking statements that are subject to various risks and uncertainties. Future results could differ materially from those described in these forward-looking statements due to certain factors, e.g. changes in business, economic and competitive conditions, regulatory reforms, results of clinical trials, foreign exchange rate fluctuations, uncertainties in litigation or investigative proceedings, and the availability of financing. Fresenius does not undertake any responsibility to update the forward-looking statements in this release.
If no timeframe is specified, information refers to H1/2016
Q2/2016:
- Sales: €7.1 billion (+2%, +5% in constant currency)
- EBIT1: €1,051 million (+8%, +11% in constant currency)
- Net income1,2: €393 million (+12%, +15% in constant currency)
H1/2016:
- Sales: €14.0 billion (+4%, +6% in constant currency)
- EBIT1: €2,010 million (+10%, +11% in constant currency)
- Net income1,2: €755 million (+18%, +18% in constant currency)
12015 before special items2Net income attributable to shareholders of Fresenius SE & Co. KGaA
For a detailed overview of special items please see the reconciliation tables on pages 13-14 of the pdf file.
Stephan Sturm, CEO of Fresenius, said: “Once again, all four business segments contributed to strong organic growth. This confirms Fresenius’ sound strategic position as a healthcare Group. We have continued to grow even in regions where economies have slowed. This confirms the stability of our markets and businesses. Even compared with an excellent prior-year quarter, Fresenius has again achieved double-digit earnings growth. This confirms that we are providing the right products and services to patients worldwide. Fresenius has now delivered the 50th consecutive quarter of earnings growth. We continue to look forward with great confidence, and are raising our 2016 earnings guidance.”
2016 Group earnings guidance raised
Based on the Group’s excellent financial results in the first half of 2016 and strong prospects for the remainder of the year, Fresenius raises its 2016 Group earnings guidance. Net income1,2 is now expected to grow by 11% to 14% in constant currency. Previously, Fresenius expected net income1,2 growth of 8% to 12% in constant currency. The company confirms its Group sales guidance. Sales are expected to increase by 6% to 8% in constant currency.
The net debt/EBITDA3 ratio is expected to be approximately 2.5 at the end of 2016.
1Net income attributable to shareholders of Fresenius SE & Co. KGaA22015 before special items3Calculated at FY average exchange rates for both net debt and EBITDA; excluding potential acquisitions
For a detailed overview of special items please see the reconciliation tables on page 13-14 of the pdf file.
6% sales growth in constant currency
Group sales increased by 4% (6% in constant currency) to €14,006 million (H1/2015: €13,429 million). Organic sales growth was 6%. Acquisitions contributed 1% and divestitures reduced sales by 1%. Negative currency translation effects (-2%) were mainly driven by the devaluation of Latin American currencies against the Euro. In Q2/2016, Group sales increased by 2% (5% in constant currency) to €7,092 million (Q2/2015: €6,946 million). Organic sales growth was 5%. Acquisitions contributed 1%, while divestitures reduced sales by 1%.
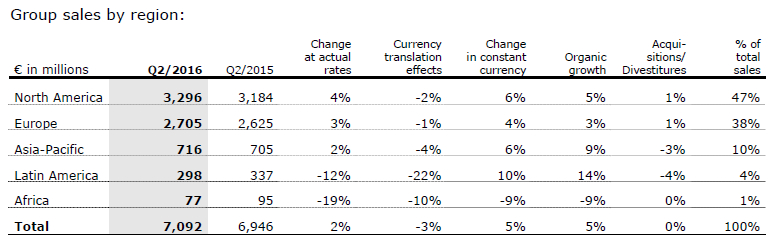
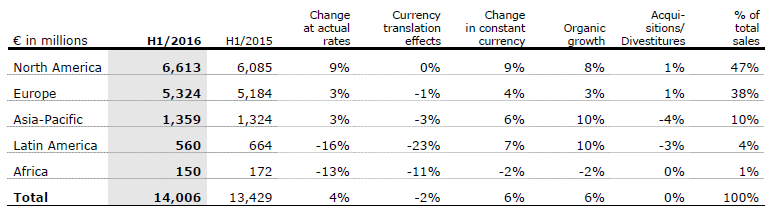


18% net income1,2 growth in constant currency
Group EBITDA2 increased by 9% (10% in constant currency) to €2,576 million (H1/2015: €2,364 million). Group EBIT2 increased by 10% (11% in constant currency) to €2,010 million (H1/2015: €1,822 million). The EBIT margin2 increased to 14.4% (H1/2015: 13.6%). In Q2/2016, Group EBIT2 increased by 8% (11% in constant currency) to €1,051 million (Q2/2015: €971 million), the EBIT margin was 14.8% (Q2/2015: 14.0%).
Group net interest decreased to -€291 million (H1/2015: -€330 million), mainly due to more favorable financing terms and lower net debt.
With 28.6%, the Group tax rate (before special items) was on Q1/2016 level (28.4%) and hence in line with expectations. In Q2/2016, the Group tax rate was 28.7% (Q2/2015: 29.0%).
Noncontrolling interest increased to €473 million (H1/2015: €409 million), of which 96% was attributable to the noncontrolling interest in Fresenius Medical Care.
Group net income , increased by 18% (18% in constant currency) to €755 million (H1/2015: €642 million). Earnings per share1,2 increased by 17% (18% in constant currency) to €1.38 (H1/2015: €1.18). In Q2/2016, Group net income1,2 increased by 12% (15% in constant currency) to €393 million (Q2/2015: €350 million). Earnings per share1,2 increased by 12% (14% in constant currency) to €0.72 (Q2/2015: €0.64).
Continued investment in growth
Spending on property, plant and equipment was €670 million (H1/2015: €611 million), primarily for the modernization and expansion of dialysis clinics, production facilities and hospitals. Total acquisition spending was €505 million (H1/2015: €194 million).
Cash flow development
Operating cash flow increased by 6% to €1,330 million (H1/2015: €1,251 million) with a margin of 9.5% (H1/2015: 9.3%). Operating cash flow in Q2/2016 increased to €996 million (Q2/2015: €720 million). The cash flow margin increased to 14.0% (Q2/2015: 10.4%). As expected, the operating cashflow of Fresenius Medical Care improved considerably in Q2/2016.
Free cash flow before acquisitions and dividends increased slightly to €650 million (H1/2015: €646 million). Free cash flow after acquisitions and dividends was -€206 million (H1/2015: €107 million).
Solid balance sheet structure
The Group’s total assets increased by 2% (3% in constant currency) to €43,821 million (Dec. 31, 2015: €42,959 million). The increase is mainly driven by business expansion. Current assets grew by 5% (6% in constant currency) to €11,000 million (Dec. 31, 2015: €10,479 million). Non-current assets increased by 1% (2% in constant currency) to €32,821 million (Dec. 31, 2015: € 32,480 million).
Total shareholders’ equity grew by 3% (also 3% in constant currency) to €18,458 million (Dec. 31, 2015: €18,003 million). The equity ratio increased to 42.1% (Dec. 31, 2015: 41.9%).
Group debt increased by 1% (2% in constant currency) to €14,960 million (Dec. 31, 2015: € 14,769 million). As of June 30, 2016, the net debt/EBITDA ratio was 2.62 , (Dec. 31, 2015: 2.681).
12015 before special items; at LTM average exchange rates for both net debt and EBITDA2Pro forma acquisitionsFor a detailed overview of special items please see the reconciliation tables on page 13-14 of the pdf file.
Business Segments
Fresenius Medical Care
Fresenius Medical Care is the world's largest provider of products and services for individuals with renal diseases. As of June 30, 2016, Fresenius Medical Care was treating 301,548 patients in 3,504 dialysis clinics. Along with its core business, the company seeks to expand the range of medical services in the field of care coordination.
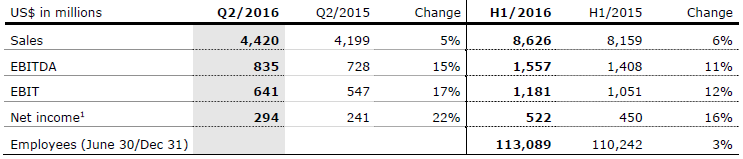


- 7% sales growth in constant currency in Q2
- 22% net income growth in Q2
- 2016 outlook confirmed
Sales increased by 6% (8% in constant currency) to US$8,626 million (H1/2015: US$8,159 million). Organic sales growth was 7%. Acquisitions contributed 1%. Currency translation effects reduced sales by 2%. In Q2/2016, sales increased by 5% (7% in constant currency) to US$4,420 million (Q2/2015: US$4,199 million). Organic sales growth was 6%.
Health Care services sales (dialysis services and care coordination) increased by 7% (9% in constant currency) to US$6,985 million (H1/2015: US$6,527 million). Dialysis product sales increased by 1% (4% in constant currency) to US$1,640 million (H1/2015: US$1,631 million).
In North America, sales increased by 9% to US$6,212 million (H1/2015: US$5,717 million). Health Care services sales grew by 9% to US$5,770 million (H1/2015: US$5,293 million). Dialysis product sales increased by 4% to US$441 million (H1/2015: US$424 million).
Sales outside North America decreased by 1% (increased by 6% in constant currency) to US$2,406 million (H1/2015: US$2,427 million). Health Care services sales decreased by 2% (increased by 7% in constant currency) to US$1,215 million (H1/2015: US$1,234 million). Dialysis product sales remained nearly unchanged at (increased by 5% in constant currency to) US$1,191 million (H1/2015: US$1,193 million).
1Net income attributable to shareholders of Fresenius Medical Care AG & Co. KGaA
EBIT increased by 12% (13% in constant currency) to US$1,181 million (H1/2015: US$1,051 million). The EBIT margin was 13.7% (H1/2015: 12.9%). In Q2/2016, EBIT increased by 17% (17% in constant currency) to US$641 million (Q2/2015: US$547 million). The EBIT margin was 14.5% (Q2/2015: 13.0%).
Net income increased by 16% (16% in constant currency) to US$522 million (H1/2015: US$450 million). In Q2/2016, net income grew by 22% (22% in constant currency) to US$294 million (Q2/2015: US$241 million).
Operating cash flow increased by 3% to US$857 million (H1/2015: US$832 million). The cash flow margin was 9.9% (H1/2015: 10.2%). In Q2/2016, operating cash flow increased to US$678 million (Q2/2015: US$385 million) with a cash flow margin of 15.3% (Q2/2015: 9.2%). The sequential improvement is mainly driven by the anticipated catch-up effect after the adjustment in invoicing in Q1/2016.
Fresenius Medical Care confirms its outlook for 2016. The company expects sales to grow by 7% to 10% in constant currency and net income1 is expected to increase by 15% to 20% in 2016.
1Net income attributable to shareholders of Fresenius Medical Care AG & Co. KGaA
22015 before GranuFlo®/NaturaLyte® settlement costs (-US$37 million after tax) and before acquisitions (US$9 million after tax); hence the basis for expected net income growth is US$1,057 million.
For further information, please see Fresenius Medical Care’s Press Release at www.freseniusmedicalcare.com.
Fresenius Kabi
Fresenius Kabi offers intravenously administered generic drugs, clinical nutrition and infusion therapies for seriously and chronically ill patients in the hospital and outpatient environments. The company is also a leading supplier of medical devices and transfusion technology products.
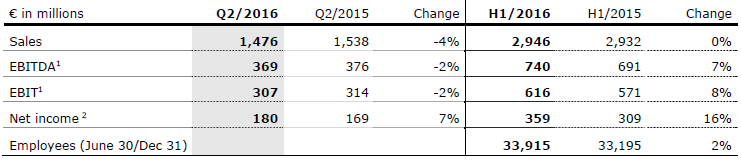


- 3% organic sales growth in Q2
- 1% constant currency EBIT1 growth in Q2
- 2016 outlook raised: both, organic sales growth and EBIT1 growth in constant currency of 3% to 5% expected
Sales increased slightly (by 4% in constant currency) to €2,946 million (H1/2015: €2,932 million). Organic sales growth was 6%. Divestitures reduced sales by 2%. In Q2/2016, sales decreased by 4% (increased by 1% in constant currency) to €1,476 million (Q2/2015: €1,538 million). Negative currency translation effects (-5%) were mainly driven by the devaluation of the Chinese yuan, the U.S. dollar and the Argentine peso against the Euro. Organic sales growth was 3%.
Sales in Europe remained nearly unchanged at €1,048 million (H1/2015: €1,052 million). Organic sales growth was 2%. Divestitures reduced sales by 1%. Also in Q2/2016, sales were almost unchanged at €536 million (Q2/2015: €534 million). Organic sales growth was 2%.
Sales in North America increased by 6% (organic growth: 6%) to €1,086 million (H1/2015: €1,026 million), driven by persisting drug shortages as well as new product launches in Q1/2016. In Q2/2016, sales decreased by 8% (organic: 6%) to €510 million (Q2/2015: €553 million), mainly due to the high prior-year basis driven by significant new product launches.
12015 before special items2Net income attributable to shareholders of Fresenius Kabi AG; 2015 before special items
For a detailed overview of special items please see the reconciliation tables on page 13-14.
Sales in Asia-Pacific decreased by 6% (organic growth: 7%) to €531 million (H1/2015: €564 million). Adverse currency translation effects reduced sales by 5%, divestitures by another 8%. In Q2/2016, sales decreased by 6% (organic growth: 8%) to €277 million (Q2/2015: €296 million).
Given adverse currency translation effects, sales in Latin America/Africa decreased by 3% (organic growth: 21%, in particular due to inflation driven price increases) to €281 million (H1/2015: €290 million). In Q2/2016, sales decreased by 1% (organic growth 22%) to €153 million (Q2/2015: €155 million).
EBIT2 increased by 8% (10% in constant currency) to €616 million (H1/2015: €571 million). The EBIT margin2 improved to 20.9% (H1/2015: 19.5%). In Q2/2016, EBIT2 decreased by 2% (increased by 1% in constant currency) to €307 million (Q2/2015: €314 million). The EBIT margin2 increased to 20.8% (Q2/2015: 20.4%).
Net income1 increased by 16% (37% in constant currency) to €359 million (H1/2015: €309 million). In Q2/2016, net income1 increased by 7% (30% in constant currency) to €180 million (Q2/2015: €169 million).
Given adverse currency translation effects, operating cash flow decreased by 5% to €335 million (H1/2015: €354 million) with a margin of 11.4% (H1/2015: 12.1%). While operating cash flow reached a very strong €211 million in Q2/2016, it could not match the exceptional prior-year quarter (Q2/2015: €271 million). The same applies to the margin of 14.3% (Q2/2015: 17.6%).
Fresenius Kabi raises its outlook for 2016 and now expects organic sales growth of 3% to 5% and EBIT2 growth in constant currency of 3% to 5%. Previously, Fresenius Kabi projected low single-digit organic sales growth and EBIT2 in constant currency to be roughly flat compared with 2015.
1Net income attributable to shareholders of Fresenius Kabi AG; 2015 before special items22015 before special items
For a detailed overview of special items please see the reconciliation tables on page 13-14 of the pdf file.
Fresenius Helios
Fresenius Helios is Germany’s largest hospital operator. HELIOS operates 112 hospitals, thereof 88 acute care clinics (including seven maximum care hospitals in Berlin-Buch, Duisburg, Erfurt, Krefeld, Schwerin, Wiesbaden and Wuppertal) and 24 post-acute care clinics. HELIOS treats more than 4.7 million patients per year, thereof approximately 1.3 million inpatients, and operates more than 34,000 beds.
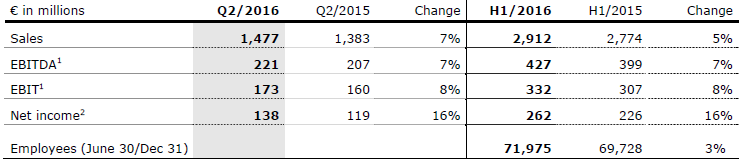


- 6% organic sales growth in Q2
- 60 bps sequential EBIT margin increase
- 2016 outlook confirmed
Sales increased by 5% to €2,912 million (H1/2015: €2,774 million). Organic sales growth was 4% (H1/2015: 3%). Acquisitions and divestitures had no material effect. In Q2/2016, sales increased by 7% to €1,477 million (Q2/2015: €1,383 million). Organic sales growth was 6% (Q2/2015: 2%).
EBIT1 grew by 8% to €332 million (H1/2015: €307 million). The EBIT margin1 increased to 11.4% (H1/2015: 11.1%). In Q2/2016, EBIT1 increased by 8% to €173 million (Q2/2015: €160 million). Sequentially, the EBIT margin increased by 60 bps to 11.7%.
Net income2 increased by 16% to €262 million (H1/2015: €226 million). In Q2/2016, net income2 increased by 16% to €138 million (Q2/2015: €119 million).
Fresenius Helios confirms its outlook for 2016 and projects organic sales growth of 3% to 5%. EBIT is expected to increase to €670 to €700 million.
12015 before special items2Net income attributable to shareholders of HELIOS Kliniken GmbH; 2015 before special items
For a detailed overview of special items please see the reconciliation tables on page 13-14 of the pdf file.
Fresenius Vamed
Fresenius Vamed manages projects and provides services for hospitals and other health care facilities worldwide. The portfolio ranges along the entire value chain: from project development, planning, and turnkey construction, via maintenance and technical management, to total operational management.
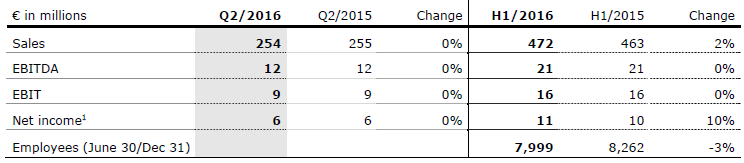


- Sales development reflects typical quarterly fluctuations in the project business
- Strong order intake of €228 million in Q2
- 2016 outlook confirmed
Sales increased by 2% (2% in constant currency) to €472 million (H1/2015: €463 million). Organic sales growth was 3%. Sales in the project business decreased by 3% to €195 million (H1/2015: €202 million). Sales in the service business grew by 6% to €277 million (H1/2015: €261 million). In Q2/2016, sales remained nearly unchanged at €254 million (Q2/2015: €255 million). Organic sales growth was 1%.
EBIT remained unchanged at €16 million (H1/2015: €16 million). The EBIT margin was 3.4% (H1/2015: 3.5%). In Q2/2016, EBIT remained unchanged at €9 million (Q2/2015: €9 million). The EBIT margin of 3.5% was at prior-year level.
Net income1 grew by 10% to €11 million (H1/2015: €10 million). In Q2/2016, net income1 of €6 million was at prior-year level.
Order intake increased by 64% to €465 million (H1/2015: €284 million). As of June 30, 2016, order backlog grew to €1,917 million (December 31, 2015: €1,650 million).
Fresenius Vamed confirms its outlook for 2016 and expects organic sales growth in the range of 5% to 10% and EBIT growth of 5% to 10%.
1Net income attributable to shareholders of VAMED AG
Conference Call
As part of the publication of the results for the first half of 2016, a conference call will be held on August 2, 2016 at 2 p.m. CEDT (8 a.m. EDT). All investors are cordially invited to follow the conference call in a live broadcast over the Internet at www.fresenius.com/investors. Following the call, a replay will be available on our website.
For additional information on the performance indicators used please refer to pages 25, 40, 56f., 100f. and 194 of the Annual Report 2015 of Fresenius SE & Co. KGaA. Constant currencies for income and expenses are calculated using prior year average rates; constant currencies for assets and liabilities are calculated using the mid-closing rate on the date of the respective statement of financial position (cf. Annual Report 2015, page 111). (https://www.fresenius.com/financial_reporting/Fresenius_GB_US_GAAP_2015_englisch.pdf).
This release contains forward-looking statements that are subject to various risks and uncertainties. Future results could differ materially from those described in these forward-looking statements due to certain factors, e.g. changes in business, economic and competitive conditions, regulatory reforms, results of clinical trials, foreign exchange rate fluctuations, uncertainties in litigation or investigative proceedings, and the availability of financing. Fresenius does not undertake any responsibility to update the forward-looking statements in this release.
For a detailed overview of special items please see the reconciliation table on page 13 of the pfd file.
Q1/2016:
- Sales: €6.9 billion (+7%, +7% in constant currency)
- EBIT1: €959 million (+13%, +11% in constant currency)
- Net income1,2: €362 million (+24%, +23% in constant currency)
Ulf Mark Schneider, CEO of Fresenius, said: “We have seen a strong start into 2016, reflected in our double-digit earnings growth. All business segments and regions have contributed to this success, demonstrating yet again enormous consistency in our sales and earnings development. We remain fully on track to achieve our 2016 and mid-term targets.“
12015 before special items2Net income attributable to shareholders of Fresenius SE & Co. KGaA
Group guidance for 2016 confirmed
Fresenius confirms its guidance for 2016. Sales are expected to increase by 6% to 8% in constant currency. Net income1,2, is expected to grow by 8% to 12% in constant currency.
The net debt/EBITDA3 ratio is expected to be approximately 2.5 at the end of 2016.
1Net income attributable to shareholders of Fresenius SE & Co. KGaA22015 before special items3Calculated at FY average exchange rates for both net debt and EBITDA; excluding potential acquisitions
7% sales growth in constant currency
Group sales increased by 7% (7% in constant currency) to €6,914 million (Q1/2015: €6,483 million). Organic sales growth was 7%. Acquisitions contributed 1% and divestitures reduced sales by 1%.
Group sales by region:
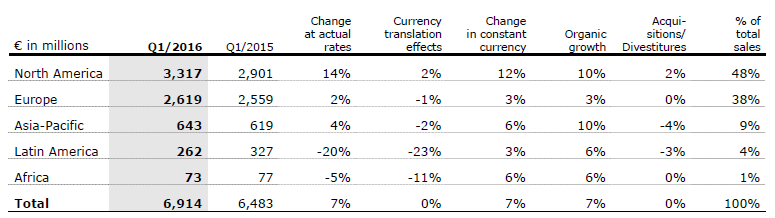


23% net income1 growth in constant currency
Group EBITDA2 increased by 11% (10% in constant currency) to €1,237 million (Q1/2015: €1,115 million). Group EBIT2 increased by 13% (11% in constant currency) to €959 million (Q1/2015: €851 million). The EBIT margin2 increased to 13.9% (Q1/2015: 13.1%).
Group net interest decreased to -€152 million (Q1/2015: -€165 million), mainly due to more favorable financing terms and lower net debt.
The Group tax rate (before special items) decreased to 28.4% (Q1/2015: 30.2%), mainly due to a lower tax rate at Fresenius Medical Care.
Noncontrolling interest increased to €216 million (Q1/2015: €187 million), of which 95% was attributable to the noncontrolling interest in Fresenius Medical Care.
Group net income1,2, increased by 24% (23% in constant currency) to €362 million (Q1/2015: €292 million). Earnings per share1,2 increased by 22% (22% in constant currency) to €0.66 (Q1/2015: €0.54).
1Net income attributable to shareholders of Fresenius SE & Co. KGaA22015 before special items3Calculated at FY average exchange rates for both net debt and EBITDA; excluding potential acquisitions
Continued investment in growth
Spending on property, plant and equipment was €313 million (Q1/2015: €273 million), primarily for the modernization and expansion of dialysis clinics, production facilities and hospitals. Total acquisition spending was €204 million (Q1/2015: €104 million).
Cash flow development
Operating cash flow decreased by 37% to €334 million (Q1/2015: €531 million) with a margin of 4.8% (Q1/2015: 8.2%). The decrease was mainly due to an adjustment in invoicing within the quarter and the timing of cash payroll payments at Fresenius Medical Care North America. Fresenius Medical Care expects that these effects will have no meaningful impact on the full year 2016 cash flow.
Free cash flow before acquisitions and dividends decreased to €2 million (Q1/2015: €258 million). Free cash flow after acquisitions and dividends was -€241 million (Q1/2015: €256 million).
Solid balance sheet structure
The Group’s total assets decreased by 1% (increased 1% in constant currency) to €42,445 million (Dec. 31, 2015: €42,959 million). Current assets grew by 1% (3% in constant currency) to €10,584 million (Dec. 31, 2015: €10,479 million). Non-current assets decreased by 2% (increased 1% in constant currency) to €31,861 million (Dec. 31, 2015: € 32,480 million).
Total shareholders’ equity was virtually unchanged at €18,009 million (Dec. 31, 2015: €18,003 million). In constant currency, it increased by 3%. The equity ratio increased to 42.4% (Dec. 31, 2015: 41.9%).
Group debt decreased by 1% (increased 1% in constant currency) to €14,549 million (Dec. 31, 2015: € 14,769 million). As of March 31, 2016, the net debt/EBITDA ratio was 2.671 (Dec. 31, 2015: 2.681).
12015 before special items; at LTM average exchange rates for both net debt and EBITDA
Business Segments
Fresenius Medical Care
Fresenius Medical Care is the world's largest provider of products and services for individuals with renal diseases. As of March 31, 2016, Fresenius Medical Care was treating 294,043 patients in 3,432 dialysis clinics. Along with its core business, the company seeks to expand the range of medical services in the field of care coordination.
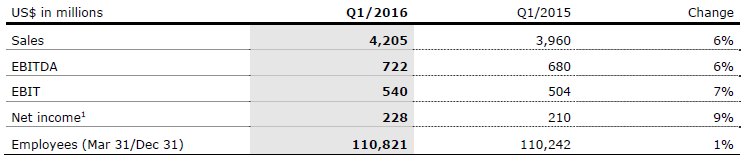


- 9% sales growth in constant currency
- Strong sales and EBIT growth in North America
- 2016 outlook confirmed
Sales increased by 6% (9% in constant currency) to US$4,205 million (Q1/2015: US$3,960 million). Organic sales growth was 7%. Acquisitions contributed 2%. Currency translation effects reduced sales by 3%.
Health Care services sales (dialysis services and care coordination) increased by 7% (9% in constant currency) to US$3,414 million (Q1/2015: US$3,182 million). Dialysis product sales increased by 2% (6% in constant currency) to US$791 million (Q1/2015: US$778 million).
In North America, sales increased by 10% to US$3,044 million (Q1/2015: US$2,771 million). Health Care services sales grew by 10% to US$2,832 million (Q1/2015: US$2,571 million). Dialysis product sales increased by 6% to US$212 million (Q1/2015: US$200 million).
Sales outside North America decreased by 2% (increased by 7% in constant currency) to US$1,158 million (Q1/2015: US$1,180 million). Health Care services sales decreased by 5% (increased by 6% in constant currency) to US$582 million (Q1/2015: US$611 million). Dialysis product sales increased by 1% (8% in constant currency) to US$576 million (Q1/2015: US$569 million).
EBIT increased by 7% (8% in constant currency) to US$540 million (Q1/2015: US$504 million). The EBIT margin was 12.8% (Q1/2015: 12.7%).
Net income1 increased by 9% (8% in constant currency) to US$228 million (Q1/2015: US$210 million).
Operating cash flow decreased by 60% to US$180 million (Q1/2015: US$447 million). The cash flow margin was 4.3% (Q1/2015: 11.3%). The decrease was mainly due to an adjustment in invoicing within the quarter and the timing of cash payroll payments at Fresenius Medical Care North America. Fresenius Medical Care expects that these effects will have no meaningful impact on the full year 2016 cash flow.
Fresenius Medical Care confirms its outlook for 2016. The company expects sales to grow by 7% to 10% in constant currency and net income1 is expected to increase by 15% to 20%2 in 2016.
For further information, please see Fresenius Medical Care’s Investor News at www.freseniusmedicalcare.com.
1Net income attributable to shareholders of Fresenius Medical Care AG & Co. KGaA
22015 before GranuFlo®/NaturaLyte® settlement costs (-US$37 million after tax) and before acquisitions (US$9 million after tax); hence the basis for expected net income growth is US$1,057 million.
Fresenius Kabi
Fresenius Kabi offers intravenously administered generic drugs, clinical nutrition and infusion therapies for seriously and chronically ill patients in the hospital and outpatient environments. The company is also a leading supplier of medical devices and transfusion technology products.
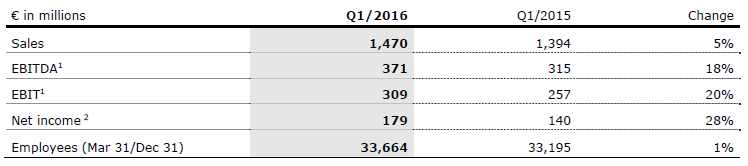

- 10% organic sales growth in Q1
- 19% constant currency EBIT1 growth in Q1
- 2016 outlook confirmed
Sales increased by 5% (8% in constant currency) to €1,470 million (Q1/2015: €1,394 million). Organic sales growth was 10%. Divestitures and currency translation effects reduced sales by 2% and 3% respectively.
Sales in Europe decreased by 1% (increased organically by 1%) to €512 million (Q1/2015: €518 million), mainly due to the divestment of the German oncology compounding business in February 2015. Sales in North America increased by 22% (organic growth: 20%) to €567 million (Q1/2015: €473 million). North American sales growth was mainly driven by persisting IV drug shortages as well as new product launches. Adverse currency translation effects decreased sales in Asia-Pacific by 5% (increased organically by 7%) to €254 million (Q1/2015: €268 million) and in Latin America/Africa by 5% (increased organically by 21%) to €128 million (Q1/2015: €135 million).
EBIT1 increased by 20% (19% in constant currency) to €309 million (Q1/2015: €257 million). The EBIT margin1 improved to 21.0% (Q1/2015: 18.5%).
Net income2 increased by 28% (26% in constant currency) to €179 million (Q1/2015: €140 million).
Based on the excellent net income development operating cash flow increased by 49% to €124 million (Q1/2015: €83 million) with a margin of 8.4% (Q1/2015: 6.0%).
Fresenius Kabi confirms its outlook for 2016 and projects low single-digit organic sales growth. EBIT1 in constant currency is expected to be roughly flat compared with 2015.
12015 before special items2Net income attributable to shareholders of Fresenius Kabi AG; 2015 before special items
Fresenius Helios
Fresenius Helios is Germany’s largest hospital operator. HELIOS operates 111 hospitals, thereof 87 acute care clinics (including seven maximum care hospitals in Berlin-Buch, Duisburg, Erfurt, Krefeld, Schwerin, Wiesbaden and Wuppertal) and 24 post-acute care clinics. HELIOS treats more than 4.7 million patients per year, thereof approximately 1.3 million inpatients, and operates more than 34,000 beds.
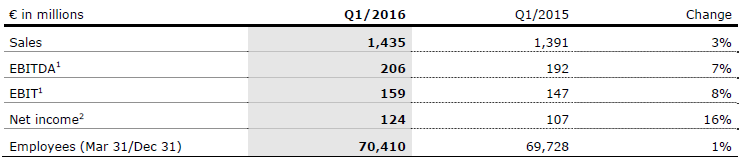


- 3% organic sales growth
- 50 bps EBIT margin1 increase to 11.1%
- 2016 outlook confirmed
Sales increased by 3% to €1,435 million (Q1/2015: €1,391 million). Organic sales growth was 3%. Acquisitions and divestitures had no material effect.
EBIT1 grew by 8% to €159 million (Q1/2015: €147 million). The EBIT margin1 increased to 11.1% (Q1/2015: 10.6%).
Net income2 increased by 16% to €124 million (Q1/2015: €107 million).
Fresenius Helios confirms its outlook for 2016 and projects organic sales growth of 3% to 5%. EBIT is expected to increase to €670 to €700 million.
12015 before special items2Net income attributable to shareholders of HELIOS Kliniken GmbH; 2015 before special items
Fresenius Vamed
Fresenius Vamed manages projects and provides services for hospitals and other health care facilities worldwide. The portfolio ranges along the entire value chain: from project development, planning, and turnkey construction, via maintenance and technical management, to total operational management.
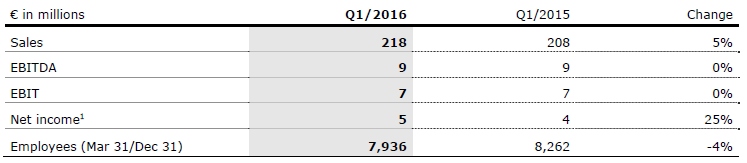


- Project and service business contributed equally to 6% organic sales growth
- Strong order intake of €237 million
- 2016 outlook confirmed
Sales increased by 5% (5% in constant currency) to €218 million (Q1/2015: €208 million). Organic sales growth was 6%. Sales in the project business increased by 6% to €85 million (Q1/2015: €80 million). Sales in the service business grew by 4% to €133 million (Q1/2015: €128 million).
EBIT remained unchanged with €7 million (Q1/2015: €7 million). The EBIT margin was 3.2% (Q1/2015: 3.4%).
Net income1 grew by 25% to €5 million (Q1/2015: €4 million).
Order intake increased to €237 million (Q1/2015: €192 million). As of March 31, 2016, order backlog grew to €1,803 million (December 31, 2015: €1,650 million).
Fresenius Vamed confirms its outlook for 2016 and expects organic sales growth in the range of 5% to 10% and EBIT growth of 5% to 10%.
1Net income attributable to shareholders of VAMED AG
Conference Call
As part of the publication of the results for Q1/2016, a conference call will be held on May 3, 2016 at 2 p.m. CEDT (8 a.m. EDT). All investors are cordially invited to follow the conference call in a live broadcast over the Internet at www.fresenius.com/media. Following the call, a replay will be available on our website.
This release contains forward-looking statements that are subject to various risks and uncertainties. Future results could differ materially from those described in these forward-looking statements due to certain factors, e.g. changes in business, economic and competitive conditions, regulatory reforms, results of clinical trials, foreign exchange rate fluctuations, uncertainties in litigation or investigative proceedings, and the availability of financing. Fresenius does not undertake any responsibility to update the forward-looking statements in this release.
If no timeframe is specified, information refers to fiscal year 2015.
For a detailed overview of special items please see the reconciliation tables on pages 16-17 in the pdf file of this Investor News
Fiscal year 2015:
- Sales: €27.6 billion (+19%, +9% in constant currency)
- EBIT1: €3,958 million (+25%, +13% in constant currency)
- Net income1,2: €1,423 million (+31%, +21% in constant currency)
- Dividend proposal: +25% to €0.55 per share
Q4/2015:
- Sales: €7.3 billion (+11%, +5% in constant currency)
- EBIT1: €1,109 million (+19%, +10% in constant currency)
- Net income1,2: €414 million (+30%, +24% in constant currency)
Group guidance 2016:
- Sales growth of 6% to 8% in constant currency
- Net income1,2 growth of 8% to 12% in constant currency
Targets 20193:
- Group sales: between €36 billion and €40 billion
- Group net income2: between €2.0 billion and €2.25 billion
Ulf Mark Schneider, CEO of Fresenius, said: "2015 was a remarkable year for Fresenius with double-digit sales and earnings growth. Patient focus and an uncompromising commitment to product and service quality are key to our success. Our growth story continues. We see significant opportunities around the globe for the company’s strong and balanced healthcare portfolio, and this confidence is reflected in our new 2019 Group targets."
1 2015 before special items but including GranuFlo®/NaturaLyte® settlement costs ( €54 million before tax; €10 million after tax)2 Net income attributable to shareholders of Fresenius SE & Co. KGaA3 At comparable exchange rates; includes small and mid-size acquisitions
Positive Group guidance for 2016
For 2016, Fresenius projects sales growth of 6% to 8% in constant currency. Net income1 is expected to grow by 8% to 12% in constant currency.
The net debt/EBITDA2 ratio is expected to be approximately 2.5 at the end of 2016.
New stretch targets for 20193
For 2019, Group sales are expected to reach €36 billion to €40 billion. Group net income4 is expected to increase to €2.0 billion to €2.25 billion.
1 Net income attributable to shareholders of Fresenius SE & Co. KGaA; 2015 before special items but including GranuFlo®/NaturaLyte® settlement costs2 Calculated at expected annual average exchange rates, for both net debt and EBITDA; without large unannounced acquisitions3 At comparable exchange rates; including small and mid-size acquisitions4 Net income attributable to shareholders of Fresenius SE & Co. KGaA
23rd consecutive dividend increase proposed
Based on the strong financial results, the Management Board will propose to the Supervisory Board a dividend increase of 25% to €0.55 per share (2014: €0.44). The total dividend distribution is expected to be €300 million.
9% sales growth in constant currency – fully in line with guidance
Group sales increased by 19% (9% in constant currency) to €27,626 million (2014: €23,231 million). Organic sales growth was 6%. Acquisitions contributed 4% and divestitures reduced sales by 1%. Positive currency translation effects (10%) were mainly driven by the Euro’s depreciation against the U.S. dollar. In Q4/2015, Group sales increased by 11% (5% in constant currency) to €7,257 million (Q4/2014: €6,520 million). Organic sales growth was 5%. Acquisitions contributed 1%, while divestitures reduced sales by 1%.
Group sales by region:

21% net income1,2 growth in constant currency – fully in line with guidance
Group EBITDA2 increased by 24% (12% in constant currency) to €5,073 million (2014: €4,095 million). Group EBIT2 increased by 25% (13% in constant currency) to €3,958 million (2014: €3,158 million). The EBIT margin2 increased to 14.3% (2014: 13.6%).
In Q4/2015, Group EBIT2 increased by 19% (10% in constant currency) to €1,109 million (Q4/2014: €935 million), the EBIT margin2 improved to 15.3% (Q4/2014: 14.3%).
Group net interest increased slightly to -€613 million (2014: -€602 million). More favourable financing terms and interest rate savings on lower debt were more than offset by currency translation effects. In Q4/2015, Group net interest of -€137 million was below the prior-year level (Q4/2014: -€171 million). Lower negative currency translation effects in Q4/2015 were more than offset by interest savings on lower debt.
The Group tax rate2 increased to 29.4% (2014: 28.4%), mainly due to the higher U.S. share of earnings before tax.
Noncontrolling interest was €939 million (2014: €745 million), of which 95% was attributable to the noncontrolling interest in Fresenius Medical Care.
Group net income1,2 increased by 31% (21% in constant currency) to €1,423 million (2014: €1,086 million). Earnings per share1,2 increased by 30% (20% in constant currency) to €2.61 (2014: €2.01). In Q4/2015, Group net income1,2 increased by 30% (24% in constant currency) to €414 million (Q4/2014: €318 million). Earnings per share1,2 increased by 27% (22% in constant currency) to €0.75 (Q4/2014: €0.59).
Group net income1 including special items increased by 27% (17% in constant currency) to €1,358 million (2014: €1,067 million). Earnings per share1 including special items increased by 27% (16% in constant currency) to €2.50 (2014: € 1.97). In Q4/2015, Group net income1 including special items increased by 40% (32% in constant currency) to €359 million (Q4/2014: €257 million). Earnings per share1 including special items increased by 40% (32% in constant currency) to €0.66 (Q4/2014: €0.47).
1 Net income attributable to shareholders of Fresenius SE & Co. KGaA2 Before special items but including GranuFlo®/NaturaLyte® settlement costs ( €54 million before tax; €10 million after tax)
Continued investment in growth
Spending on property, plant and equipment was €1,512 million (2014: €1,345 million), primarily for the modernization and expansion of dialysis clinics, production facilities and hospitals. This corresponds to 5.5% of sales.
Total acquisition spending was €517 million (2014: €2,450 million).
Excellent cash flow development
Operating cash flow increased by 29% to €3,327 million (2014: €2,585 million) with a margin of 12.0% (2014: 11.1%). The Euro’s depreciation against the U.S. dollar positively influenced 2015 operating cash flow, while 2014 operating cash flow was reduced by the US$1151 million payment for the W.R. Grace bankruptcy settlement. The excellent cash flow margin demonstrates the underlying strength of cash flow generation across all business segments. Operating cash flow in Q4/2015 increased by 32% to €1,176 million (Q4/2014: €890 million) with a margin of 16.2% (Q4/2014: 13.7%).
Free cash flow before acquisitions and dividends increased by 48% to €1,865 million (2014: €1,262 million), with a margin of 6.8% (2014: 5.4%). Free cash flow after acquisitions and dividends improved to €1,194 million (2014: €1,348 million).
1 See Annual Report 2014, page 152 f.
Solid balance sheet structure1
The Group’s total assets increased by 9% (3% in constant currency) to €43,170 million (Dec. 31, 2014: €39,788 million). This increase is mainly attributable to currency translation effects. Current assets grew by 9% (6% in constant currency) to €10,917 million (Dec. 31, 2014: €10,012 million). Non-current assets increased by 8% (2% in constant currency) to €32,253 million (Dec. 31, 2014: € 29,776 million).
Total shareholders’ equity increased by 16% (11% in constant currency) to €18,003 million (Dec. 31, 2014: €15,483 million). The equity ratio increased to 41.7% (Dec. 31, 2014: 38.9%).
Group debt decreased by 4% (-9% in constant currency) to €14,769 million (Dec. 31, 2014: € 15,345 million). As of December 31, 2015, the net debt/EBITDA ratio was 2.682. As of December 31, 2014, the ratio was 3.243. EBITDA growth as well as the net debt reduction by application of meaningful free cash flow have equally contributed to this substantial decrease of the ratio.
1 2014 adjusted due to debt issuance cost restatement (U.S. GAAP standard ASU 2015-03)2 Before special items; at LTM average exchange rates for both net debt and EBITDA3 Pro forma acquisitions; before special items; at LTM average exchange rates for both net debt and EBITDA
Business Segments
Fresenius Medical Care
Fresenius Medical Care is the world's largest provider of products and services for individuals with renal diseases. As of December 31, 2015, Fresenius Medical Care was treating 294,381 patients in 3,418 dialysis clinics. Along with its core business, the company seeks to expand the range of medical services in the field of care coordination.

6% sales growth, 2% net income growth2 before GranuFlo®/NaturaLyte® settlement costs – fully in line with 2015 outlook
- Adverse currency developments weigh on business outside North America
- 2016 outlook confirmed: 7% to 10% sales growth in constant currency and 15 to 20% net income growth3 expected
Sales increased by 6% (11% in constant currency) to US$16,738 million (2014: US$15,832 million). Organic sales growth was 6%. Acquisitions contributed 6%, while divestitures reduced sales by 1%. Currency translation effects reduced sales by 5%. In Q4/2015, sales increased by 1% (5% in constant currency) to US$4,348 million (Q4/2014: US$4,320 million).
Health Care services sales (dialysis services and care coordination) increased by 9% (13% in constant currency) to US$13,392 million (2014: US$12,250 million). Dialysis product sales decreased by 7% (increased by 4% in constant currency) to US$3,346 million (2014: US$3,582 million).
In North America, sales increased by 13% to US$11,813 million (2014: US$10,500 million). Health Care services sales grew by 13% to US$10,932 million (2014: US$9,655 million). Dialysis product sales increased by 4% to US$881 million (2014: US$845 million). Sales outside North America decreased by 7% (increased by 9% in constant currency) to US$4,897 million (2014: US$5,265 million). Health Care services sales decreased by 5% (increased by 12% in constant currency) to US$2,459 million (2014: US$2,595 million). Dialysis product sales decreased by 9% (increased by 6% in constant currency) to US$2,437 million (2014: US$2,670 million).
EBIT increased by 3% (8% in constant currency) to US$2,327 million (2014: US$2,255 million). The EBIT margin was 13.9% (2014: 14.2%). Based on the agreement in principle to resolve the GranuFlo®/NaturaLyte® product liability litigation, Fresenius Medical Care expects a pre-tax financial impact of US$60 million from the settlement. Adjusted for one-time items4, EBIT increased by 5% to US$2,388 million. In Q4/2015, EBIT remained roughly flat at US$662 million (Q4/2014: US$663 million). In constant currency, EBIT increased by 3%. The EBIT margin was 15.2% (Q4/2014: 15.4%). EBIT excluding one-time items5 increased by 5% to US$704 million.
Net income attributable to shareholders of Fresenius Medical Care AG & Co. KGaA excluding one-time items4 increased by 2% to US$1,082 million. Net income including one-time items decreased by 2% (increased by 3% in constant currency) to US$1,029 million (2014: US$1,045 million). Net income attributable to non-controlling interest increased by 32% to US$284 million, mainly due to the strong earnings development in North America. In Q4/2015, net income excluding one-time items5 increased by 2% to US$347 million. Net income including one-time items decreased by 6% (-3% in constant currency) to US$317 million (Q4/2014: US$335 million).
Operating cash flow increased by 5% to US$1,960 million (2014: US$1,861 million). Operating cash flow in the prior-year period was reduced by the US$115 million6 payment for the W.R. Grace bankruptcy settlement. The cash flow margin was 11.7% (2014: 11.8%). In Q4/2015, operating cash flow reached an excellent US$548 million (Q4/2014: US$588 million) at a margin of 12.6% (Q4/2014: 13.6%).
Fresenius Medical Care confirms its outlook for 2016. The company expects sales to grow by 7% to 10% in constant currency and net income attributable to shareholders of Fresenius Medical Care AG & Co. KGaA is expected to increase by 15% to 20%3 in 2016.
The outlook is based on current exchange rates. Savings from the global efficiency program are included, while earnings contributions from acquisitions 2015/2016 are not.
For further information, please see Fresenius Medical Care’s Press Release at www.freseniusmedicalcare.com.
1 Net income attributable to shareholders of Fresenius Medical Care AG & Co. KGaA2 2015 before GranuFlo®/NaturaLyte® settlement costs (-US$37 million after tax), before divestiture of dialysis business in Venezuela (-US$27 million after tax) and European pharmaceutical business (US$11 million after tax); 2014 before closing of manufacturing plant (-US$13 million after tax)3 2015 before GranuFlo®/NaturaLyte® settlement costs (-US$37 million after tax) and before acquisitions (US$9 million after tax); hence the basis for expected net income growth are US$1,057 million.4 2015 before GranuFlo®/NaturaLyte® settlement costs (-US$60 million before tax; -US$37 million after tax), before divestiture of dialysis business in Venezuela (-US$26 million before tax; -US$27 million after tax) and European pharmaceutical business (US$25 million before tax; US$11 million after tax); 2014 before closing of manufacturing plant (-US$16 million before tax; -US$13 million after tax)5 Q4/2015 before GranuFlo®/NaturaLyte® settlement costs (-US$60 million before tax; -US$37 million after tax), before divestiture of European pharmaceutical business (US$18 million before tax; US$7 million after tax); 2014 before closing of manufacturing plant (-US$6 million before tax; -US$6 million after tax)6 See Annual Report 2014, page 152 f.
Fresenius Kabi
Fresenius Kabi offers intravenously administered generic drugs, clinical nutrition and infusion therapies for seriously and chronically ill patients in the hospital and outpatient environments. The company is also a leading supplier of medical devices and transfusion technology products.

- 8% organic sales growth, 21% EBIT1 growth in constant currency – fully in line with 2015 outlook
- Strong operating cash flow margin of 15.3% in 2015
- 2016 outlook: low single-digit organic sales growth and roughly flat EBIT in constant currency expected
Sales increased by 16% (7% in constant currency) to €5,950 million (2014: €5,146 million). Organic sales growth was 8%. Acquisitions contributed 1% while divestitures reduced sales by 2%. Positive currency translation effects (9%) were mainly driven by the Euro’s depreciation against the U.S. dollar and the Chinese yuan. In Q4/2015, sales increased by 10% (5% in constant currency) to €1,519 million (Q4/2014: €1,386 million). Organic sales growth was 8%.
Sales in Europe grew by 1% (organic growth: 4%) to €2,123 million (2014: €2,102 million). Sales in North America increased by 37% (organic growth: 16%) to €2,093 million (2014: €1,531 million). North American sales growth was driven by persisting IV drug shortages and new product launches. Asia-Pacific sales increased by 16% (organic growth: 5%) to €1,141 million (2014: €987 million). Sales in Latin America/Africa grew by 13% (organic growth: 13%) to €593 million (2014: €526 million).
EBIT1 increased by 36% (21% in constant currency) to €1,189 million (2014: €873 million). The EBIT margin1 improved to 20.0% (2014: 17.0%). In Q4/2015, EBIT1 increased by 33% (26% in constant currency) to €317 million (Q4/2014: €239 million). The EBIT margin1 increased to 20.9% (Q4/2014: 17.2%). The EBIT margin was positively influenced by the Euro’s depreciation against the U.S. dollar.
Net income2 increased by 43% (27% in constant currency) to €669 million (2014: €468 million). In Q4/2015, net income2 increased by 45% (38% in constant currency) to €190 million (Q4/2014: €131 million).
Operating cash flow increased by 42% to €913 million (2014: €641 million) with a margin of 15.3% (2014: 12.5%). In Q4/2015, operating cash flow increased by 55% to €324 million (Q4/2014: €209 million) with a margin of 21.3% (Q4/2014: 15.1%).
Fresenius Kabi’s initiatives to increase production efficiency and streamline administrative structures are well on track. Costs of €105 million before tax were incurred in 2015. These costs are reported in the Group segment Corporate/Other. The program led to initial cost savings of approximately €10 million in 2015. The targeted savings run-rate of approximately €40 million p.a. is expected by 2018.
For 2016, Fresenius Kabi expects to achieve low single-digit organic sales growth. EBIT3 in constant currency is expected to be roughly flat.
1 Before special items2 Net income attributable to shareholders of Fresenius Kabi AG; before special items3 2015 before special items
Fresenius Helios
Fresenius Helios is Germany’s largest hospital operator. HELIOS operates 111 hospitals, thereof 87 acute care clinics (including seven maximum care hospitals in Berlin-Buch, Duisburg, Erfurt, Krefeld, Schwerin, Wiesbaden and Wuppertal) and 24 post-acute care clinics. HELIOS treats more than 4.7 million patients per year, thereof approximately 1.3 million inpatients, and operates more than 34,000 beds.

- 3% organic sales growth, €640 million EBIT1 – fully in line with 2015 outlook
- 100 bps EBIT margin1 increase to 11.5% in 2015
- 2016 outlook: 3% to 5% organic sales growth and EBIT of €670 to €700 million expected
Sales increased by 6% to €5,578 million (2014: €5,244 million). Organic sales growth was 3%. Acquisitions contributed 4%, while divestitures reduced sales by 1%. In Q4/2015, sales increased by 4% to €1,411 million (Q4/2014: €1,361 million), organic sales growth was 4%.
EBIT1 grew by 16% to €640 million (2014: €553 million). The EBIT margin1 increased to 11.5% (2014: 10.5%). The increase is attributable both to the successful integration of the acquired hospitals from Rhön-Klinikum AG and to continuous improvements of the established business. In Q4/2015, EBIT1 increased by 8% to €168 million (Q4/2014: €156 million) with a margin1 of 11.9% (Q4/2014: 11.5%).
Net income2 increased by 21% to €483 million (2014: €400 million). In Q4/2015, net income2 increased by 15% to €131 million (Q4/2014: €114 million).
Sales of the established hospitals grew by 3% to €5,379 million (2014: €5,222 million). EBIT1 increased by 15% to €631 million (2014: €551 million). The EBIT margin1 increased to 11.7% (2014: 10.6%). Sales of the newly acquired hospitals (consolidation ≤1 year) were €199 million. EBIT1 was €9 million with a margin of 4.5%.
The integration of the hospitals acquired from Rhön-Klinikum AG remains well on track. Integration costs in 2015 were €12 million (Q4/2015: €0 million) taking the total to date to €63 million. Fresenius Helios does not expect any further integration costs. Amount (€85 million p.a.) and timing (spring 2016) of targeted near-term cost synergies are confirmed.
For 2016, Fresenius Helios projects organic sales growth of 3% to 5%. EBIT is expected to increase to €670 to €700 million.
1 Before special items2 Net income attributable to shareholders of HELIOS Kliniken GmbH; before special items
Fresenius Vamed
Fresenius Vamed manages projects and provides services for hospitals and other health care facilities worldwide. The portfolio ranges along the entire value chain: from project development, planning, and turnkey construction, via maintenance and technical management, to total operational management.

- 6% organic sales growth, 8% EBIT growth – fully in line with 2015 outlook
- Order intake of €904 million at all-time high
- 2016 Outlook: 5% to 10% organic sales growth and 5% to 10% EBIT growth expected
Sales increased by 7% (6% in constant currency) to €1,118 million (2014: €1,042 million). Organic sales growth was 6%. Sales in the project business increased by 3% to €575 million (2014: €558 million). Sales in the service business grew by 12% to €543 million (2014: €484 million). In Q4/2015, sales remained unchanged at €387 million compared to the prior-year. Organic sales growth was 1%.
EBIT grew by 8% to €64 million (2014: €59 million). The EBIT margin remained unchanged at 5.7%. In Q4/2015, EBIT increased by 6% to €34 million (Q4/2014: €32 million). The EBIT margin increased by 50 bps to 8.8%.
Net income1 grew by 7% to €44 million (2014: €41 million). In Q4/2015, net income1 increased by 4% to €24 million (Q4/2014: €23 million).
Order intake increased to €904 million (2014: €840 million), reaching an all-time high. As of December 31, 2015, order backlog was €1,650 million (Dec. 31, 2014: €1,398 million).
For 2016, Fresenius Vamed expects organic sales growth in the range of 5% to 10% and EBIT growth of 5% to 10%.
1 Net income attributable to shareholders of VAMED AG
Conference Call
As part of the publication of the results for fiscal year 2015, a conference call will be held on February 24, 2016 at 2 p.m. CET (8 a.m. EST). All investors are cordially invited to follow the conference call in a live broadcast over the Internet at www.fresenius.com/investors. Following the call, a replay will be available on our website.
This release contains forward-looking statements that are subject to various risks and uncertainties. Future results could differ materially from those described in these forward-looking statements due to certain factors, e.g. changes in business, economic and competitive conditions, regulatory reforms, results of clinical trials, foreign exchange rate fluctuations, uncertainties in litigation or investigative proceedings, and the availability of financing. Fresenius does not undertake any responsibility to update the forward-looking statements in this release.