
A recent study places Fresenius among the top 500 companies in terms of career training programs in Germany. Criteria used for judgement were the quality of supervision, in-house training, company engagement, success rate and innovative teaching methods. The companies were rated by the business magazine Capital and the internet portal, ausbildung.de. Fresenius received a best possible five-star rating for its on-the-job training and dual-studies, a combination of theory and on-the-job training, programs. The company trains more than 4,000 apprentices and dual-studies interns.
- Excellent performance of Fresenius Kabi across all regions and product categories
- Fresenius Medical Care’s sales and earnings growth below the Company’s expectations
- Preparatory initiatives for expected regulatory requirements and decline in admissions impact Helios Germany; Helios Spain with steady yet dynamic growth
- Strong momentum in both Vamed’s project and service businesses
Group guidance for 2018 confirmed and narrowed
As announced on October 16, 2018 Fresenius confirms and narrows its Group guidance1 for FY/18. This is mainly driven by an excellent development of Fresenius Kabi, which partially offset the lower than expected sales and earnings contributions of Fresenius Medical Care and Helios Germany. Group sales are expected to increase at the low end of the original 5% to 8%2 guidance range (in constant currency). Fresenius expects net income1,3,4 growth at the low end of the original 6% to 9% guidance range (in constant currency). Excluding expenditures for the further development of the biosimilars business, net income1,3,5 growth is projected at the low end of the original ~10% to 13% guidance range (in constant currency).
1 2018 before special items (excluding effects related to the Akorn and NxStage transactions, gains from divestitures of Care Coordination activities and increase of FCPA provision)
2 FY/17 base adjusted for IFRS 15 adoption (-€486 million) and divestitures of Care Coordination activities (-€558 million) at Fresenius Medical Care
3 Net income attributable to shareholders of Fresenius SE & Co. KGaA
4 FY/17 base: €1,804 million; FY/18 before special items; including contributions to the campaigns in the U.S. opposing state ballot initiatives at Fresenius Medical Care; including expenditures for further development of the biosimilars business at Fresenius Kabi (€43 million after tax in FY/17 and ~€120 million after tax in FY/18)
5 FY/17 base: €1,847 million; FY/18 before special items; including contributions to the campaigns in the U.S. opposing state ballot initiatives at Fresenius Medical Care; excluding expenditures for further development of the biosimilars business at Fresenius Kabi (€43 million after tax in FY/17 and ~€120 million after tax in FY/18)
If no timeframe is specified, information refers to Q1-3/18
Q3/18:
- Sales: €8.2 billion (+3%1, +4% in constant currency1)
- EBIT2: €1,112 million (+0%, +0% in constant currency)
- EBIT2: (excl. biosimilars business): €1,153 million (+3%, +2% in constant currency)
- Net income2,3: €445 million (+8%, +8% in constant currency)
- Net income2,3: €474 million (+13%, +13% in constant currency)
(excl. biosimilars business)
Q1-3/18:
- Sales: €24.7 billion (+1%1, +5% in constant currency1)
- EBIT2: €3,311 million (-5%, -1% in constant currency)
- EBIT2: (excl. biosimilars business): €3,424 million (-3%, +2% in constant currency)
- Net income2,3: €1,367 million (+3%, +7% in constant currency)
- Net income2,3: €1,449 million (+8%, +12% in constant currency)
(excl. biosimilars business)
1 Growth rates adjusted for IFRS 15 adoption and divestitures of Care Coordination activities (Q3/17 base: €7,927 million; Q1-3/17 base: €24,551 million)
2 Before special items (before expenses related to the Akorn transaction, gains from divestitures of Care Coordination activities and increase of FCPA provision); growth rates: 2017 base adjusted for divestitures of Care Coordination activities
3 Net income attributable to shareholders of Fresenius SE & Co. KGaA
For a detailed overview of special items please see the reconciliation tables on pages 19-20 in the PDF document.
Stephan Sturm, CEO of Fresenius, said: “In the third quarter, Fresenius again achieved healthy sales growth and drove earnings growth even a touch stronger. Fresenius Kabi, Fresenius Vamed and Quirónsalud delivered a truly excellent performance. At the same time, Fresenius Medical Care and our German Helios hospitals will enhance their efforts to further improve and adapt to changing market conditions. From an overall position of strength, we are in the closing stretch for yet another record year.”
5% sales growth in constant currency1
Group sales increased by 1%1 (5%1 in constant currency) to €24,695 million (Q1-3/17: €25,191 million). Organic sales growth was 4%. Acquisitions/divestitures contributed net 1% to growth. Negative currency translation effects of 4% were mainly driven by the devaluation of the U.S. dollar and the Chinese yuan against the euro. In Q3/18, Group sales increased by 3%1 (4%1 in constant currency) to €8,192 million (Q3/17: €8,297 million). Organic sales growth was 4%. Acquisitions/divestitures had no net contribution to growth. Currency translation effects reduced sales by 1%.
1 Growth rates adjusted for IFRS 15 adoption and divestitures of Care Coordination activities at Fresenius Medical Care (Q1-3/17 base: €24,551 million; Q3/17 base: €7,927 million)
Group sales by region:


7% net income1,2,3 growth in constant currency
Group EBITDA2 decreased by 4%3 (0%3 in constant currency) to €4,375 million (Q1-3/17: €4,579 million). Group EBIT2 decreased by 5%3 (-1%3 in constant currency) to €3,311 million (Q1-3/17: €3,522 million). The EBIT margin2 was 13.4% (Q1 3/17: 14.0%). Group EBIT2 before expenses for the further development of the biosimilars business decreased by 3%3 (increased 2%3 in constant currency) to €3,424 million. In the prior-year period the compensation for treatments of U.S. war veterans (“VA agreement”) contributed €88 million as a one-time effect. Group EBIT2 excluding the VA agreement and expenses for the further development of the biosimilars business increased by 4% in constant currency.
In Q3/18, Group EBIT3 was broadly stable year-over-year3 (broadly stable3 in constant currency) at €1,112 million (Q3/17: €1,129 million), with an EBIT margin2 of 13.6% (Q3/17: 13.6%). Group EBIT2 excluding the prior-year VA agreement and expenses for the further development of the biosimilars business increased by 2%3 in constant currency.
Group net interest2 was -€436 million (Q1-3/17: -€484 million). The decrease is mainly driven by currency effects as well as refinancing activities and the divestitures of Care Coordination activities.
The decrease of the Group tax rate before special items to 22.0% (Q1-3/17: 28.1%) was mainly due to the U.S. tax reform and some one time effects in Q3 at Fresenius Medical Care and Fresenius Kabi. In Q3/18, the Group tax rate2 was 21.4% (Q3/17: 27.4%).
Noncontrolling interest2 was €876 million (Q1-3/17: €854 million), of which 95% was attributable to the noncontrolling interest in Fresenius Medical Care.
1 Net income attributable to shareholders of Fresenius SE & Co. KGaA
2 Before special items
3 Base 2017 base adjusted for divestitures of Care Coordination activities
For a detailed overview of special items please see the reconciliation tables on pages 19-20 in the PDF document.
Group net income1,2 increased by 3%3 (7%3 in constant currency) to €1,367 million (Q1 3/17: €1,329 million). Earnings per share1,2 increased by 3%3 (7%3 in constant currency) to €2.46 (Q1-3/17: €2.40). In Q3/18, Group net income1,2 increased by 8%3 (8%3 in constant currency) to €445 million (Q3/17: €413 million). Earnings per share1,2 increased by 7%3 (7%3 in constant currency) to €0.80 (Q3/17: €0.75).
Group net income1,2,4 before expenses for the further development of the biosimilars business increased by 8%3 (12%3 in constant currency) to €1,449 million (Q1-3/17: €1,339 million). Earnings per share1,2,4 increased by 8%3 (12%3 in constant currency) to €2.61 (Q1-3/17: €2.42). In Q3/18, Group net income1,2,4 increased by 13%3 (13%3 in constant currency) to €474 million (Q3/17: €423 million). Earnings per share1,2,4 increased by 12%3 (12%3 in constant currency) to €0.85 (Q3/17: €0.77).
Group net income2,5 after special items increased by 16% (by 21% in constant currency) to €1,511 million (Q1-3/17: €1,303 million), mainly due to gains related to divestitures in Care Cordination activities at Fresenius Medical Care. Earnings per share2,5 increased by 16% (21% in constant currency) to €2.72 (Q1-3/17: €2.35). In Q3/18, Group net income2,5 increased by 6% (4% in constant currency) to €419 million (Q3/17: €396 million). Earnings per share2,5 increased by 6% (4% in constant currency) to €0.75 (Q3/17: €0.71).
1 Before special items
2 Net income attributable to shareholders of Fresenius SE & Co. KGaA
3 2017 base adjusted for divestitures of Care Coordination activities
4 Before expenses for the further development of the biosimilars business
5 After special items
For a detailed overview of special items please see the reconciliation tables on pages 19-20 in the PDF document.
Continued investment in growth
Spending on property, plant and equipment was €1,370 million (Q1-3/17: €1,137 million), primarily for the modernization and expansion of dialysis clinics, production facilities as well as hospitals and day clinics. This corresponds to 5.5% of sales.
Total acquisition spending was €876 million (Q1-3/17: €6,662 million). The prior-year period included the acquisition of Quirónsalud.
Cash flow development
Group operating cash flow decreased by 15% to €2,405 million (Q1-3/17: €2,821 million) with a margin of 9.7% (Q1-3/2017: 11.2%). The decrease is mainly due to two effects at Fresenius Medical Care in North America: Receipt of a ~€200 million payment under the VA agreement in the prior-year period as well as increased accounts receivable related to the addition of calcimimetics into the Medicare ESRD payment bundle. In addition, negative currency translation effects weighed on the cash flow development in Q1-3/18. Operating cash flow in Q3/18 increased by 1% to €1,149 million (Q3/17: €1,138 million), with a margin of 14.0% (Q3/17: 13.7%).
Given the effects described above and growing investments, free cash flow before acquisitions and dividends decreased to €1,049 million (Q1-3/17: €1,705 million). Free cash flow after acquisitions and dividends was €1,172 million (Q1-3/17: -€5,233 million).
Solid balance sheet structure
The Group’s total assets increased by 5% (4% in constant currency) to €55,723 million (Dec. 31, 2017: €53,133 million). Current assets grew by 16% (16% in constant currency) to €14,593 million (Dec. 31, 2017: €12,604 million). Non-current assets increased by 1% (broadly stable in constant currency) to €41,130 million (Dec. 31, 2017: € 40,529 million).
Total shareholders’ equity increased by 10% (9% in constant currency) to €23,998 million (Dec. 31, 2017: €21,720 million). The equity ratio increased to 43.1% (Dec. 31, 2017: 40.9%).
Group debt was broadly stable unchanged (decreased by 1% in constant currency) at €18,961 million (Dec. 31, 2017: € 19,042 million). Group net debt decreased by 5% (-6% in constant currency) to € 16,505 million (Dec. 31, 2017: € 17,406 million) mainly due to the proceeds from divestitures of Care Coordination activities.
As of September 30, 2018, the net debt/EBITDA ratio was 2.751,2 (December 31, 2017: 2.841,2). Excluding the proceeds from divestitures of Care Coordination activities the net debt/EBITDA ratio was 2.961,2. At year-end 2018, Fresenius now expects the FY/18 net debt/EBITDA1,2 ratio to be on a comparable level to year-end 2017.
1 At LTM average exchange rates for both net debt and EBITDA; pro forma closed acquisitions/divestitures, excluding Akorn and NxStage transactions
2 Before special items
Increased number of employees
As of September 30, 2018, the number of employees was 277,318 (Dec. 31, 2017: 273,249).
Business Segments
Fresenius Medical Care
Fresenius Medical Care is the world's largest provider of products and services for individuals with renal diseases. As of September 30, 2018, Fresenius Medical Care was treating 329,085 patients in 3,872 dialysis clinics. Along with its core business, the company provides related medical services in the field of Care Coordination.

- 3% comparable1 sales growth in constant currency in Q3
- -2% adjusted4,6 net income decrease in constant currency in Q3
- Outlook for FY/18 adjusted
Sales decreased by 8% (-2% in constant currency) to €12,247 million (Q1-3/17: €13,355 million). Organic sales growth was 3%. Currency translation effects reduced sales by 7%. The adoption of IFRS 15 reduced sales by 3%. Q1-3/17 base additionally adjusted for divestitures of Care Coordination activities, sales decreased by 4% (increased by 3% in constant currency).
1 Adjusted for IFRS 15 implementation; base adjusted for divested Care Coordination activities
2 Excluding VA agreement Q3: 3%; Q1-3: 4%
3 Excluding gains from divestitures of Care Coordination activities, increase of FCPA provision, ballot initiatives, divested Care Coordination activities in Q3/2017; including Natural disaster costs and VA agreement
4 Net income attributable to shareholders of Fresenius Medical Care AG & Co. KGaA
5 Consistent with guidance, i.e. excluding gains from divestitures of Care Coordination activities, increase of FCPA provision, ballot initiatives, , divested Care Coordination activities; including Natural disaster costs, the effect of the U.S. Tax Reform and including VA agreement
6 Consistent with guidance, i.e. excluding gains from divestitures of Care Coordination activities, the effect of the U.S. Tax Reform, VA agreement, FCPA provision, ballot initiatives, divested Care Coordination activities, Natural disaster costs
In Q3/18, sales decreased by 6% (-6% in constant currency) to €4,058 million (Q3/17: €4,336 million). Organic sales growth was 3%. The adoption of IFRS 15 reduced sales by 3%. Q3/17 base additionally adjusted for divestitures of Care Coordination activities, sales in Q3/18 increased by 2% (increased by 3% in constant currency).
Health Care services sales (dialysis services and care coordination) decreased by 4%1 (increased by 3%1 in constant currency) to €9,852 million (Q1-3/17: €10,950 million). With €2,395 million (Q1-3/17: €2,405 million), Health Care product sales were on prior-year’s level (increased by 5% in constant currency).
In North America, sales decreased by 5%1 (increased by 1%1 in constant currency) to €8,589 million (Q1-3/17: €9,715 million). Health Care services sales decreased by 6%1 (increased by 1%1 in constant currency) to €7,978 million (Q1-3/17: €9,086 million). Excluding the 2017 effect from the VA Agreement (€96 million), Health Care services sales increased by 2%1 in constant currency. Health Care product sales decreased by 3% (increased by 4% in constant currency) to €610 million (Q1-3/17: €629 million).
Sales outside North America increased by 1% (7% in constant currency) to €3,648 million (Q1-3/17: €3,628 million).
Health Care services sales increased by 1% (9% in constant currency) to €1,873 million (Q1-3/17: €1,864 million). Health Care product sales increased by 1% (5% in constant currency) to €1,774 million (Q1-3/17: €1,764 million).
Fresenius Medical Care’s EBIT increased by 32% (39% in constant currency) to €2,425 million (Q1-3/17: €1,843 million), driven by the divestitures of Care Coordination activities. The EBIT margin increased to 19.8% (Q1-3/17: 13.8%). EBIT on a comparable basis decreased by 2% in constant currency and EBIT margin was 13.9% (Q1-3/17: 14.3%).
In Q3/18, EBIT decreased by 13% (-20% in constant currency) to €527 million (Q3/17: €609 million). The EBIT margin decreased to 13.0% (Q3/17: 14.0%). EBIT on a comparable basis increased by 5% (increased by 4% in constant currency) and EBIT margin increased to 15.1% (Q3/17: 14.8%).
1 Growth rate adjusted for IFRS 15 implementation and divested Care Coordination activities
Net income1 increased by 76% (86% in constant currency) to €1,557 million (Q1-3/17: €886 million). Adjusted net income1 growth was 4% in constant currency. Net income1 growth on a comparable basis was 16% in constant currency.
In Q3/18, net income1 decreased by 8% (-17% in constant currency) to €285 million (Q3/17: €309 million). Adjusted net income1 growth was -2% in constant currency. Net income1 growth on a comparable basis was 19% in constant currency.
Operating cash flow was €1,220 million (Q1-3/17: €1,664 million). The cash flow margin was 10.0% (Q1-3/17: 12.5%). The decrease is mainly due to two effects in North America: Receipt of a ~€200 million payment under the VA agreement in the prior-year period as well as increased accounts receivable related to the addition of calcimimetics into the Medicare ESRD payment bundle. In Q3/18, operating cash flow was €609 million (Q3/17: €612 million), mainly driven by higher tax payments and discretionary contributions to pension plan assets in the U.S., almost fully offset by decreases in accounts receivable. The cash flow margin was 15.0% (Q3/17: 14.1%).
Fresenius Medical Care revised its outlook for FY/18 as the business development in Q3/18 was below the company’s expectations. Fresenius Medical Care now expects sales growth of 2% to 3%2 in constant currency (previously: 5% to 7%2). On a comparable basis3, Fresenius Medical Care now expects FY/18 net income1 to increase by 11% to 12%3 in constant currency (previously: 13% to 15%3). On an adjusted basis4, Fresenius Medical Care now expects FY/18 net income1 to increase by 2% to 3%4 in constant currency (previously: 7% to 9%4).
For further information, please see Fresenius Medical Care’s Investor News at www.freseniusmedicalcare.com.
1 Net income attributable to shareholders of Fresenius Medical Care AG & Co. KGaA
2 2017 base: €16,739 million (adjusted for IFRS 15 adoption (-€486 million) and divestitures of Care Coordination activities (-€558 million))
3 2017 base: €1,242 million, excluding H2/17 net income of divestited Care Coordination activities (-€38 million); 2018 including benefits of the U.S. tax reform but excluding gains from divestitures of Care Coordination activities, contributions to the campaigns in the U.S. opposing state ballot initiatives at Fresenius Medical Care and FCPA provision
4 2017 base: €1,162 million, excluding H2/17 net income of divested Care Coordination activities (-€38 million), the effect of the U.S. tax reform, natural disaster costs, FCPA provision and effects of the agreement with the U.S. Departments of Veterans Affairs and Justice (VA agreement); 2018 excluding benefits of the U.S. tax reform, gains from divestitures of Care Coordination activities, contributions to the campaigns in the U.S. opposing state ballot initiatives and FCPA provision
Fresenius Kabi
Fresenius Kabi offers intravenously administered generic drugs, clinical nutrition and infusion therapies for seriously and chronically ill patients in the hospital and outpatient environments. The company is also a leading supplier of medical devices and transfusion technology products. In the biosimilars business, we are developing products with a focus on oncology and autoimmune diseases.

- 8% organic sales growth and 14% EBIT1 growth in constant currency (excl. biosimilars expenses) in Q3
- Sales outlook confirmed and strengthened: top end of 4% to 7% organic sales growth expected
- EBIT outlook raised: 1% to 3%5 EBIT growth in constant currency expected (~9% to 11%6 excl. biosimilars expenses)
Sales increased by 2% (increased by 7% in constant currency) to €4,857 million (Q1-3/17: €4,764 million). Organic sales growth was 7%. Strong negative currency translation effects (-5%) were mainly related to the devaluation of the U.S. dollar, the Brazilian real and the Argentinian peso against the euro. In Q3/18, sales increased by 6% (8% in constant currency) to €1,650 million (Q3/17: €1,562 million). Organic sales growth was 8%.
Sales in Europe grew by 1% (organic growth: 3%) to €1,658 million (Q1-3/17: €1,635 million). In Q3/18, sales were unchanged (organic growth: 1%) at €538 million.
1 Before special items
2 Before expenses for the further development of the biosimilars business: Q3/18: 14%; Q1-3/18: 11%
3 Net income attributable to shareholders of Fresenius SE & Co. KGaA
4 Before expenses for the further development of the biosimilars business: Q3/18: 31%; Q1-3/18: 22%
5 FY/17 base: €1,177 million; before special items, including expenditures for the further development of the biosimilars business (€60 million in FY/17 and ~€160 million in FY/18)
6 FY/17 base: €1,237 million; before special items, excluding expenditures for the further development of the biosimilars business (€60 million in FY/17 and ~€160 million in FY/18)
For a detailed overview of special items please see the reconciliation tables on pages 19-20 in the PDF document.
Sales in North America increased by 1% (organic growth: 8%) to €1,760 million (Q1-3/17: €1,736 million). In Q3/18, sales increased by 13% (organic growth: 12%) to €620 million (Q3/17: €549 million).
Sales in Asia-Pacific increased by 8% (organic growth: 12%) to €964 million (Q1-3/17: €894 million). In Q3/18, sales increased by 8% (organic growth: 9%) to €337 million (Q3/17: €312 million). Sales in Latin America/Africa decreased by 5% (organic growth: 11%) to €475 million (Q1-3/17: €499 million). In Q3/18, sales decreased by 5% (organic growth increased by 13%) to €155 million (Q3/17: €163 million).
EBIT1 decreased by 6% (increased by 1% in constant currency) to €854 million (Q1-3/17: €905 million) with an EBIT margin1 of 17.6% (Q1-3/17: 19.0%). In Q3/18, EBIT1 increased by 5% (5% in constant currency) to €297 million (Q3/17: €283 million) with an EBIT margin1 of 18.0% (Q3/17: 18.1%).
EBIT1 before expenses for the further development of the biosimilars business increased by 5% (11% in constant currency) to €967 million (Q1-3/17: €919 million) with an EBIT margin1 of 19.9% (Q1-3/17: 19.3%). In Q3/18, EBIT1 before expenses for the further development of the biosimilars business increased by 14% (14% in constant currency) to €338 million (Q3/17: €297 million) with an EBIT margin1 of 20.5% (Q3/17: 19.0%).
Net income1,2 increased by 2% (9% in constant currency) to €554 million (Q1-3/17: €544 million). In Q3/18, net income1,2 increased by 21% (21% in constant currency) to €199 million (Q3/17: €165 million).
Operating cash flow increased by 28% to €820 million (Q1-3/17: €640 million). The cash flow margin grew to 16.9% (Q1-3/17: 13.4%). In Q3/18, operating cash flow increased by 49% to €366 million (Q3/17: €245 million) with a cash flow margin of 22.2% (Q3/2017: 15.7%) mainly driven by a strong operational performance and working capital improvements.
1 Before special items
2 Net income attributable to shareholders of Fresenius SE & Co. KGaA
For a detailed overview of special items please see the reconciliation tables on pages 19-20 of the PDF document.
Based on the strong development in Q3/18 Fresenius Kabi confirms and strengthens its organic sales growth guidance of 4% to 7% and now expects to reach the top end of this range.
Fresenius Kabi has increased its FY/18 EBIT outlook and now expects 1% to 3%1 growth in constant currency (previously: -2% to +1%1). The increase is driven by a strong development across all product lines and regions with North America standing out. FY/18 EBIT excluding expenditures for the further development of the biosimilars business is now expected to grow by ~9% to 11%2 in constant currency (previously: ~6% to 9%2).
1 2017 base: €1,177 million; before special items, including expenditures for the further development of the biosimilars business (€60 million in FY/17 and ~€160 million in FY/18)
2 2017 base: €1,237 million; before special items, excluding expenditures for the further development of the biosimilars business (€60 million in FY/17 and ~€160 million in FY/18)
For a detailed overview of special items please see the reconciliation tables on pages 19-20 of the PDF document.
Fresenius Helios
Fresenius Helios is Europe's leading private hospital operator. The company comprises Helios Germany and Helios Spain (Quirónsalud). Helios Germany operates 87 hospitals, 89 outpatient centers and treats approximately 5.2 million patients annually. Quirónsalud operates 46 hospitals, 56 outpatient centers and around 300 occupational risk prevention centers, and treats approximately 11.6 million patients annually.

- 2% organic sales growth in Q3
- Preparatory initiatives for expected regulatory requirements and decline in admissions impact financial performance of Helios Germany
- Helios Spain with steady yet dynamic growth
- 2018 sales outlook confirmed and narrowed, EBIT outlook adjusted: 0% to 2% (previously: 5% to 8%)
As of July 1, 2018 Fresenius Helios transferred its German post-acute care business to Fresenius Vamed and adjusted its outlook accordingly. For a like-for-like comparison, we also provide sales and EBIT growth rates adjusted for the effects of this transaction.
Fresenius Helios increased sales by 5% (7%1) to €6,762 million (Q1-3/17: €6,422 million). Organic sales growth was 3%. In Q3/18, sales decreased by 4% (increased by 2%1; organic growth: 2%) to €2,088 million (Q3/17: €2,166 million).
Sales of Helios Germany decreased by 1% (grew 2%1; organic growth: 2%) to €4,531 million (Q1-3/17: €4,562 million). In Q3/18, sales decreased by 7% (0%1; organic growth: 0%) to €1,410 million (Q3/17: €1,524 million). Sales are impacted by a decline in admissions, inter alia due to a trend towards outpatient treatments. To counter this trend, Helios Germany is expanding outpatient services offerings in a separate division. Helios Spain increased sales by 20% (organic growth: 5%) to €2,231 million (Q1-3/17: €1,860 million), mainly due to the additional month of consolidation compared to the prior-year period (Quirónsalud is consolidated since February 1, 2017). In Q3/18 Helios Spain increased sales by 6% (organic growth: 5%) to €678 million (Q3/17: €642 million).
1 Adjusted for German post-acute care business transferred to Fresenius Vamed
2 Net income attributable to shareholders of Fresenius SE & Co. KGaA
Fresenius Helios grew EBIT by 1% (3%1) to €775 million (Q1-3/17: €769 million) with a margin of 11.5% (Q1-3/17: 12.0%). In Q3/18, EBIT decreased by 12% (-6%1) to €204 million (Q3/17: €232 million) with a margin of 9.8% (Q3/17: 10.7%).
EBIT of Helios Germany decreased by 11% (-8%1) to €488 million (Q1-3/17: €549 million) with a margin of 10.8% (Q1-3/17: 12.0%). In Q3/18, EBIT decreased by 25% (-17%1) to €143 million (Q3/17: €190 million) with a margin of 10.1% (Q3/17: 12.5%). Given a significant fixed cost base, top line performance impacs EBIT over-proportionately. Additionally, EBIT development of Helios Germany is negatively affected by catalogue effects, preparatory initiatives for expected regulatory requirements (i.e. clustering) as well as a lack of privatization opportunities in the German market.
EBIT of Helios Spain increased by 30% to €286 million (Q1-3/17: €220 million), mainly due to the strong operating performance and the additional month of consolidation compared to the prior-year period, with a margin of 12.8% (Q1-3/17: 11.8%). In Q3/18, from a moderate base, EBIT increased by 40% to €59 million (Q3/17: €42 million) with a margin of 8.7% (Q3/17: 6.5%).
Net income2 of Fresenius Helios decreased by 2% to €516 million (Q1-3/17: €526 million). In Q3/18, net income2 decreased by 16% to €128 million (Q3/17: €153 million).
Operating cash flow was €387 million (Q1-3/17: €560 million) with a margin of 5.7% (Q1-3/17: 8.7%).
Fresenius Helios confirmed and narrowed its FY/18 organic sales growth outlook, and now projects growth at the low end of the original 3% to 6% range. Based on the Q3/18 business development in Germany, Fresenius Helios adjusts its FY/18 EBIT outlook and now expects 0% to 2% growth (previously: 5% to 8%).
1 Adjusted for German post-acute care business transferred to Fresenius Vamed
2 Net income attributable to shareholders of Fresenius SE & Co. KGaA
Fresenius Vamed
Fresenius Vamed manages projects and provides services for hospitals and other health care facilities worldwide and is a post-acute care provider in Central Europe. The portfolio ranges along the entire value chain: from project development, planning, and turnkey construction, via maintenance and technical management, to total operational management.

- Excellent organic sales growth of 30% in Q3/18
- Both service and project businesses contributed to strong growth in Q3/18
- FY/18 outlook confirmed
As of July 1, 2018 Fresenius Helios transferred the post-acute care business to Fresenius Vamed. Fresenius Vamed adjusted its outlook accordingly. For a like-for-like comparison, we also provide sales and EBIT growth rates adjusted for the effects of this transaction.
Sales increased by 32% (17%1; 33% in constant currency) to €991 million (Q1-3/17: €748 million). Organic sales growth was 14% with a strong momentum in both the project and service businesses as well as increased sales from services for Fresenius Helios. Sales of the project business increased by 17% to €352 million (Q1-3/17: €301 million). Sales in the service business grew by 43% (17%1) to €639 million (Q1-3/17: €447 million). In Q3/18, sales increased by 110% (32%1; organic growth: 24%) to €315 million (Q3/17: €150 million).
EBIT increased by 53% (6%1) to €49 million (Q1-3/17: €32 million) with a margin of 4.9% (Q1-3/17: 4.3%). In Q3/18, EBIT increased by 107% (7%1) to €31 million (Q3/17: €15 million) with a margin of 6.5% (Q3/17: 5.6%).
Net income2 increased by 57% to €33 million (Q1-3/17: €21 million). In Q3/18, net income2 increased by 120% to €22 million (Q1-3/17: €10 million).
Order intake decreased by 19% to €567 million (Q1-3/17: €697 million). As of September 30, 2018, order backlog was €2,315 million (December 31, 2017: €2,147 million).
Fresenius Vamed has confirmed its outlook for 2018 and expects organic sales growth in the range of 5% to 10% and EBIT growth of 32% to 37%.
1 Without German post-acute care business transferred from Fresenius Helios
2 Net income attributable to shareholders of VAMED AG
Conference Call
As part of the publication of the results for the third quarter / first nine month of 2018, a conference call will be held on October 30, 2018 at 2 p.m. CET (9 a.m. EDT). All investors are cordially invited to follow the conference call in a live broadcast over the Internet at www.fresenius.com/media-calendar. Following the call, a replay will be available on our website.
For additional information on the performance indicators used please refer to our website.
This release contains forward-looking statements that are subject to various risks and uncertainties. Future results could differ materially from those described in these forward-looking statements due to certain factors, e.g. changes in business, economic and competitive conditions, regulatory reforms, results of clinical trials, foreign exchange rate fluctuations, uncertainties in litigation or investigative proceedings, and the availability of financing. Fresenius does not undertake any responsibility to update the forward-looking statements in this release.
- Excellent performance of Fresenius Kabi across all regions and product categories
- Fresenius Medical Care’s sales and earnings growth below the Company’s expectations
- Preparatory initiatives for expected regulatory requirements and decline in admissions impact Helios Germany; Helios Spain with steady yet dynamic growth
- Strong momentum in both Vamed’s project and service businesses
Group guidance for 2018 confirmed and narrowed
As announced on October 16, 2018 Fresenius confirms and narrows its Group guidance1 for FY/18. This is mainly driven by an excellent development of Fresenius Kabi, which partially offset the lower than expected sales and earnings contributions of Fresenius Medical Care and Helios Germany. Group sales are expected to increase at the low end of the original 5% to 8%2 guidance range (in constant currency). Fresenius expects net income1,3,4 growth at the low end of the original 6% to 9% guidance range (in constant currency). Excluding expenditures for the further development of the biosimilars business, net income1,3,5 growth is projected at the low end of the original ~10% to 13% guidance range (in constant currency).
1 2018 before special items (excluding effects related to the Akorn and NxStage transactions, gains from divestitures of Care Coordination activities and increase of FCPA provision)
2 FY/17 base adjusted for IFRS 15 adoption (-€486 million) and divestitures of Care Coordination activities (-€558 million) at Fresenius Medical Care
3 Net income attributable to shareholders of Fresenius SE & Co. KGaA
4 FY/17 base: €1,804 million; FY/18 before special items; including contributions to the campaigns in the U.S. opposing state ballot initiatives at Fresenius Medical Care; including expenditures for further development of the biosimilars business at Fresenius Kabi (€43 million after tax in FY/17 and ~€120 million after tax in FY/18)
5 FY/17 base: €1,847 million; FY/18 before special items; including contributions to the campaigns in the U.S. opposing state ballot initiatives at Fresenius Medical Care; excluding expenditures for further development of the biosimilars business at Fresenius Kabi (€43 million after tax in FY/17 and ~€120 million after tax in FY/18)
If no timeframe is specified, information refers to Q1-3/18
Q3/18:
- Sales: €8.2 billion (+3%1, +4% in constant currency1)
- EBIT2: €1,112 million (+0%, +0% in constant currency)
- EBIT2 (excl. biosimilars business): €1,153 million (+3%, +2% in constant currency)
- Net income2,3: €445 million (+8%, +8% in constant currency)
- Net income2,3 (excl. biosimilars business): €474 million (+13%, +13% in constant currency)
Q1-3/18:
- Sales: €24.7 billion (+1%1, +5% in constant currency1)
- EBIT2: €3,311 million (-5%, -1% in constant currency)
- EBIT2 (excl. biosimilars business): €3,424 million (-3%, +2% in constant currency)
- Net income2,3: €1,367 million (+3%, +7% in constant currency)
- Net income2,3 (excl. biosimilars business): €1,449 million (+8%, +12% in constant currency)
1 Growth rates adjusted for IFRS 15 adoption and divestitures of Care Coordination activities (Q3/17 base: €7,927 million; Q1-3/17 base: €24,551 million)
2 Before special items (before expenses related to the Akorn transaction, gains from divestitures of Care Coordination activities and increase of FCPA provision); growth rates: 2017 base adjusted for divestitures of Care Coordination activities
3 Net income attributable to shareholders of Fresenius SE & Co. KGaA
For a detailed overview of special items please see the reconciliation tables on pages 19-20 in the PDF document.
5% sales growth in constant currency1
Group sales increased by 1%1 (5%1 in constant currency) to €24,695 million (Q1-3/17: €25,191 million). Organic sales growth was 4%. Acquisitions/divestitures contributed net 1% to growth. Negative currency translation effects of 4% were mainly driven by the devaluation of the U.S. dollar and the Chinese yuan against the euro. In Q3/18, Group sales increased by 3%1 (4%1 in constant currency) to €8,192 million (Q3/17: €8,297 million). Organic sales growth was 4%. Acquisitions/divestitures had no net contribution to growth. Currency translation effects reduced sales by 1%.
1 Growth rates adjusted for IFRS 15 adoption and divestitures of Care Coordination activities at Fresenius Medical Care (Q1-3/17 base: €24,551 million; Q3/17 base: €7,927 million)
Group sales by region:

7% net income1,2,3 growth in constant currency
Group EBITDA2 decreased by 4%3 (0%3 in constant currency) to €4,375 million (Q1-3/17: €4,579 million). Group EBIT2 decreased by 5%3 (-1%3 in constant currency) to €3,311 million (Q1-3/17: €3,522 million). The EBIT margin2 was 13.4% (Q1 3/17: 14.0%). Group EBIT2 before expenses for the further development of the biosimilars business decreased by 3%3 (increased 2%3 in constant currency) to €3,424 million. In the prior-year period the compensation for treatments of U.S. war veterans (“VA agreement”) contributed €88 million as a one-time effect. Group EBIT2 excluding the VA agreement and expenses for the further development of the biosimilars business increased by 4% in constant currency.
In Q3/18, Group EBIT3 was broadly stable year-over-year3 (broadly stable3 in constant currency) at €1,112 million (Q3/17: €1,129 million), with an EBIT margin2 of 13.6% (Q3/17: 13.6%). Group EBIT2 excluding the prior-year VA agreement and expenses for the further development of the biosimilars business increased by 2%3 in constant currency.
Group net interest2 was -€436 million (Q1-3/17: -€484 million). The decrease is mainly driven by currency effects as well as refinancing activities and the divestitures of Care Coordination activities.
The decrease of the Group tax rate before special items to 22.0% (Q1-3/17: 28.1%) was mainly due to the U.S. tax reform and some one time effects in Q3 at Fresenius Medical Care and Fresenius Kabi. In Q3/18, the Group tax rate2 was 21.4% (Q3/17: 27.4%).
Noncontrolling interest2 was €876 million (Q1-3/17: €854 million), of which 95% was attributable to the noncontrolling interest in Fresenius Medical Care.
1 Net income attributable to shareholders of Fresenius SE & Co. KGaA
2 Before special items
3 Base 2017 base adjusted for divestitures of Care Coordination activities
For a detailed overview of special items please see the reconciliation tables on pages 19-20 in the PDF document.
Group net income1,2 increased by 3%3 (7%3 in constant currency) to €1,367 million (Q1 3/17: €1,329 million). Earnings per share1,2 increased by 3%3 (7%3 in constant currency) to €2.46 (Q1-3/17: €2.40). In Q3/18, Group net income1,2 increased by 8%3 (8%3 in constant currency) to €445 million (Q3/17: €413 million). Earnings per share1,2 increased by 7%3 (7%3 in constant currency) to €0.80 (Q3/17: €0.75).
Group net income1,2,4 before expenses for the further development of the biosimilars business increased by 8%3 (12%3 in constant currency) to €1,449 million (Q1-3/17: €1,339 million). Earnings per share1,2,4 increased by 8%3 (12%3 in constant currency) to €2.61 (Q1-3/17: €2.42). In Q3/18, Group net income1,2,4 increased by 13%3 (13%3 in constant currency) to €474 million (Q3/17: €423 million). Earnings per share1,2,4 increased by 12%3 (12%3 in constant currency) to €0.85 (Q3/17: €0.77).
Group net income2,5 after special items increased by 16% (by 21% in constant currency) to €1,511 million (Q1-3/17: €1,303 million), mainly due to gains related to divestitures in Care Cordination activities at Fresenius Medical Care. Earnings per share2,5 increased by 16% (21% in constant currency) to €2.72 (Q1-3/17: €2.35). In Q3/18, Group net income2,5 increased by 6% (4% in constant currency) to €419 million (Q3/17: €396 million). Earnings per share2,5 increased by 6% (4% in constant currency) to €0.75 (Q3/17: €0.71).
1 Before special items
2 Net income attributable to shareholders of Fresenius SE & Co. KGaA
3 2017 base adjusted for divestitures of Care Coordination activities
4 Before expenses for the further development of the biosimilars business
5 After special items
For a detailed overview of special items please see the reconciliation tables on pages 19-20 in the PDF document.
Continued investment in growth
Spending on property, plant and equipment was €1,370 million (Q1-3/17: €1,137 million), primarily for the modernization and expansion of dialysis clinics, production facilities as well as hospitals and day clinics. This corresponds to 5.5% of sales.
Total acquisition spending was €876 million (Q1-3/17: €6,662 million). The prior-year period included the acquisition of Quirónsalud.
Cash flow development
Group operating cash flow decreased by 15% to €2,405 million (Q1-3/17: €2,821 million) with a margin of 9.7% (Q1-3/2017: 11.2%). The decrease is mainly due to two effects at Fresenius Medical Care in North America: Receipt of a ~€200 million payment under the VA agreement in the prior-year period as well as increased accounts receivable related to the addition of calcimimetics into the Medicare ESRD payment bundle. In addition, negative currency translation effects weighed on the cash flow development in Q1-3/18. Operating cash flow in Q3/18 increased by 1% to €1,149 million (Q3/17: €1,138 million), with a margin of 14.0% (Q3/17: 13.7%).
Given the effects described above and growing investments, free cash flow before acquisitions and dividends decreased to €1,049 million (Q1-3/17: €1,705 million). Free cash flow after acquisitions and dividends was €1,172 million (Q1-3/17: -€5,233 million).
Solid balance sheet structure
The Group’s total assets increased by 5% (4% in constant currency) to €55,723 million (Dec. 31, 2017: €53,133 million). Current assets grew by 16% (16% in constant currency) to €14,593 million (Dec. 31, 2017: €12,604 million). Non-current assets increased by 1% (broadly stable in constant currency) to €41,130 million (Dec. 31, 2017: € 40,529 million).
Total shareholders’ equity increased by 10% (9% in constant currency) to €23,998 million (Dec. 31, 2017: €21,720 million). The equity ratio increased to 43.1% (Dec. 31, 2017: 40.9%).
Group debt was broadly stable unchanged (decreased by 1% in constant currency) at €18,961 million (Dec. 31, 2017: € 19,042 million). Group net debt decreased by 5% (-6% in constant currency) to € 16,505 million (Dec. 31, 2017: € 17,406 million) mainly due to the proceeds from divestitures of Care Coordination activities.
As of September 30, 2018, the net debt/EBITDA ratio was 2.751,2 (December 31, 2017: 2.841,2). Excluding the proceeds from divestitures of Care Coordination activities the net debt/EBITDA ratio was 2.961,2. At year-end 2018, Fresenius now expects the FY/18 net debt/EBITDA1,2 ratio to be on a comparable level to year-end 2017.
1 At LTM average exchange rates for both net debt and EBITDA; pro forma closed acquisitions/divestitures, excluding Akorn and NxStage transactions
2 Before special items
Business Segments
Fresenius Medical Care
Fresenius Medical Care is the world's largest provider of products and services for individuals with renal diseases. As of September 30, 2018, Fresenius Medical Care was treating 329,085 patients in 3,872 dialysis clinics. Along with its core business, the company provides related medical services in the field of Care Coordination.

- 3% comparable1 sales growth in constant currency in Q3
- -2% adjusted4,6 net income decrease in constant currency in Q3
- Outlook for FY/18 adjusted
Sales decreased by 8% (-2% in constant currency) to €12,247 million (Q1-3/17: €13,355 million). Organic sales growth was 3%. Currency translation effects reduced sales by 7%. The adoption of IFRS 15 reduced sales by 3%. Q1-3/17 base additionally adjusted for divestitures of Care Coordination activities, sales decreased by 4% (increased by 3% in constant currency).
1 Adjusted for IFRS 15 implementation; base adjusted for divested Care Coordination activities
2 Excluding VA agreement Q3: 3%; Q1-3: 4%
3 Excluding gains from divestitures of Care Coordination activities, increase of FCPA provision, ballot initiatives, divested Care Coordination activities in Q3/2017; including Natural disaster costs and VA agreement
4 Net income attributable to shareholders of Fresenius Medical Care AG & Co. KGaA
5 Consistent with guidance, i.e. excluding gains from divestitures of Care Coordination activities, increase of FCPA provision, ballot initiatives, , divested Care Coordination activities; including Natural disaster costs, the effect of the U.S. Tax Reform and including VA agreement
6 Consistent with guidance, i.e. excluding gains from divestitures of Care Coordination activities, the effect of the U.S. Tax Reform, VA agreement, FCPA provision, ballot initiatives, divested Care Coordination activities, Natural disaster costs
In Q3/18, sales decreased by 6% (-6% in constant currency) to €4,058 million (Q3/17: €4,336 million). Organic sales growth was 3%. The adoption of IFRS 15 reduced sales by 3%. Q3/17 base additionally adjusted for divestitures of Care Coordination activities, sales in Q3/18 increased by 2% (increased by 3% in constant currency).
Health Care services sales (dialysis services and care coordination) decreased by 4%1 (increased by 3%1 in constant currency) to €9,852 million (Q1-3/17: €10,950 million). With €2,395 million (Q1-3/17: €2,405 million), Health Care product sales were on prior-year’s level (increased by 5% in constant currency).
In North America, sales decreased by 5%1 (increased by 1%1 in constant currency) to €8,589 million (Q1-3/17: €9,715 million). Health Care services sales decreased by 6%1 (increased by 1%1 in constant currency) to €7,978 million (Q1-3/17: €9,086 million). Excluding the 2017 effect from the VA Agreement (€96 million), Health Care services sales increased by 2%1 in constant currency. Health Care product sales decreased by 3% (increased by 4% in constant currency) to €610 million (Q1-3/17: €629 million).
Sales outside North America increased by 1% (7% in constant currency) to €3,648 million (Q1-3/17: €3,628 million).
Health Care services sales increased by 1% (9% in constant currency) to €1,873 million (Q1-3/17: €1,864 million). Health Care product sales increased by 1% (5% in constant currency) to €1,774 million (Q1-3/17: €1,764 million).
Fresenius Medical Care’s EBIT increased by 32% (39% in constant currency) to €2,425 million (Q1-3/17: €1,843 million), driven by the divestitures of Care Coordination activities. The EBIT margin increased to 19.8% (Q1-3/17: 13.8%). EBIT on a comparable basis decreased by 2% in constant currency and EBIT margin was 13.9% (Q1-3/17: 14.3%).
In Q3/18, EBIT decreased by 13% (-20% in constant currency) to €527 million (Q3/17: €609 million). The EBIT margin decreased to 13.0% (Q3/17: 14.0%). EBIT on a comparable basis increased by 5% (increased by 4% in constant currency) and EBIT margin increased to 15.1% (Q3/17: 14.8%).
1 Growth rate adjusted for IFRS 15 implementation and divested Care Coordination activities
Net income1 increased by 76% (86% in constant currency) to €1,557 million (Q1-3/17: €886 million). Adjusted net income1 growth was 4% in constant currency. Net income1 growth on a comparable basis was 16% in constant currency.
In Q3/18, net income1 decreased by 8% (-17% in constant currency) to €285 million (Q3/17: €309 million). Adjusted net income1 growth was -2% in constant currency. Net income1 growth on a comparable basis was 19% in constant currency.
Operating cash flow was €1,220 million (Q1-3/17: €1,664 million). The cash flow margin was 10.0% (Q1-3/17: 12.5%). The decrease is mainly due to two effects in North America: Receipt of a ~€200 million payment under the VA agreement in the prior-year period as well as increased accounts receivable related to the addition of calcimimetics into the Medicare ESRD payment bundle. In Q3/18, operating cash flow was €609 million (Q3/17: €612 million), mainly driven by higher tax payments and discretionary contributions to pension plan assets in the U.S., almost fully offset by decreases in accounts receivable. The cash flow margin was 15.0% (Q3/17: 14.1%).
Fresenius Medical Care revised its outlook for FY/18 as the business development in Q3/18 was below the company’s expectations. Fresenius Medical Care now expects sales growth of 2% to 3%2 in constant currency (previously: 5% to 7%2). On a comparable basis3, Fresenius Medical Care now expects FY/18 net income1 to increase by 11% to 12%3 in constant currency (previously: 13% to 15%3). On an adjusted basis4, Fresenius Medical Care now expects FY/18 net income1 to increase by 2% to 3%4 in constant currency (previously: 7% to 9%4).
For further information, please see Fresenius Medical Care’s Investor News at www.freseniusmedicalcare.com.
1 Net income attributable to shareholders of Fresenius Medical Care AG & Co. KGaA
2 2017 base: €16,739 million (adjusted for IFRS 15 adoption (-€486 million) and divestitures of Care Coordination activities (-€558 million))
3 2017 base: €1,242 million, excluding H2/17 net income of divestited Care Coordination activities (-€38 million); 2018 including benefits of the U.S. tax reform but excluding gains from divestitures of Care Coordination activities, contributions to the campaigns in the U.S. opposing state ballot initiatives at Fresenius Medical Care and FCPA provision
4 2017 base: €1,162 million, excluding H2/17 net income of divested Care Coordination activities (-€38 million), the effect of the U.S. tax reform, natural disaster costs, FCPA provision and effects of the agreement with the U.S. Departments of Veterans Affairs and Justice (VA agreement); 2018 excluding benefits of the U.S. tax reform, gains from divestitures of Care Coordination activities, contributions to the campaigns in the U.S. opposing state ballot initiatives and FCPA provision
Fresenius Kabi
Fresenius Kabi offers intravenously administered generic drugs, clinical nutrition and infusion therapies for seriously and chronically ill patients in the hospital and outpatient environments. The company is also a leading supplier of medical devices and transfusion technology products. In the biosimilars business, we are developing products with a focus on oncology and autoimmune diseases.

- 8% organic sales growth and 14% EBIT1 growth in constant currency (excl. biosimilars expenses) in Q3
- Sales outlook confirmed and strengthened: top end of 4% to 7% organic sales growth expected
- EBIT outlook raised: 1% to 3%5 EBIT growth in constant currency expected (~9% to 11%6 excl. biosimilars expenses)
Sales increased by 2% (increased by 7% in constant currency) to €4,857 million (Q1-3/17: €4,764 million). Organic sales growth was 7%. Strong negative currency translation effects (-5%) were mainly related to the devaluation of the U.S. dollar, the Brazilian real and the Argentinian peso against the euro. In Q3/18, sales increased by 6% (8% in constant currency) to €1,650 million (Q3/17: €1,562 million). Organic sales growth was 8%.
Sales in Europe grew by 1% (organic growth: 3%) to €1,658 million (Q1-3/17: €1,635 million). In Q3/18, sales were unchanged (organic growth: 1%) at €538 million.
1 Before special items
2 Before expenses for the further development of the biosimilars business: Q3/18: 14%; Q1-3/18: 11%
3 Net income attributable to shareholders of Fresenius SE & Co. KGaA
4 Before expenses for the further development of the biosimilars business: Q3/18: 31%; Q1-3/18: 22%
5 FY/17 base: €1,177 million; before special items, including expenditures for the further development of the biosimilars business (€60 million in FY/17 and ~€160 million in FY/18)
6 FY/17 base: €1,237 million; before special items, excluding expenditures for the further development of the biosimilars business (€60 million in FY/17 and ~€160 million in FY/18)
For a detailed overview of special items please see the reconciliation tables on page 19 - 20 in the PDF document.
Sales in North America increased by 1% (organic growth: 8%) to €1,760 million (Q1-3/17: €1,736 million). In Q3/18, sales increased by 13% (organic growth: 12%) to €620 million (Q3/17: €549 million).
Sales in Asia-Pacific increased by 8% (organic growth: 12%) to €964 million (Q1-3/17: €894 million). In Q3/18, sales increased by 8% (organic growth: 9%) to €337 million (Q3/17: €312 million). Sales in Latin America/Africa decreased by 5% (organic growth: 11%) to €475 million (Q1-3/17: €499 million). In Q3/18, sales decreased by 5% (organic growth increased by 13%) to €155 million (Q3/17: €163 million).
EBIT1 decreased by 6% (increased by 1% in constant currency) to €854 million (Q1-3/17: €905 million) with an EBIT margin1 of 17.6% (Q1-3/17: 19.0%). In Q3/18, EBIT1 increased by 5% (5% in constant currency) to €297 million (Q3/17: €283 million) with an EBIT margin1 of 18.0% (Q3/17: 18.1%).
EBIT1 before expenses for the further development of the biosimilars business increased by 5% (11% in constant currency) to €967 million (Q1-3/17: €919 million) with an EBIT margin1 of 19.9% (Q1-3/17: 19.3%). In Q3/18, EBIT1 before expenses for the further development of the biosimilars business increased by 14% (14% in constant currency) to €338 million (Q3/17: €297 million) with an EBIT margin1 of 20.5% (Q3/17: 19.0%).
Net income1,2 increased by 2% (9% in constant currency) to €554 million (Q1-3/17: €544 million). In Q3/18, net income1,2 increased by 21% (21% in constant currency) to €199 million (Q3/17: €165 million).
Operating cash flow increased by 28% to €820 million (Q1-3/17: €640 million). The cash flow margin grew to 16.9% (Q1-3/17: 13.4%). In Q3/18, operating cash flow increased by 49% to €366 million (Q3/17: €245 million) with a cash flow margin of 22.2% (Q3/2017: 15.7%) mainly driven by a strong operational performance and working capital improvements.
1 Before special items
2 Net income attributable to shareholders of Fresenius SE & Co. KGaA
For a detailed overview of special items please see the reconciliation tables on page 19 - 20 of the PDF document.
Based on the strong development in Q3/18 Fresenius Kabi confirms and strengthens its organic sales growth guidance of 4% to 7% and now expects to reach the top end of this range.
Fresenius Kabi has increased its FY/18 EBIT outlook and now expects 1% to 3%1 growth in constant currency (previously: -2% to +1%1). The increase is driven by a strong development across all product lines and regions with North America standing out. FY/18 EBIT excluding expenditures for the further development of the biosimilars business is now expected to grow by ~9% to 11%2 in constant currency (previously: ~6% to 9%2).
1 2017 base: €1,177 million; before special items, including expenditures for the further development of the biosimilars business (€60 million in FY/17 and ~€160 million in FY/18)
2 2017 base: €1,237 million; before special items, excluding expenditures for the further development of the biosimilars business (€60 million in FY/17 and ~€160 million in FY/18)
For a detailed overview of special items please see the reconciliation tables on page 19 - 20 of the PDF document.
Fresenius Helios
Fresenius Helios is Europe's leading private hospital operator. The company comprises Helios Germany and Helios Spain (Quirónsalud). Helios Germany operates 87 hospitals, 89 outpatient centers and treats approximately 5.2 million patients annually. Quirónsalud operates 46 hospitals, 56 outpatient centers and around 300 occupational risk prevention centers, and treats approximately 11.6 million patients annually.

- 2% organic sales growth in Q3
- Preparatory initiatives for expected regulatory requirements and decline in admissions impact financial performance of Helios Germany
- Helios Spain with steady yet dynamic growth
- 2018 sales outlook confirmed and narrowed, EBIT outlook adjusted: 0% to 2% (previously: 5% to 8%)
As of July 1, 2018 Fresenius Helios transferred its German post-acute care business to Fresenius Vamed and adjusted its outlook accordingly. For a like-for-like comparison, we also provide sales and EBIT growth rates adjusted for the effects of this transaction.
Fresenius Helios increased sales by 5% (7%1) to €6,762 million (Q1-3/17: €6,422 million). Organic sales growth was 3%. In Q3/18, sales decreased by 4% (increased by 2%1; organic growth: 2%) to €2,088 million (Q3/17: €2,166 million).
Sales of Helios Germany decreased by 1% (grew 2%1; organic growth: 2%) to €4,531 million (Q1-3/17: €4,562 million). In Q3/18, sales decreased by 7% (0%1; organic growth: 0%) to €1,410 million (Q3/17: €1,524 million). Sales are impacted by a decline in admissions, inter alia due to a trend towards outpatient treatments. To counter this trend, Helios Germany is expanding outpatient services offerings in a separate division. Helios Spain increased sales by 20% (organic growth: 5%) to €2,231 million (Q1-3/17: €1,860 million), mainly due to the additional month of consolidation compared to the prior-year period (Quirónsalud is consolidated since February 1, 2017). In Q3/18 Helios Spain increased sales by 6% (organic growth: 5%) to €678 million (Q3/17: €642 million).
1 Adjusted for German post-acute care business transferred to Fresenius Vamed
2 Net income attributable to shareholders of Fresenius SE & Co. KGaA
Fresenius Helios grew EBIT by 1% (3%1) to €775 million (Q1-3/17: €769 million) with a margin of 11.5% (Q1-3/17: 12.0%). In Q3/18, EBIT decreased by 12% (-6%1) to €204 million (Q3/17: €232 million) with a margin of 9.8% (Q3/17: 10.7%).
EBIT of Helios Germany decreased by 11% (-8%1) to €488 million (Q1-3/17: €549 million) with a margin of 10.8% (Q1-3/17: 12.0%). In Q3/18, EBIT decreased by 25% (-17%1) to €143 million (Q3/17: €190 million) with a margin of 10.1% (Q3/17: 12.5%). Given a significant fixed cost base, top line performance impacs EBIT over-proportionately. Additionally, EBIT development of Helios Germany is negatively affected by catalogue effects, preparatory initiatives for expected regulatory requirements (i.e. clustering) as well as a lack of privatization opportunities in the German market.
EBIT of Helios Spain increased by 30% to €286 million (Q1-3/17: €220 million), mainly due to the strong operating performance and the additional month of consolidation compared to the prior-year period, with a margin of 12.8% (Q1-3/17: 11.8%). In Q3/18, from a moderate base, EBIT increased by 40% to €59 million (Q3/17: €42 million) with a margin of 8.7% (Q3/17: 6.5%).
Net income2 of Fresenius Helios decreased by 2% to €516 million (Q1-3/17: €526 million). In Q3/18, net income2 decreased by 16% to €128 million (Q3/17: €153 million).
Operating cash flow was €387 million (Q1-3/17: €560 million) with a margin of 5.7% (Q1-3/17: 8.7%).
Fresenius Helios confirmed and narrowed its FY/18 organic sales growth outlook, and now projects growth at the low end of the original 3% to 6% range. Based on the Q3/18 business development in Germany, Fresenius Helios adjusts its FY/18 EBIT outlook and now expects 0% to 2% growth (previously: 5% to 8%).
1 Adjusted for German post-acute care business transferred to Fresenius Vamed
2 Net income attributable to shareholders of Fresenius SE & Co. KGaA
Fresenius Vamed
Fresenius Vamed manages projects and provides services for hospitals and other health care facilities worldwide and is a post-acute care provider in Central Europe. The portfolio ranges along the entire value chain: from project development, planning, and turnkey construction, via maintenance and technical management, to total operational management.

- Excellent organic sales growth of 30% in Q3/18
- Both service and project businesses contributed to strong growth in Q3/18
- FY/18 outlook confirmed
As of July 1, 2018 Fresenius Helios transferred the post-acute care business to Fresenius Vamed. Fresenius Vamed adjusted its outlook accordingly. For a like-for-like comparison, we also provide sales and EBIT growth rates adjusted for the effects of this transaction.
Sales increased by 32% (17%1; 33% in constant currency) to €991 million (Q1-3/17: €748 million). Organic sales growth was 14% with a strong momentum in both the project and service businesses as well as increased sales from services for Fresenius Helios. Sales of the project business increased by 17% to €352 million (Q1-3/17: €301 million). Sales in the service business grew by 43% (17%1) to €639 million (Q1-3/17: €447 million). In Q3/18, sales increased by 110% (32%1; organic growth: 24%) to €315 million (Q3/17: €150 million).
EBIT increased by 53% (6%1) to €49 million (Q1-3/17: €32 million) with a margin of 4.9% (Q1-3/17: 4.3%). In Q3/18, EBIT increased by 107% (7%1) to €31 million (Q3/17: €15 million) with a margin of 6.5% (Q3/17: 5.6%).
Net income2 increased by 57% to €33 million (Q1-3/17: €21 million). In Q3/18, net income2 increased by 120% to €22 million (Q1-3/17: €10 million).
Order intake decreased by 19% to €567 million (Q1-3/17: €697 million). As of September 30, 2018, order backlog was €2,315 million (December 31, 2017: €2,147 million).
Fresenius Vamed has confirmed its outlook for 2018 and expects organic sales growth in the range of 5% to 10% and EBIT growth of 32% to 37%.
1 Without German post-acute care business transferred from Fresenius Helios
2 Net income attributable to shareholders of VAMED AG
Conference Call
As part of the publication of the results for the third quarter / first nine months of 2018, a conference call will be held on October 30, 2018 at 2 p.m. CET (9 a.m. EDT). All investors are cordially invited to follow the conference call in a live broadcast over the Internet at www.fresenius.com/investors. Following the call, a replay will be available on our website.
For additional information on the performance indicators used please refer to our website www.fresenius.com/alternative-performance-measures.
This release contains forward-looking statements that are subject to various risks and uncertainties. Future results could differ materially from those described in these forward-looking statements due to certain factors, e.g. changes in business, economic and competitive conditions, regulatory reforms, results of clinical trials, foreign exchange rate fluctuations, uncertainties in litigation or investigative proceedings, and the availability of financing. Fresenius does not undertake any responsibility to update the forward-looking statements in this release.
Fresenius confirms and narrows its Group guidance1 for FY/18. Group sales are expected to increase at the low end of the original 5% to 8%2 guidance range (in constant currency). Fresenius expects net income3,4 growth at the low end of the original 6% to 9% guidance range (in constant currency). Excluding expenditures for the further development of the biosimilars business, net income3,5 growth is projected at the low end of the original ~10% to 13% guidance range (in constant currency). Narrowing the Group guidance ranges is due to updated expectations at Fresenius Medical Care, Fresenius Kabi and Fresenius Helios.
Fresenius Medical Care adjusts its outlook for FY/18 as the business development in Q3/18 was below the company’s expectations. Fresenius Medical Care now expects sales growth of 2% to 3%6 in constant currency (previously: 5% to 7%6). Whilst Fresenius Kabi confirms its guidance of 4% to 7% organic sales growth, it now expects to reach the top end of this range. Fresenius Kabi sees a strong development across all product lines and regions with North America standing out. Fresenius Helios confirms and narrows its FY/18 organic sales growth outlook, and now projects growth at the low end of the original 3% to 6% range. The business development in Germany in Q3/18 was below the company’s expectations mainly due to a decline in admissions and additional catalogue effects. In line with market development in Germany, Fresenius Helios sees a trend towards outpatient treatments leading to fewer admissions in its hospitals.
On a comparable basis8, Fresenius Medical Care now expects FY/18 net income7 to increase by 11% to 12%8 in constant currency (previously: 13% to 15%8). On an adjusted basis9, Fresenius Medical Care now expects FY/18 net income7 to increase by 2% to 3%9 in constant currency (previously: 7% to 9%9). Fresenius Kabi increases its FY/18 EBIT outlook and now expects 1% to 3%10 growth in constant currency (previously: -2% to +1%10). The increase is driven by a strong development across all product lines and regions with North America standing out. FY/18 EBIT excluding expenditures for the further development of the biosimilars business is now expected to grow by ~9% to 11%11 in constant currency (previously: ~6% to 9%11). Fresenius Helios adjusts its FY/18 EBIT outlook and now expects 0% to 2% growth (previously: 5% to 8%), driven by lower sales growth in Germany. Moreover, preparatory structural activities for anticipated regulatory requirements (e.g. clustering), as well as a lack of privatization opportunities in the German market continue to weigh on earnings growth.
Fresenius Vamed confirms its outlook for FY/18 and expects organic sales growth in the range of 5% to 10% and FY/18 EBIT growth of 32% to 37%. The integration of the inpatient post-acute care business acquired from Helios Germany is fully on track.
Q3/2018 preliminary financial results
In Q3/18, Fresenius Group sales increased by ~3%12 (~4%12 in constant currency) to ~€8.2 billion (Q3/2017: €8.297 billion). Group net income3 before special items13 increased by ~8% (~8% in constant currency) to ~€445 million (Q3/2017: €413 million). Fresenius Medical Care has increased the provision for the FCPA (Foreign Corrupt Practices Act) related charge by €75 million (not tax deductible). As in 2017, this charge is treated as a special item. Group net income3 before special items13 and before expenses for the further development of the biosimilars business increased by ~13% (~13% in constant currency) to ~€474 million (Q3/2017: €423 million).
Fresenius will publish its detailed Q3/18 and Q1-Q3/18 financial results on October 30, 2018.
----------------------------------------
1Excluding effects related to the Akorn and NxStage transactions, gains from divestitures of Care Coordination activities and FCPA provision
22017 base adjusted for IFRS 15 adoption (deduction of €486 million at Fresenius Medical Care) and divestitures of Care Coordination activities (deduction of €558 million at Fresenius Medical Care)
3Net income attributable to shareholders of Fresenius SE & Co. KGaA
42017 base: €1,804 million; 2018 before special items (i.e. expenses related to the Akorn and NxStage transactions, gains from divestitures of Care Coordination activities and FCPA provision; including contributions to the campaigns in the U.S. opposing state ballot initiatives at Fresenius Medical Care and including expenditures for further development of the biosimilars business at Fresenius Kabi (€43 million after tax in FY/17 and ~€120 million after tax in FY/18))
52017 base: €1,847 million; 2018 before special items (i.e. expenses related to the Akorn and NxStage transactions, gains from divestitures of Care Coordination activities and FCPA provision; including contributions to the campaigns in the U.S. opposing state ballot initiatives at Fresenius Medical Care excluding the expenditures for further development of the biosimilars business at Fresenius Kabi (€43 million after tax in FY/17 and ~€120 million after tax in FY/18))
62017 base: €16,739 million (adjusted for IFRS 15 adoption (-€486 million) and divestitures of Care Coordination activities (-€558 million))
7Net income attributable to shareholders of Fresenius Medical Care AG & Co. KGaA
82017 base: €1,242 million, excluding H2/17 net income of divestitures of Care Coordination activities (-€38 million); 2018 including benefits of the U.S. tax reform but excluding gains from divestitures of Care Coordination activities, contributions to the campaigns in the U.S. opposing state ballot initiatives at Fresenius Medical Care and FCPA provision
92017 base: €1,162 million, excluding divestitures of Care Coordination activities (-€38 million), the effect of the U.S. tax reform, natural disaster costs, FCPA provision and effects of the agreement with the U.S. Departments of Veterans Affairs and Justice (VA agreement)
102017 base: €1,177 million; 2017 & 2018 before special items, including expenditures for the further development of the biosimilars business (€60 million in FY/17 and ~€160 million in FY/18)
112017 base: €1,237 million; 2017 & 2018 before special items, excluding expenditures for the further development of the biosimilars business (€60 million in FY/17 and ~€160 million in FY/18)
12Growth rates adjusted for IFRS 15 adoption and divestitures of Care Coordination activities (Q3/17 base: €7,927 million)
13Before expenses related to the Akorn transaction, gains from divestitures of Care Coordination activities and FCPA provision, but including contributions to the campaigns in the U.S. opposing state ballot initiatives at Fresenius Medical Care
This release contains forward-looking statements that are subject to various risks and uncertainties. Future results could differ materially from those described in these forward-looking statements due to certain factors, e.g. changes in business, economic and competitive conditions, regulatory reforms, results of clinical trials, foreign exchange rate fluctuations, uncertainties in litigation or investigative proceedings, and the availability of financing. Fresenius does not undertake any responsibility to update the forward-looking statements in this release.
In the lawsuit by Akorn, Inc. against Fresenius for the consummation of the April 2017 merger agreement the Court of Chancery in the U.S. state of Delaware today ruled in favor of Fresenius. The judgment is not yet final.
Fresenius terminated the merger agreement due to Akorn’s failure to fulfill several closing conditions. An independent investigation initiated by Fresenius had revealed, among other things, material breaches of FDA data integrity requirements relating to Akorn's operations. Akorn responded by suing in the Court of Chancery in Delaware for the consummation of the agreement.
This release contains forward-looking statements that are subject to various risks and uncertainties. Future results could differ materially from those described in these forward-looking statements due to certain factors, e.g. changes in business, economic and competitive conditions, regulatory reforms, results of clinical trials, foreign exchange rate fluctuations, uncertainties in litigation or investigative proceedings, and the availability of financing. Fresenius does not undertake any responsibility to update the forward-looking statements in this release.
If no timeframe is specified, information refers to H1/2018
Q2/2018:
- Sales: €8.4 billion (-2%, +5% in constant currency1)
- EBIT2: €1,145 million (-3%, +2% in constant currency)
- EBIT2 (excl. biosimilars business): €1,182 million (0%, +5% in constant currency)
- Net income2,3: €472 million (+3%, +7% in constant currency)
- Net income2,3 (excl. biosimilars business): €499 million (+9%, +12% in constant currency)
H1/2018:
- Sales: €16.5 billion (-2%, +6% in constant currency1)
- EBIT2: €2,199 million (-8%, -2% in constant currency)
- EBIT2: (excl. biosimilars business) €2,271 million (-5%, +1% in constant currency)
- Net income2,3: €922 million (+1%, +7% in constant currency)
- Net income2,3 (excl. biosimilars business): €975 million (+6%, +12% in constant currency)
1 Growth rate adjusted for IFRS 15 adoption (Q2/17 base: €8,401 million; H1/2017 base: €16,624 million)2 Before special items (i.e., expenses related to the Akorn transaction, gains related to divestitures of Care Coordination activities)3 Net income attributable to shareholders of Fresenius SE & Co. KGaAFor a detailed overview of special items please see the reconciliation tables on pages 19 - 20 in the PDF document.
Stephan Sturm, CEO of Fresenius, said: “The first half of 2018 was a very good one for Fresenius. After our successful start, we have delivered a strong second quarter with continued healthy growth in sales and earnings. All four business segments contributed to this, and all four business segments display outstanding prospects for the future. For Fresenius Kabi, we are even a bit more optimistic than before. We are therefore fully on track to achieve our ambitious growth targets as we steer toward another excellent year for Fresenius.”
Group guidance1 for 2018 confirmed
Fresenius confirms its guidance for 2018. Group sales are expected to increase by 5% to 8%2 in constant currency. Net income3,4 is expected to grow by 6% to 9% in constant currency. Excluding expenditures for the further development of the biosimilars business, net income3,5 is expected to grow by ~10% to 13% in constant currency.
Fresenius expects to further reduce its net debt/EBITDA ratio6 by year-end 2018.
6% sales growth in constant currency7
Group sales decreased by 1%7 (increased by 6%7 in constant currency) to €16,503 million (H1/2017: €16,894 million). Organic sales growth was 4%. Acquisitions/divestitures contributed net 2% to growth. Negative currency translation effects (7%) were mainly driven by the devaluation of the U.S. dollar and the Chinese yuan against the euro. In Q2/2018, Group sales were nearly unchanged7 (increased 5%7 in constant currency) at €8,382 million (Q2/2017: €8,532 million). Organic sales growth was 4%. Acquisitions/divestitures contributed net 1% to growth.
1 Excluding expenses related to the Akorn and NxStage transactions and gains from divestitures of Care Coordination activities 2 2017 base adjusted for IFRS 15 adoption (deduction of €486 million at Fresenius Medical Care) and divestitures of Care Coordination activities (deduction of €558 million at Fresenius Medical Care) 3 Net income attributable to shareholders of Fresenius SE & Co. KGaA4 2017 base: €1,804 million; 2018 before special items; including expenditures for further development of biosimilars business (€43 million after tax in FY/17 and ~€120 million after tax in FY/18)5 2017 base: €1,847 million; 2018 before special items6 Calculated at expected annual average exchange rates for both net debt and EBITDA; excluding effects of the Akorn and NxStage transactions and gains from divestitures of Care Coordination activities; excluding further potential acquisitions; at current IFRS rules7 Growth rates adjusted for IFRS 15 adoption (H1/17 base: €16,624 million; Q2/17 base: €8,401 million)
Group sales by region:


7% net income1,2 growth in constant currency
Group EBITDA2 decreased by 6% (0% in constant currency) to €2,912 million (H1/2017: €3,098 million). Group EBIT2 decreased by 8% (-2% in constant currency) to €2,199 million (H1/2017: €2,393 million). The prior-year period saw the compensation for treatments of U.S. war veterans (“VA agreement”) contributing €91 million as a one-time effect. Excluding the VA agreement, EBIT2 increased by 2% in constant currency in H1/2018. The EBIT margin2 was 13.3% (13.1% before IFRS 15; H1/17: 14.2%). Group EBIT2 before expenses for the further development of the biosimilars business decreased by 5% (increased 1% in constant currency) to €2,271 million. Group EBIT2 excluding the VA agreement and expenses for the biosimilars business increased by 5% in constant currency.
In Q2/2018, Group EBIT2 decreased by 3% (increased 2% in constant currency) to €1,145 million (Q2/2017: €1,177 million), with an EBIT margin2 of 13.7% (13.4% before IFRS 15; Q2/2017: 13.8%). Group EBIT2 excluding expenses for the biosimilars business increased by 5% in constant currency.
1 Net income attributable to shareholders of Fresenius SE & Co. KGaA2 Before special itemsFor a detailed overview of special items please see the reconciliation tables on pages 19-20 in the PDF document.
Group net interest2 was -€297 million (H1/2017: -€326 million). The decrease is mainly driven by currency effects and reduced interest following refinancing activities.
The decrease of the Group tax rate before special items to 22.3% (H1/2017: 28.5%) was mainly due to the U.S. tax reform. In Q2/2018, the Group tax rate2 was 23.4% (Q2/2017: 27.9%).
Noncontrolling interest2 was €556 million (H1/2017: €562 million), of which 95% was attributable to the noncontrolling interest in Fresenius Medical Care.
Group net income1,2 increased by 1% (7% in constant currency) to €922 million (H1/2017: €916 million). Earnings per share1,2 increased by 1% (7% in constant currency) to €1.66 (H1/2017: €1.65). In Q2/2018, Group net income1,2 increased by 3% (7% in constant currency) to €472 million (Q2/2017: €459 million). Earnings per share1,2 increased by 3% (7% in constant currency) to €0.85 (Q2/2017: €0.82).
Group net income1,2 before expenses for the further development of the biosimilars business increased by 6% (12% in constant currency) to €975 million (H1/2017: €916 million). Earnings per share1,2 before expenses for the further development of the biosimilars business increased by 6% (12% in constant currency) to €1.76 (H1/2017: €1.65). In Q2/2018, Group net income1,2 before expenses for the further development of the biosimilars business increased by 9% (12% in constant currency) to €499 million (Q2/2017: €459 million). Earnings per share1,2 before expenses for the further development of the biosimilars business increased by 9% (12% in constant currency) to €0.90 (Q2/2017: €0.82).
Group net income1 after special items increased by 20% (29% in constant currency) to €1,092 million (H1/2017: €907 million), mainly due to gains related to divestitures in Care Cordination activities at Fresenius Medical Care. Earnings per share1 after special items increased by 20% (29% in constant currency) to €1.97 (H1/2017: €1.64). In Q2/2018, Group net income1 after special items increased by 45% (54% in constant currency) to €652 million (Q2/2017: €450 million). Earnings per share1 after special items increased by 45% (54% in constant currency) to €1.18 (Q2/2017: €0.81).
1 Net income attributable to shareholders of Fresenius SE & Co. KGaA2 Before special itemsFor a detailed overview of special items please see the reconciliation tables on pages 19-20 in the PDF document.
Continued investment in growth
Spending on property, plant and equipment was €831 million (H1/2017: €709 million), primarily for the modernization and expansion of dialysis clinics, production facilities as well as hospitals and day clinics. This corresponds to 5.0% of sales.
Total acquisition spending was €386 million (H1/2017: €6,421 million). The prior-year period included the acquisition of Quirónsalud.
Cash flow development
Operating cash flow decreased by 25% to €1,256 million (H1/2017: €1,683 million) with a margin of 7.6% (H1/2017: 10.0%). The decrease is mainly due to two effects at Fresenius Medical Care in North America: Receipt of a ~€200 million payment under the VA agreement in the prior-year period as well as increased accounts receivable related to the addition of calcimimetics into the Medicare ESRD payment bundle. Moreover negative currency translation effects weighed on the cash flow development in H1/2018. Operating cash flow in Q2/2018 decreased by 15% to €1,020 million (Q2/2017: €1,207 million), with a margin of 12.2% (Q2/2017: 14.1%). Negative currency translation effects weighed on the cash flow development in Q2/2018.
Given the effects described above and growing investments, free cash flow before acquisitions and dividends decreased to €425 million (H1/2017: €998 million). Free cash flow after acquisitions and dividends was €942 million (H1/2017: -€5,645 million).
Solid balance sheet structure
The Group’s total assets increased by 3% (3% in constant currency) to €54,982 million (Dec. 31, 2017: €53,133 million). Current assets grew by 13% (13% in constant currency) to €14,287 million (Dec. 31, 2017: €12,604 million). Non-current assets were nearly unchanged (decreased by 1% in constant currency) at €40,695 million (Dec. 31, 2017: € 40,529 million).
Total shareholders’ equity increased by 7% (6% in constant currency) to €23,269 million (Dec. 31, 2017: €21,720 million). The equity ratio increased to 42.3% (Dec. 31, 2017: 40.9%).
Group debt was nearly unchanged (decreased by 1% in constant currency) at €18,989 million (Dec. 31, 2017: € 19,042 million). Group net debt decreased by 4% (-5% in constant currency) to € 16,722 million (Dec. 31, 2017: € 17,406 million) mainly due to the proceeds from divestitures of Care Coordination activities.
As of June 30, 2018, the net debt/EBITDA ratio was 2.801,2 (December 31, 2017: 2.841,2). Excluding the proceeds from divestitures of Care Coordination activities the net debt/EBITDA ratio was 3.021,2.
1 At LTM average exchange rates for both net debt and EBITDA; pro forma closed acquisitions/divestitures, excluding Akorn and NxStage transactions2 Before special itemsFor a detailed overview of special items please see the reconciliation tables on pages 19-20 in the PDF document.
Increased number of employees
As of June 30, 2018, the number of employees was 273,632 (Dec. 31, 2017: 273,249).
Business Segments
Fresenius Medical Care
Fresenius Medical Care is the world's largest provider of products and services for individuals with renal diseases. As of June 30, 2018, Fresenius Medical Care was treating 325,188 patients in 3,815 dialysis clinics. Along with its core business, the company provides related medical services in the field of Care Coordination.


- Q2/2018 reported results significantly positively influenced by divestitures of Care Coordination activities
- 5% adjusted1,2 sales growth in constant currency in Q2
- 6% adjusted4,6 net income growth in constant currency in Q2
- 22% net income growth in constant currency on a comparable basis4,7 in Q2
Reported sales were strongly impacted by headwinds from foreign exchange rates and by the already anticipated decline in Fresenius Medical Care North America’s pharmacy business. Sales decreased by 9% (increased by 3%1 in constant currency) to €8,189 million (H1/2017: €9,019 million). Organic sales growth was 3%. Currency translation effects reduced sales by 9%. Adoption of IFRS 15 reduced sales by 3%. Excluding the VA agreement in the prior-year quarter, sales growth1 was 4% in constant currency.
1 Growth rate adjusted for IFRS 15 implementation (Q2/17 base: €4,340 million; H1/17 base: €8,749 million)2 Excluding VA agreement: Q2/2018: 5%; H1/2018: 4%3 Adjusted for gains from divestitures of Care Coordination activities: Q2/2018: 4%;H1/2018: -5%4 Net income attributable to shareholders of Fresenius Medical Care AG & Co. KGaA5 Adjusted for gains from divestitures of Care Coordination activities and the effect of the U.S. Tax Reform: Q2/2018: 8%; H1/2018: -3%6 Consistent with guidance, i.e. excluding gains from divestitures of Care Coordination activities, excluding the effect of the U.S. Tax Reform and excluding VA agreement7 Consistent with guidance, i.e. excluding gains from divestitures of Care Coordination activities, including the effect of the U.S. Tax Reform and including VA agreement
In Q2/2018, sales decreased by 6% (increased 5%1 in constant currency) to €4,214 million (Q2/2017: €4,471 million). Organic sales growth was 4%. Currency translation effects reduced sales by 8%. Adoption of IFRS 15 reduced sales by 3%.
Health Care services sales (dialysis services and care coordination) decreased by 8%1 (increased by 3%1 in constant currency) to €6,594 million (H1/2017: €7,418 million). With €1,595 million (H1/2017: €1,601 million), Health Care product sales were on prior-year’s level (increased by 6% in constant currency).
In North America, sales decreased by 9%1 (increased by 1%1 in constant currency) to €5,746 million (H1/2017: €6,600 million). Health Care services sales decreased by 9%1 (increased by 1%1 in constant currency) to €5,351 million (H1/2017: €6,182 million). Excluding the 2017 effect from the VA Agreement (€98 million), Health Care services sales increased by 3%1 in constant currency. Health Care product sales decreased by 5% (increased by 6% in constant currency) to €395 million (H1/2017: €418 million).
Sales outside North America increased by 1% (8% in constant currency) to €2,436 million (H1/2017: €2,410 million). Health Care services sales increased by 1% (10% in constant currency) to €1,243 million (H1/2017: €1,236 million). Health Care product sales increased by 2% (7% in constant currency) to €1,193 million (H1/2017: €1,174 million).
Fresenius Medical Care’s EBIT increased by 54% (68% in constant currency) to €1,898 million (H1/2017: €1,235 million), driven by the divestitures of Care Coordination activities in Q2/18. The EBIT margin increased to 23.2% (H1/2017: 13.7%). Adjusted for the implementation of IFRS 15 and excluding the gains from divestitures of Care Coordination activities and the VA agreement in the prior-year period, EBIT increased by 3% in constant currency and EBIT margin was 13.2% (H1/2017: 13.2%). In Q2/2018, EBIT increased by 140% (increased by 162% in constant currency) to €1,401 million (Q2/2017: €583 million). The EBIT margin increased to 33.3% (Q2/2017: 13.0%). Adjusted for the adoption of IFRS 15 and excluding the gains from divestitures of Care Coordination activities, EBIT increased by 4% in constant currency and EBIT margin increased to 13.5%.
1 Growth rate adjusted for IFRS 15 implementation (Q2/17: -€131 million; H1/17: -€270 million)
Net income1 increased by 121% (141% in constant currency) to €1,273 million (H1/2017: €577 million). Consistent with full-year guidance, i.e. excluding the gains from divestitures of Care Coordination activities, the effect of the U.S. Tax Reform and the VA agreement in the prior-year period, net income growth1 was 7% in constant currency. Net income1 growth on a comparable basis, i.e. excluding the gains from divestitures of Care Coordination activities, but including the effect of the U.S. Tax Reform and the VA agreement in the prior-year period, was 13% in constant currency.
In Q2/2018, net income1 grew by 270% (303% in constant currency) to €994 million (Q2/2017: €269 million). Consistent with full-year guidance, i.e. excluding the gains from divestitures of Care Coordination activities, the effect of the U.S. Tax Reform and the VA agreement in the prior-year period, net income growth1 was 6% in constant currency. Net income1 growth on comparable basis, i.e. excluding the gains from divestitures of Care Coordination activities, but including the effect of the U.S. Tax Reform and the VA agreement in the prior-year period was 22% in constant currency.
Operating cash flow was €611 million (H1/2017: €1,052 million). The cash flow margin was 7.5% (H1/2017: 11.7%). The decrease is mainly due to two effects in North America: Receipt of a ~€200 million payment under the VA agreement in the prior-year period as well as increased accounts receivable related to the addition of calcimimetics into the Medicare ESRD payment bundle. In Q2/2018, operating cash flow was €656 million (Q2/2017: €882 million) with a cash flow margin of 15.6% (Q2/2017: 19.7%).
Fresenius Medical Care confirms its outlook for 2018 and expects sales growth of 5 to 7%2 in constant currency and net income1 comparable growth of 13% to 15%3 in constant currency (7% to 9%4 adjusted net income growth).
The 2018 growth targets are based on 2017 figures and exclude effects from the planned acquisition of NxStage Medical and gains from divestitures of Care Coordination activities.
For further information, please see Fresenius Medical Care’s Press Release at www.freseniusmedicalcare.com.
1 Net income attributable to shareholders of Fresenius Medical Care AG & Co. KGaA
2 2017 base: €16,739 million (adjusted for IFRS 15 adoption (-€486 million) and excluding Sound´s revenue for H2/2017 (-€558 million))
3 2017 base: €1,242 million, excluding Sound´s H2/17 net income (-€38 million); 2018 including benefits from U.S. tax reform but excluding gains from divestitures of Care Coordination activities
4 Excluding gains from divestitures of Care Coordination activities, excluding the effect of the U.S. Tax Reform natural disaster, FCPA related charge and excluding VA agreement
Fresenius Kabi
Fresenius Kabi offers intravenously administered generic drugs, clinical nutrition and infusion therapies for seriously and chronically ill patients in the hospital and outpatient environments. The company is also a leading supplier of medical devices and transfusion technology products. In the biosimilars business, we are developing products with a focus on oncology and autoimmune diseases.


- 6% organic sales growth and 11% EBIT1 growth in constant currency (excluding biosimilars business) in Q2
- European Commission confirms marketing authorizations of HES subject to the implementation of risk minimization measures
- Sales outlook confirmed: 4% to 7% organic sales growth expected
- EBIT outlook raised: -2% to +1%5 EBIT growth in constant currency expected (~6% to 9%6 excl. biosimilars expenses)
Sales of €3,207 million (H1/2017: €3,202 million) were on prior-year level (increased by 7% in constant currency). Organic sales growth was 7%. Strong negative currency translation effects (-7%) were mainly related to the devaluation of the U.S. dollar, the Brazilian real and the Chinese yuan against the euro. In Q2/2018, sales of €1,604 million were nearly unchanged (increased by 6% in constant currency) from the prior-year level (Q2/2017: €1,598 million). Organic sales growth was 6%.
Sales in Europe grew by 2% (organic growth: 3%) to €1,120 million (H1/2017: €1,097 million). In Q2/2018, sales increased by 2% (organic growth: 3%) to €563 million (Q2/2017: €553 million).
Sales in North America decreased by 4% (organic growth: 7%) to €1,140 million (H1/2017: €1,187 million). In Q2/2018, sales decreased by 3% (organic growth: 4%) to €549 million (Q2/2017: €568 million).
1 Before special items2 Before expenses for the further development of the biosimilars business: Q2/2018: 11%; H1/2018: 10%3 Net income attributable to shareholders of Fresenius SE & Co. KGaA4 Before expenses for the further development of the biosimilars business: Q2/2018: 19%; H1/2018: 17%5 2017 base: €1,177 million; 2017 & 2018 before special items, including expenditures for the further development of the biosimilars business (€60 million in FY/17, and expected expenditures of ~€160 million in FY/18)6 2017 base: €1,237 million; 2017 & 2018 before special itemsFor a detailed overview of special items please see the reconciliation tables on pages 19-20 in the PDF document.
Sales in Asia-Pacific increased by 8% (organic growth: 13%) to €627 million (H1/2017: €582 million). In Q2/2018, sales increased by 8% (organic growth: 11%) to €326 million (Q2/2017: €302 million). Sales in Latin America/Africa decreased by 5% (organic growth: 10%) to €320 million (H1/2017: €336 million). In Q2/2018, sales decreased by 5% (organic growth: 10%) to €166 million (Q2/2017: €175 million).
EBIT1 decreased by 10% (-1% in constant currency) to €557 million (H1/2017: €622 million) with an EBIT margin1 of 17.4% (H1/2017: 19.4%). In Q2/2018, EBIT1 decreased by 6% (-1% in constant currency) to €289 million (Q2/2017: €309 million) with an EBIT margin1 of 18.0% (Q2/2017: 19.3%).
EBIT1 before expenses for the further development of the biosimilars business increased by 1% (10% in constant currency) to €629 million (H1/2017: €622 million) with an EBIT margin1 of 19.6% (H1/2017: 19.4%). In Q2/2018, EBIT1 before expenses for the further development of the biosimilars business increased by 6% (11% in constant currency) to €326 million (Q2/2017: €309 million) with an EBIT margin1 of 20.3% (Q2/2017: 19.3%).
Net income1,2 decreased by 6% (increased by 4% in constant currency) to €355 million (H1/2017: €379 million). In Q2/2018, net income1,2 decreased by 2% (increased by 5% in constant currency) to €185 million (Q2/2017: €188 million).
Operating cash flow increased by 15% to €454 million (H1/2017: €395 million). The cash flow margin grew to 14.2% (H1/2017: 12.3%). In Q2/2018, operating cash flow increased by 12% to €228 million (Q2/2017: €203 million) with a cash flow margin of 14.2% (Q2/2017: 12.7%).
1 Before special items2 Net income attributable to shareholders of Fresenius SE & Co. KGaAFor a detailed overview of special items please see the reconciliation tables on pages 19-20 in the PDF document.
Based on the strong development of Fresenius Kabi in H1/2018 and the reversal of some HES1 associated risk adjustments, Fresenius Kabi raises its EBIT outlook for 2018 by 4%-points and now expects EBIT growth in constant currency of -2% to +1%2 (previously: -6% to -3%2 in constant currency). Excluding expenditures for the further development of the biosimilars business, EBIT is now expected to grow by ~6% to 9%3 in constant currency (previously: ~2% to 5%3 in constant currency). Fresenius Kabi confirms its sales guidance of 4% to 7% organic growth.
1 Hydroxyethyl starch (HES)2 2017 base: €1,177 million; 2017 & 2018 before special items, including expenditures for the further development of the biosimilars business (€60 million in FY/17 and expected expenditures of ~€160 million in FY/18)3 2017 base: €1,237 million; 2017 & 2018 before special itemsFor a detailed overview of special items please see the reconciliation tables on pages 19-20 in the PDF document.
Fresenius Helios
Fresenius Helios is Europe's leading private hospital operator. The company comprises Helios Germany and Helios Spain (Quirónsalud). Helios Germany operates 87 acute care hospitals, 89 outpatient centers and treats approximately 5.2 million patients annually. Quirónsalud operates 45 hospitals, 56 outpatient centers and around 300 occupational risk prevention centers, and treats approximately 11.6 million patients annually.

- 4% organic sales growth in Q2
- DRG catalogue effects and preparatory structural activities for anticipated regulatory measures weigh on financial performance of Helios Germany
- Helios Spain with accelerated growth: 8% organic sales growth and 19% EBIT growth in Q2
- 2018 outlook confirmed
Fresenius Helios increased sales by 10% to €4,674 million (H1/2017: €4,256 million). Organic sales growth was 4%. In Q2/2018, sales increased by 5% (organic growth: 4%) to €2,343 million (Q2/2017: €2,238 million).
Sales of Helios Germany increased by 3% (organic growth: 3%) to €3,121 million (H1/2017: €3,038 million). In Q2/2018, sales increased by 2% (organic growth: 3%) to €1,547 million (Q2/2017: €1,510 million). Helios Spain increased sales by 28% (organic growth: 5%) to €1,553 million (H1/2017: €1,218 million), mainly due to the additional month of consolidation compared to the prior-year period (Quirónsalud is consolidated since February 1, 2017). In Q2/2018 Helios Spain increased sales by 9% (organic growth: 8%) to €796 million (Q2/2017: €728 million).
Fresenius Helios grew EBIT by 6% to €571 million (H1/2017: €537 million) with a margin of 12.2% (H1/2017: 12.6%). In Q2/2018, EBIT increased by 4% to €293 million (Q2/2017: €282 million) with a margin of 12.5% (Q2/2017: 12.6%).
EBIT of Helios Germany decreased by 4% to €345 million (H1/2017: €359 million) with a margin of 11.1% (H1/2017: 11.8%). The decline is mainly due to additional catalogue effects, preparatory structural activities for anticipated regulatory requirements (i.e. clustering) as well as a lack of privatization opportunities in the German market. In Q2/2018, EBIT decreased by 6% to €168 million (Q2/2017: €178 million) with a margin of 10.9% (Q2/2017: 11.8%).
EBIT of Helios Spain increased by 28% to €227 million (H1/2017: €178 million), mainly due to the additional month of consolidation compared to the prior-year period, with a margin of 14.6% (H1/2017: 14.6%). In Q2/2018, EBIT increased by 19% to €124 million (Q2/2017: €104 million) with a margin of 15.6% (Q2/2017: 14.3%).
Net income1 of Fresenius Helios increased by 4% to €388 million (H1/2017: €373 million). In Q2/2018, net income1 increased by 3% to €197 million (Q2/2017: €192 million).
Operating cash flow was €259 million (H1/2017: €304 million) with a margin of 5.5% (H1/2017: 7.1%).
The already announced transfer of the in-patient post-acute care business from Fresenius Helios to Fresenius Vamed has become effective as of July 1, 2018. As a consequence, Fresenius Helios’ EBIT growth outlook for 2018 was adjusted to 5% to 8% (previously: 7% to 10%).
Fresenius Helios confirms its outlook for 2018 and expects organic sales growth of 3% to 6% and EBIT growth of 5% to 8%.
1 Net income attributable to shareholders of Fresenius SE & Co. KGaA
Fresenius Vamed
Fresenius Vamed manages projects and provides services for hospitals and other health care facilities worldwide and is a post-acute care provider in Central Europe. The portfolio ranges along the entire value chain: from project development, planning, and turnkey construction, via maintenance and technical management, to total operational management.


- Service business with continued good momentum: 11% sales growth in Q2
- Project business with good order intake of €195 million in Q2
- Transfer of inpatient post-acute care business from Helios Germany to Vamed as of July 1, 2018
- 2018 outlook confirmed
Sales increased by 7% (7% in constant currency) to €515 million (H1/2017: €481 million). Organic sales growth was 5%. Sales in the project business increased by 4% to €191 million (H1/2017: €184 million). Sales in the service business grew by 9% to €324 million (H1/2017: €297 million). In Q2/2018, sales increased by 3% (organic growth: 1%) to €266 million (Q2/2017: €258 million).
EBIT increased by 6% to €18 million (H1/2017: €17 million) with a margin of 3.5% (H1/2017: 3.5%). In Q2/2018, EBIT increased by 9% to €12 million (Q2/2017: €11 million) with a margin of 4.5% (Q2/2017: 4.3%).
Net income1 of €11 million was unchanged from prior-year’s level. In Q2/2018, net income1 was also unchanged at €7 million.
Order intake increased by 10% to €455 million (H1/2017: €412 million). As of June 30, 2018, order backlog was €2,372 million (December 31, 2017: €2,147 million).
The already announced transfer of the in-patient post-acute care business from Fresenius Helios to Fresenius Vamed has become effective as of July 1, 2018. As a consequence, Fresenius Vamed’s EBIT growth outlook for 2018 was adjusted to 32% to 37% (previously: 5% to 10%).
Fresenius Vamed confirms its outlook for 2018 and expects organic sales growth in the range of 5% to 10% and EBIT growth of 32% to 37%.
1 Net income attributable to shareholders of VAMED AG
Conference Call
As part of the publication of the results for the second quarter / first half of 2018, a conference call will be held on July 31, 2018 at 2 p.m. CET (8 a.m. EST). All investors are cordially invited to follow the conference call in a live broadcast over the Internet at www.fresenius.com/media-calendar. Following the call, a replay will be available on our website.
For additional information on the performance indicators used please refer to our website https://www.fresenius.com/alternative-performance-measures.
This release contains forward-looking statements that are subject to various risks and uncertainties. Future results could differ materially from those described in these forward-looking statements due to certain factors, e.g. changes in business, economic and competitive conditions, regulatory reforms, results of clinical trials, foreign exchange rate fluctuations, uncertainties in litigation or investigative proceedings, and the availability of financing. Fresenius does not undertake any responsibility to update the forward-looking statements in this release.
If no timeframe is specified, information refers to H1/2018
Q2/2018:
- Sales: €8.4 billion (-2%, +5% in constant currency2 )
- EBIT2: €1,145 million (-3%, +2% in constant currency)
- EBIT2 (excl. biosimilars business): €1,182 million (0%, +5% in constant currency)
- Net income2,3: €472 million (+3%, +7% in constant currency)
- Net income2,3 (excl. biosimilars business): €499 million (+9%, +12% in constant currency)
H1/2018:
- Sales: €16.5 billion (-2%, +6% in constant currency1)
- EBIT2: €2,199 million (-8%, -2% in constant currency)
- EBIT2: (excl. biosimilars business) €2,271 million (-5%, +1% in constant currency)
- Net income2,3: €922 million (+1%, +7% in constant currency)
- Net income2,3 (excl. biosimilars business): €975 million (+6%, +12% in constant currency)
1 Growth rate adjusted for IFRS 15 adoption (Q2/17 base: €8,401 million; H1/2017 base: €16,624 million)2 Before special items (i.e., expenses related to the Akorn transaction, gains related to divestitures of Care Coordination activities) 3 Net income attributable to shareholders of Fresenius SE & Co. KGaA
For a detailed overview of special items please see the reconciliation tables on pages 18-19 in the PDF document.
Group guidance1 for 2018 confirmed
Fresenius confirms its guidance for 2018. Group sales are expected to increase by 5% to 8%2 in constant currency. Net income3,4 is expected to grow by 6% to 9% in constant currency. Excluding expenditures for the further development of the biosimilars business, net income3,5 is expected to grow by ~10% to 13% in constant currency.
Fresenius expects to further reduce its net debt/EBITDA ratio6 by year-end 2018.
6% sales growth in constant currency7
Group sales decreased by 1%7 (increased by 6%7 in constant currency) to €16,503 million (H1/2017: €16,894 million). Organic sales growth was 4%. Acquisitions/divestitures contributed net 2% to growth. Negative currency translation effects (7%) were mainly driven by the devaluation of the U.S. dollar and the Chinese yuan against the euro. In Q2/2018, Group sales were nearly unchanged7 (increased 5%7 in constant currency) at €8,382 million (Q2/2017: €8,532 million). Organic sales growth was 4%. Acquisitions/divestitures contributed net 1% to growth.
1 Excluding expenses related to the Akorn and NxStage transactions and gains from divestitures of Care Coordination activities2 2017 base adjusted for IFRS 15 adoption (deduction of €486 million at Fresenius Medical Care) and divestitures of Care Coordination activities (deduction of €558 million at Fresenius Medical Care)3 Net income attributable to shareholders of Fresenius SE & Co. KGaA4 2017 base: €1,804 million; 2018 before special items; including expenditures for further development of biosimilars business (€43 million after tax in FY/17 and ~€120 million after tax in FY/18) 5 2017 base: €1,847 million; 2018 before special items 6 Calculated at expected annual average exchange rates for both net debt and EBITDA; excluding effects of the Akorn and NxStage transactions and gains from divestitures of Care Coordination activities; excluding further potential acquisitions; at current IFRS rules 7 Growth rates adjusted for IFRS 15 adoption (H1/17 base: €16,624 million; Q2/17 base: €8,401 million)

7% net income1,2 growth in constant currency
Group EBITDA2 decreased by 6% (0% in constant currency) to €2,912 million (H1/2017: €3,098 million). Group EBIT2 decreased by 8% (-2% in constant currency) to €2,199 million (H1/2017: €2,393 million). The prior-year period saw the compensation for treatments of U.S. war veterans (“VA agreement”) contributing €91 million as a one-time effect. Excluding the VA agreement, EBIT2 increased by 2% in constant currency in H1/2018. The EBIT margin2 was 13.3% (13.1% before IFRS 15; H1/17: 14.2%). Group EBIT2 before expenses for the further development of the biosimilars business decreased by 5% (increased 1% in constant currency) to €2,271 million. Group EBIT2 excluding the VA agreement and expenses for the biosimilars business increased by 5% in constant currency.
In Q2/2018, Group EBIT2 decreased by 3% (increased 2% in constant currency) to €1,145 million (Q2/2017: €1,177 million), with an EBIT margin2 of 13.7% (13.4% before IFRS 15; Q2/2017: 13.8%). Group EBIT2 excluding expenses for the biosimilars business increased by 5% in constant currency.
1 Net income attributable to shareholders of Fresenius SE & Co. KGaA 2 Before special itemsFor a detailed overview of special items please see the reconciliation tables on pages 18-19 in the PDF document.
Group net interest2 was -€297 million (H1/2017: -€326 million). The decrease is mainly driven by currency effects and reduced interest following refinancing activities.
The decrease of the Group tax rate before special items to 22.3% (H1/2017: 28.5%) was mainly due to the U.S. tax reform. In Q2/2018, the Group tax rate2 was 23.4% (Q2/2017: 27.9%).
Noncontrolling interest2 was €556 million (H1/2017: €562 million), of which 95% was attributable to the noncontrolling interest in Fresenius Medical Care.
Group net income1,2 increased by 1% (7% in constant currency) to €922 million (H1/2017: €916 million). Earnings per share1,2 increased by 1% (7% in constant currency) to €1.66 (H1/2017: €1.65). In Q2/2018, Group net income1,2 increased by 3% (7% in constant currency) to €472 million (Q2/2017: €459 million). Earnings per share1,2 increased by 3% (7% in constant currency) to €0.85 (Q2/2017: €0.82).
Group net income1,2 before expenses for the further development of the biosimilars business increased by 6% (12% in constant currency) to €975 million (H1/2017: €916 million). Earnings per share1,2 before expenses for the further development of the biosimilars business increased by 6% (12% in constant currency) to €1.76 (H1/2017: €1.65). In Q2/2018, Group net income1,2 before expenses for the further development of the biosimilars business increased by 9% (12% in constant currency) to €499 million (Q2/2017: €459 million). Earnings per share1,2 before expenses for the further development of the biosimilars business increased by 9% (12% in constant currency) to €0.90 (Q2/2017: €0.82).
Group net income1 after special items increased by 20% (29% in constant currency) to €1,092 million (H1/2017: €907 million), mainly due to gains related to divestitures in Care Cordination activities at Fresenius Medical Care. Earnings per share1 after special items increased by 20% (29% in constant currency) to €1.97 (H1/2017: €1.64). In Q2/2018, Group net income1 after special items increased by 45% (54% in constant currency) to €652 million (Q2/2017: €450 million). Earnings per share1 after special items increased by 45% (54% in constant currency) to €1.18 (Q2/2017: €0.81).
1 Net income attributable to shareholders of Fresenius SE & Co. KGaA2 Before special itemsFor a detailed overview of special items please see the reconciliation tables on pages 18-19 in the PDF document.
Continued investment in growth
Spending on property, plant and equipment was €831 million (H1/2017: €709 million), primarily for the modernization and expansion of dialysis clinics, production facilities as well as hospitals and day clinics. This corresponds to 5.0% of sales.
Total acquisition spending was €386 million (H1/2017: €6,421 million). The prior-year period included the acquisition of Quirónsalud.
Cash flow development
Operating cash flow decreased by 25% to €1,256 million (H1/2017: €1,683 million) with a margin of 7.6% (H1/2017: 10.0%). The decrease is mainly due to two effects at Fresenius Medical Care in North America: Receipt of a ~€200 million payment under the VA agreement in the prior-year period as well as increased accounts receivable related to the addition of calcimimetics into the Medicare ESRD payment bundle. Moreover negative currency translation effects weighed on the cash flow development in H1/2018. Operating cash flow in Q2/2018 decreased by 15% to €1,020 million (Q2/2017: €1,207 million), with a margin of 12.2% (Q2/2017: 14.1%). Negative currency translation effects weighed on the cash flow development in Q2/2018.
Given the effects described above and growing investments, free cash flow before acquisitions and dividends decreased to €425 million (H1/2017: €998 million). Free cash flow after acquisitions and dividends was €942 million (H1/2017: -€5,645 million).
Solid balance sheet structure
The Group’s total assets increased by 3% (3% in constant currency) to €54,982 million (Dec. 31, 2017: €53,133 million). Current assets grew by 13% (13% in constant currency) to €14,287 million (Dec. 31, 2017: €12,604 million). Non-current assets were nearly unchanged (decreased by 1% in constant currency) at €40,695 million (Dec. 31, 2017: €40,529 million).
Total shareholders’ equity increased by 7% (6% in constant currency) to €23,269 million (Dec. 31, 2017: €21,720 million). The equity ratio increased to 42.3% (Dec. 31, 2017: 40.9%).
Group debt was nearly unchanged (decreased by 1% in constant currency) at €18,989 million (Dec. 31, 2017: €19,042 million). Group net debt decreased by 4% (-5% in constant currency) to €?16,722 million (Dec. 31, 2017: €?17,406 million) mainly due to the proceeds from divestitures of Care Coordination activities.
As of June 30, 2018, the net debt/EBITDA ratio was 2.801,2 (December 31, 2017: 2.841,2). Excluding the proceeds from divestitures of Care Coordination activities the net debt/EBITDA ratio was 3.021,2.
1 At LTM average exchange rates for both net debt and EBITDA; pro forma closed acquisitions/divestitures, excluding Akorn and NxStage transactions2 Before special itemsFor a detailed overview of special items please see the reconciliation tables on pages 18-19 in the PDF document.
Business Segments
Fresenius Medical Care
Fresenius Medical Care is the world's largest provider of products and services for individuals with renal diseases. As of June 30, 2018, Fresenius Medical Care was treating 325,188 patients in 3,815 dialysis clinics. Along with its core business, the company provides related medical services in the field of Care Coordination.

- Q2/2018 reported results significantly positively influenced by divestitures of Care Coordination activities
- 5% adjusted1,2 sales growth in constant currency in Q2
- 6% adjusted4,6 net income growth in constant currency in Q2
- 22% net income growth in constant currency on a comparable basis4,7 in Q2
Reported sales were strongly impacted by headwinds from foreign exchange rates and by the already anticipated decline in Fresenius Medical Care North America’s pharmacy business. Sales decreased by 9% (increased by 3%1 in constant currency) to €8,189 million (H1/2017: €9,019 million). Organic sales growth was 3%. Currency translation effects reduced sales by 9%. Adoption of IFRS 15 reduced sales by 3%. Excluding the VA agreement in the prior-year quarter, sales growth1 was 4% in constant currency.
1 Growth rate adjusted for IFRS 15 implementation (Q2/17 base: €4,340 million; H1/17 base: €8,749 million) 2 Excluding VA agreement: Q2/2018: 5%; H1/2018: 4%3 Adjusted for gains from divestitures of Care Coordination activities: Q2/2018: 4%; H1/2018: -5% 4 Net income attributable to shareholders of Fresenius Medical Care AG & Co. KGaA 5 Adjusted for gains from divestitures of Care Coordination activities and the effect of the U.S. Tax Reform: Q2/2018: 8%; H1/2018: -3% 6 Consistent with guidance, i.e. excluding gains from divestitures of Care Coordination activities, excluding the effect of the U.S. Tax Reform and excluding VA agreement 7 Consistent with guidance, i.e. excluding gains from divestitures of Care Coordination activities, including the effect of the U.S. Tax Reform and including VA agreement
In Q2/2018, sales decreased by 6% (increased 5%1 in constant currency) to €4,214 million (Q2/2017: €4,471 million). Organic sales growth was 4%. Currency translation effects reduced sales by 8%. Adoption of IFRS 15 reduced sales by 3%.
Health Care services sales (dialysis services and care coordination) decreased by 8%1 (increased by 3%1 in constant currency) to €6,594 million (H1/2017: €7,418 million). With €1,595 million (H1/2017: €1,601 million), Health Care product sales were on prior-year’s level (increased by 6% in constant currency).
In North America, sales decreased by 9%1 (increased by 1%1 in constant currency) to €5,746 million (H1/2017: €6,600 million). Health Care services sales decreased by 9%1 (increased by 1%1 in constant currency) to €5,351 million (H1/2017: €6,182 million). Excluding the 2017 effect from the VA Agreement (€98 million), Health Care services sales increased by 3%1 in constant currency. Health Care product sales decreased by 5% (increased by 6% in constant currency) to €395 million (H1/2017: €418 million).
Sales outside North America increased by 1% (8% in constant currency) to €2,436 million (H1/2017: €2,410 million). Health Care services sales increased by 1% (10% in constant currency) to €1,243 million (H1/2017: €1,236 million). Health Care product sales increased by 2% (7% in constant currency) to €1,193 million (H1/2017: €1,174 million).
Fresenius Medical Care’s EBIT increased by 54% (68% in constant currency) to €1,898 million (H1/2017: €1,235 million), driven by the divestitures of Care Coordination activities in Q2/18. The EBIT margin increased to 23.2% (H1/2017: 13.7%). Adjusted for the implementation of IFRS 15 and excluding the gains from divestitures of Care Coordination activities and the VA agreement in the prior-year period, EBIT increased by 3% in constant currency and EBIT margin was 13.2% (H1/2017: 13.2%). In Q2/2018, EBIT increased by 140% (increased by 162% in constant currency) to €1,401 million (Q2/2017: €583 million). The EBIT margin increased to 33.3% (Q2/2017: 13.0%). Adjusted for the adoption of IFRS 15 and excluding the gains from divestitures of Care Coordination activities, EBIT increased by 4% in constant currency and EBIT margin increased to 13.5%.
1 Growth rate adjusted for IFRS 15 implementation (Q2/17: -€131 million; H1/17: -€270 million)
Net income1 increased by 121% (141% in constant currency) to €1,273 million (H1/2017: €577 million). Consistent with full-year guidance, i.e. excluding the gains from divestitures of Care Coordination activities, the effect of the U.S. Tax Reform and the VA agreement in the prior-year period, net income growth1 was 7% in constant currency. Net income1 growth on a comparable basis, i.e. excluding the gains from divestitures of Care Coordination activities, but including the effect of the U.S. Tax Reform and the VA agreement in the prior-year period, was 13% in constant currency.
In Q2/2018, net income1 grew by 270% (303% in constant currency) to €994 million (Q2/2017: €269 million). Consistent with full-year guidance, i.e. excluding the gains from divestitures of Care Coordination activities, the effect of the U.S. Tax Reform and the VA agreement in the prior-year period, net income growth1 was 6% in constant currency. Net income1 growth on comparable basis, i.e. excluding the gains from divestitures of Care Coordination activities, but including the effect of the U.S. Tax Reform and the VA agreement in the prior-year period was 22% in constant currency.
Operating cash flow was €611 million (H1/2017: €1,052 million). The cash flow margin was 7.5% (H1/2017: 11.7%). The decrease is mainly due to two effects in North America: Receipt of a ~€200 million payment under the VA agreement in the prior-year period as well as increased accounts receivable related to the addition of calcimimetics into the Medicare ESRD payment bundle. In Q2/2018, operating cash flow was €656 million (Q2/2017: €882 million) with a cash flow margin of 15.6% (Q2/2017: 19.7%).
Fresenius Medical Care confirms its outlook for 2018 and expects sales growth of 5 to 7%2 in constant currency and net income1 comparable growth of 13% to 15%3 in constant currency (7% to 9%4 adjusted net income growth).
The 2018 growth targets are based on 2017 figures and exclude effects from the planned acquisition of NxStage Medical and gains from divestitures of Care Coordination activities.
For further information, please see Fresenius Medical Care’s Press Release at www.freseniusmedicalcare.com.
1 Net income attributable to shareholders of Fresenius Medical Care AG & Co. KGaA
2 2017 base: €16,739 million (adjusted for IFRS 15 adoption (-€486 million) and excluding Sound´s revenue for H2/2017 (-€558 million))
3 2017 base: €1,242 million, excluding Sound´s H2/17 net income (-€38 million); 2018 including benefits from U.S. tax reform but excluding gains from divestitures of Care Coordination activities
4 Excluding gains from divestitures of Care Coordination activities, excluding the effect of the U.S. Tax Reform natural disaster, FCPA related charge and excluding VA agreement
Fresenius Kabi
Fresenius Kabi offers intravenously administered generic drugs, clinical nutrition and infusion therapies for seriously and chronically ill patients in the hospital and outpatient environments. The company is also a leading supplier of medical devices and transfusion technology products. In the biosimilars business, we are developing products with a focus on oncology and autoimmune diseases.

- 6% organic sales growth and 11% EBIT1 growth in constant currency (excluding biosimilars business) in Q2
- European Commission confirms marketing authorizations of HES subject to the implementation of risk minimization measures
- Sales outlook confirmed: 4% to 7% organic sales growth expected
- EBIT outlook raised: -2% to +1%5 EBIT growth in constant currency expected (~6% to 9%6 excl. biosimilars expenses)
Sales of €3,207 million (H1/2017: €3,202 million) were on prior-year level (increased by 7% in constant currency). Organic sales growth was 7%. Strong negative currency translation effects (-7%) were mainly related to the devaluation of the U.S. dollar, the Brazilian real and the Chinese yuan against the euro. In Q2/2018, sales of €1,604 million were nearly unchanged (increased by 6% in constant currency) from the prior-year level (Q2/2017: €1,598 million). Organic sales growth was 6%.
Sales in Europe grew by 2% (organic growth: 3%) to €1,120 million (H1/2017: €1,097 million). In Q2/2018, sales increased by 2% (organic growth: 3%) to €563 million (Q2/2017: €553 million).
Sales in North America decreased by 4% (organic growth: 7%) to €1,140 million (H1/2017: €1,187 million). In Q2/2018, sales decreased by 3% (organic growth: 4%) to €549 million (Q2/2017: €568 million).
1 Before special items 2 Before expenses for the further development of the biosimilars business: Q2/2018: 11%; H1/2018: 10% 3 Net income attributable to shareholders of Fresenius SE & Co. KGaA 4 Before expenses for the further development of the biosimilars business: Q2/2018: 19%; H1/2018: 17%5 2017 base: €1,177 million; 2017 & 2018 before special items, including expenditures for the further development of the biosimilars business (€60 million in FY/17, and expected expenditures of ~€160 million in FY/18)6 2017 base: €1,237 million; 2017 & 2018 before special items
For a detailed overview of special items please see the reconciliation tables on pages 18-19 in the PDF document.
Sales in Asia-Pacific increased by 8% (organic growth: 13%) to €627 million (H1/2017: €582 million). In Q2/2018, sales increased by 8% (organic growth: 11%) to €326 million (Q2/2017: €302 million). Sales in Latin America/Africa decreased by 5% (organic growth: 10%) to €320 million (H1/2017: €336 million). In Q2/2018, sales decreased by 5% (organic growth: 10%) to €166 million (Q2/2017: €175 million).
EBIT1 decreased by 10% (-1% in constant currency) to €557 million (H1/2017: €622 million) with an EBIT margin1 of 17.4% (H1/2017: 19.4%). In Q2/2018, EBIT1 decreased by 6% (-1% in constant currency) to €289 million (Q2/2017: €309 million) with an EBIT margin1 of 18.0% (Q2/2017: 19.3%).
EBIT1 before expenses for the further development of the biosimilars business increased by 1% (10% in constant currency) to €629 million (H1/2017: €622 million) with an EBIT margin1 of 19.6% (H1/2017: 19.4%). In Q2/2018, EBIT1 before expenses for the further development of the biosimilars business increased by 6% (11% in constant currency) to €326 million (Q2/2017: €309 million) with an EBIT margin1 of 20.3% (Q2/2017: 19.3%).
Net income1,2 decreased by 6% (increased by 4% in constant currency) to €355 million (H1/2017: €379 million). In Q2/2018, net income1,2 decreased by 2% (increased by 5% in constant currency) to €185 million (Q2/2017: €188 million).
Operating cash flow increased by 15% to €454 million (H1/2017: €395 million). The cash flow margin grew to 14.2% (H1/2017: 12.3%). In Q2/2018, operating cash flow increased by 12% to €228 million (Q2/2017: €203 million) with a cash flow margin of 14.2% (Q2/2017: 12.7%).
1 Before special items 2 Net income attributable to shareholders of Fresenius SE & Co. KGaA
For a detailed overview of special items please see the reconciliation tables on pages 18-19 in the PDF document.
Based on the strong development of Fresenius Kabi in H1/2018 and the reversal of some HES1 associated risk adjustments, Fresenius Kabi raises its EBIT outlook for 2018 by 4%-points and now expects EBIT growth in constant currency of -2% to +1%2 (previously: -6% to -3%2 in constant currency). Excluding expenditures for the further development of the biosimilars business, EBIT is now expected to grow by ~6% to 9%3 in constant currency (previously: ~2% to 5%3 in constant currency). Fresenius Kabi confirms its sales guidance of 4% to 7% organic growth.
1 Hydroxyethyl starch (HES) 2 2017 base: €1,177 million; 2017 & 2018 before special items, including expenditures for the further development of the biosimilars business (€60 million in FY/17 and expected expenditures of ~€160 million in FY/18) 3 2017 base: €1,237 million; 2017 & 2018 before special items
For a detailed overview of special items please see the reconciliation tables on pages 19-20 in the PDF document.
Fresenius Helios
Fresenius Helios is Europe's leading private hospital operator. The company comprises Helios Germany and Helios Spain (Quirónsalud). Helios Germany operates 87 acute care hospitals, 89 outpatient centers and treats approximately 5.2 million patients annually. Quirónsalud operates 45 hospitals, 56 outpatient centers and around 300 occupational risk prevention centers, and treats approximately 11.6 million patients annually.

- 4% organic sales growth in Q2
- DRG catalogue effects and preparatory structural activities for anticipated regulatory measures weigh on financial performance of Helios Germany
- Helios Spain with accelerated growth: 8% organic sales growth and 19% EBIT growth in Q2
- 2018 outlook confirmed
Fresenius Helios increased sales by 10% to €4,674 million (H1/2017: €4,256 million). Organic sales growth was 4%. In Q2/2018, sales increased by 5% (organic growth: 4%) to €2,343 million (Q2/2017: €2,238 million).
Sales of Helios Germany increased by 3% (organic growth: 3%) to €3,121 million (H1/2017: €3,038 million). In Q2/2018, sales increased by 2% (organic growth: 3%) to €1,547 million (Q2/2017: €1,510 million). Helios Spain increased sales by 28% (organic growth: 5%) to €1,553 million (H1/2017: €1,218 million), mainly due to the additional month of consolidation compared to the prior-year period (Quirónsalud is consolidated since February 1, 2017). In Q2/2018 Helios Spain increased sales by 9% (organic growth: 8%) to €796 million (Q2/2017: €728 million).
Fresenius Helios grew EBIT by 6% to €571 million (H1/2017: €537 million) with a margin of 12.2% (H1/2017: 12.6%). In Q2/2018, EBIT increased by 4% to €293 million (Q2/2017: €282 million) with a margin of 12.5% (Q2/2017: 12.6%).
EBIT of Helios Germany decreased by 4% to €345 million (H1/2017: €359 million) with a margin of 11.1% (H1/2017: 11.8%). The decline is mainly due to additional catalogue effects, preparatory structural activities for anticipated regulatory requirements (i.e. clustering) as well as a lack of privatization opportunities in the German market. In Q2/2018, EBIT decreased by 6% to €168 million (Q2/2017: €178 million) with a margin of 10.9% (Q2/2017: 11.8%).
EBIT of Helios Spain increased by 28% to €227 million (H1/2017: €178 million), mainly due to the additional month of consolidation compared to the prior-year period, with a margin of 14.6% (H1/2017: 14.6%). In Q2/2018, EBIT increased by 19% to €124 million (Q2/2017: €104 million) with a margin of 15.6% (Q2/2017: 14.3%).
Net income1 of Fresenius Helios increased by 4% to €388 million (H1/2017: €373 million). In Q2/2018, net income1 increased by 3% to €197 million (Q2/2017: €192 million).
Operating cash flow was €259 million (H1/2017: €304 million) with a margin of 5.5% (H1/2017: 7.1%).
The already announced transfer of the in-patient post-acute care business from Fresenius Helios to Fresenius Vamed has become effective as of July 1, 2018. As a consequence, Fresenius Helios’ EBIT growth outlook for 2018 was adjusted to 5% to 8% (previously: 7% to 10%).
Fresenius Helios confirms its outlook for 2018 and expects organic sales growth of 3% to 6% and EBIT growth of 5% to 8%.
1 Net income attributable to shareholders of Fresenius SE & Co. KGaA
Fresenius Vamed
Fresenius Vamed manages projects and provides services for hospitals and other health care facilities worldwide and is a post-acute care provider in Central Europe. The portfolio ranges along the entire value chain: from project development, planning, and turnkey construction, via maintenance and technical management, to total operational management.

- Service business with continued good momentum: 11% sales growth in Q2
- Project business with good order intake of €195 million in Q2
- Transfer of inpatient post-acute care business from Helios Germany to Vamed as of July 1, 2018
- 2018 outlook confirmed
Sales increased by 7% (7% in constant currency) to €515 million (H1/2017: €481 million). Organic sales growth was 5%. Sales in the project business increased by 4% to €191 million (H1/2017: €184 million). Sales in the service business grew by 9% to €324 million (H1/2017: €297 million). In Q2/2018, sales increased by 3% (organic growth: 1%) to €266 million (Q2/2017: €258 million).
EBIT increased by 6% to €18 million (H1/2017: €17 million) with a margin of 3.5% (H1/2017: 3.5%). In Q2/2018, EBIT increased by 9% to €12 million (Q2/2017: €11 million) with a margin of 4.5% (Q2/2017: 4.3%).
Net income1 of €11 million was unchanged from prior-year’s level. In Q2/2018, net income1 was also unchanged at €7 million.
Order intake increased by 10% to €455 million (H1/2017: €412 million). As of June 30, 2018, order backlog was €2,372 million (December 31, 2017: €2,147 million).
The already announced transfer of the in-patient post-acute care business from Fresenius Helios to Fresenius Vamed has become effective as of July 1, 2018. As a consequence, Fresenius Vamed’s EBIT growth outlook for 2018 was adjusted to 32% to 37% (previously: 5% to 10%).
Fresenius Vamed confirms its outlook for 2018 and expects organic sales growth in the range of 5% to 10% and EBIT growth of 32% to 37%.
1 Net income attributable to shareholders of VAMED AG
Conference Call
As part of the publication of the results for the second quarter / first half of 2018, a conference call will be held on July 31, 2018 at 2 p.m. CET (8 a.m. EST). All investors are cordially invited to follow the conference call in a live broadcast over the Internet at www.fresenius.com/investors. Following the call, a replay will be available on our website.
For additional information on the performance indicators used please refer to our website https://www.fresenius.com/alternative-performance-measures
This release contains forward-looking statements that are subject to various risks and uncertainties. Future results could differ materially from those described in these forward-looking statements due to certain factors, e.g. changes in business, economic and competitive conditions, regulatory reforms, results of clinical trials, foreign exchange rate fluctuations, uncertainties in litigation or investigative proceedings, and the availability of financing. Fresenius does not undertake any responsibility to update the forward-looking statements in this release.
-
At the Annual General meeting in Frankfurt today, Stephan Sturm, CEO of Fresenius, confirmed the global health care group’s 2018 targets. -
![]()
Shareholders approved with a majority of 89.2 percent the proposal of the General Partner and the Supervisory Board to increase the dividend for the 25th consecutive time. Download Image (JPG 930 KB) -
![]()
At the Annual General Meeting, 73 percent of the subscribed capital was represented. Download Image (JPG 1.34 MB) -
![]()
“Fresenius has been highly successful over many years. And Fresenius will continue to be highly successful in the coming years,” Sturm said in his speech to shareholders. Download Image (JPG 1.61 MB)
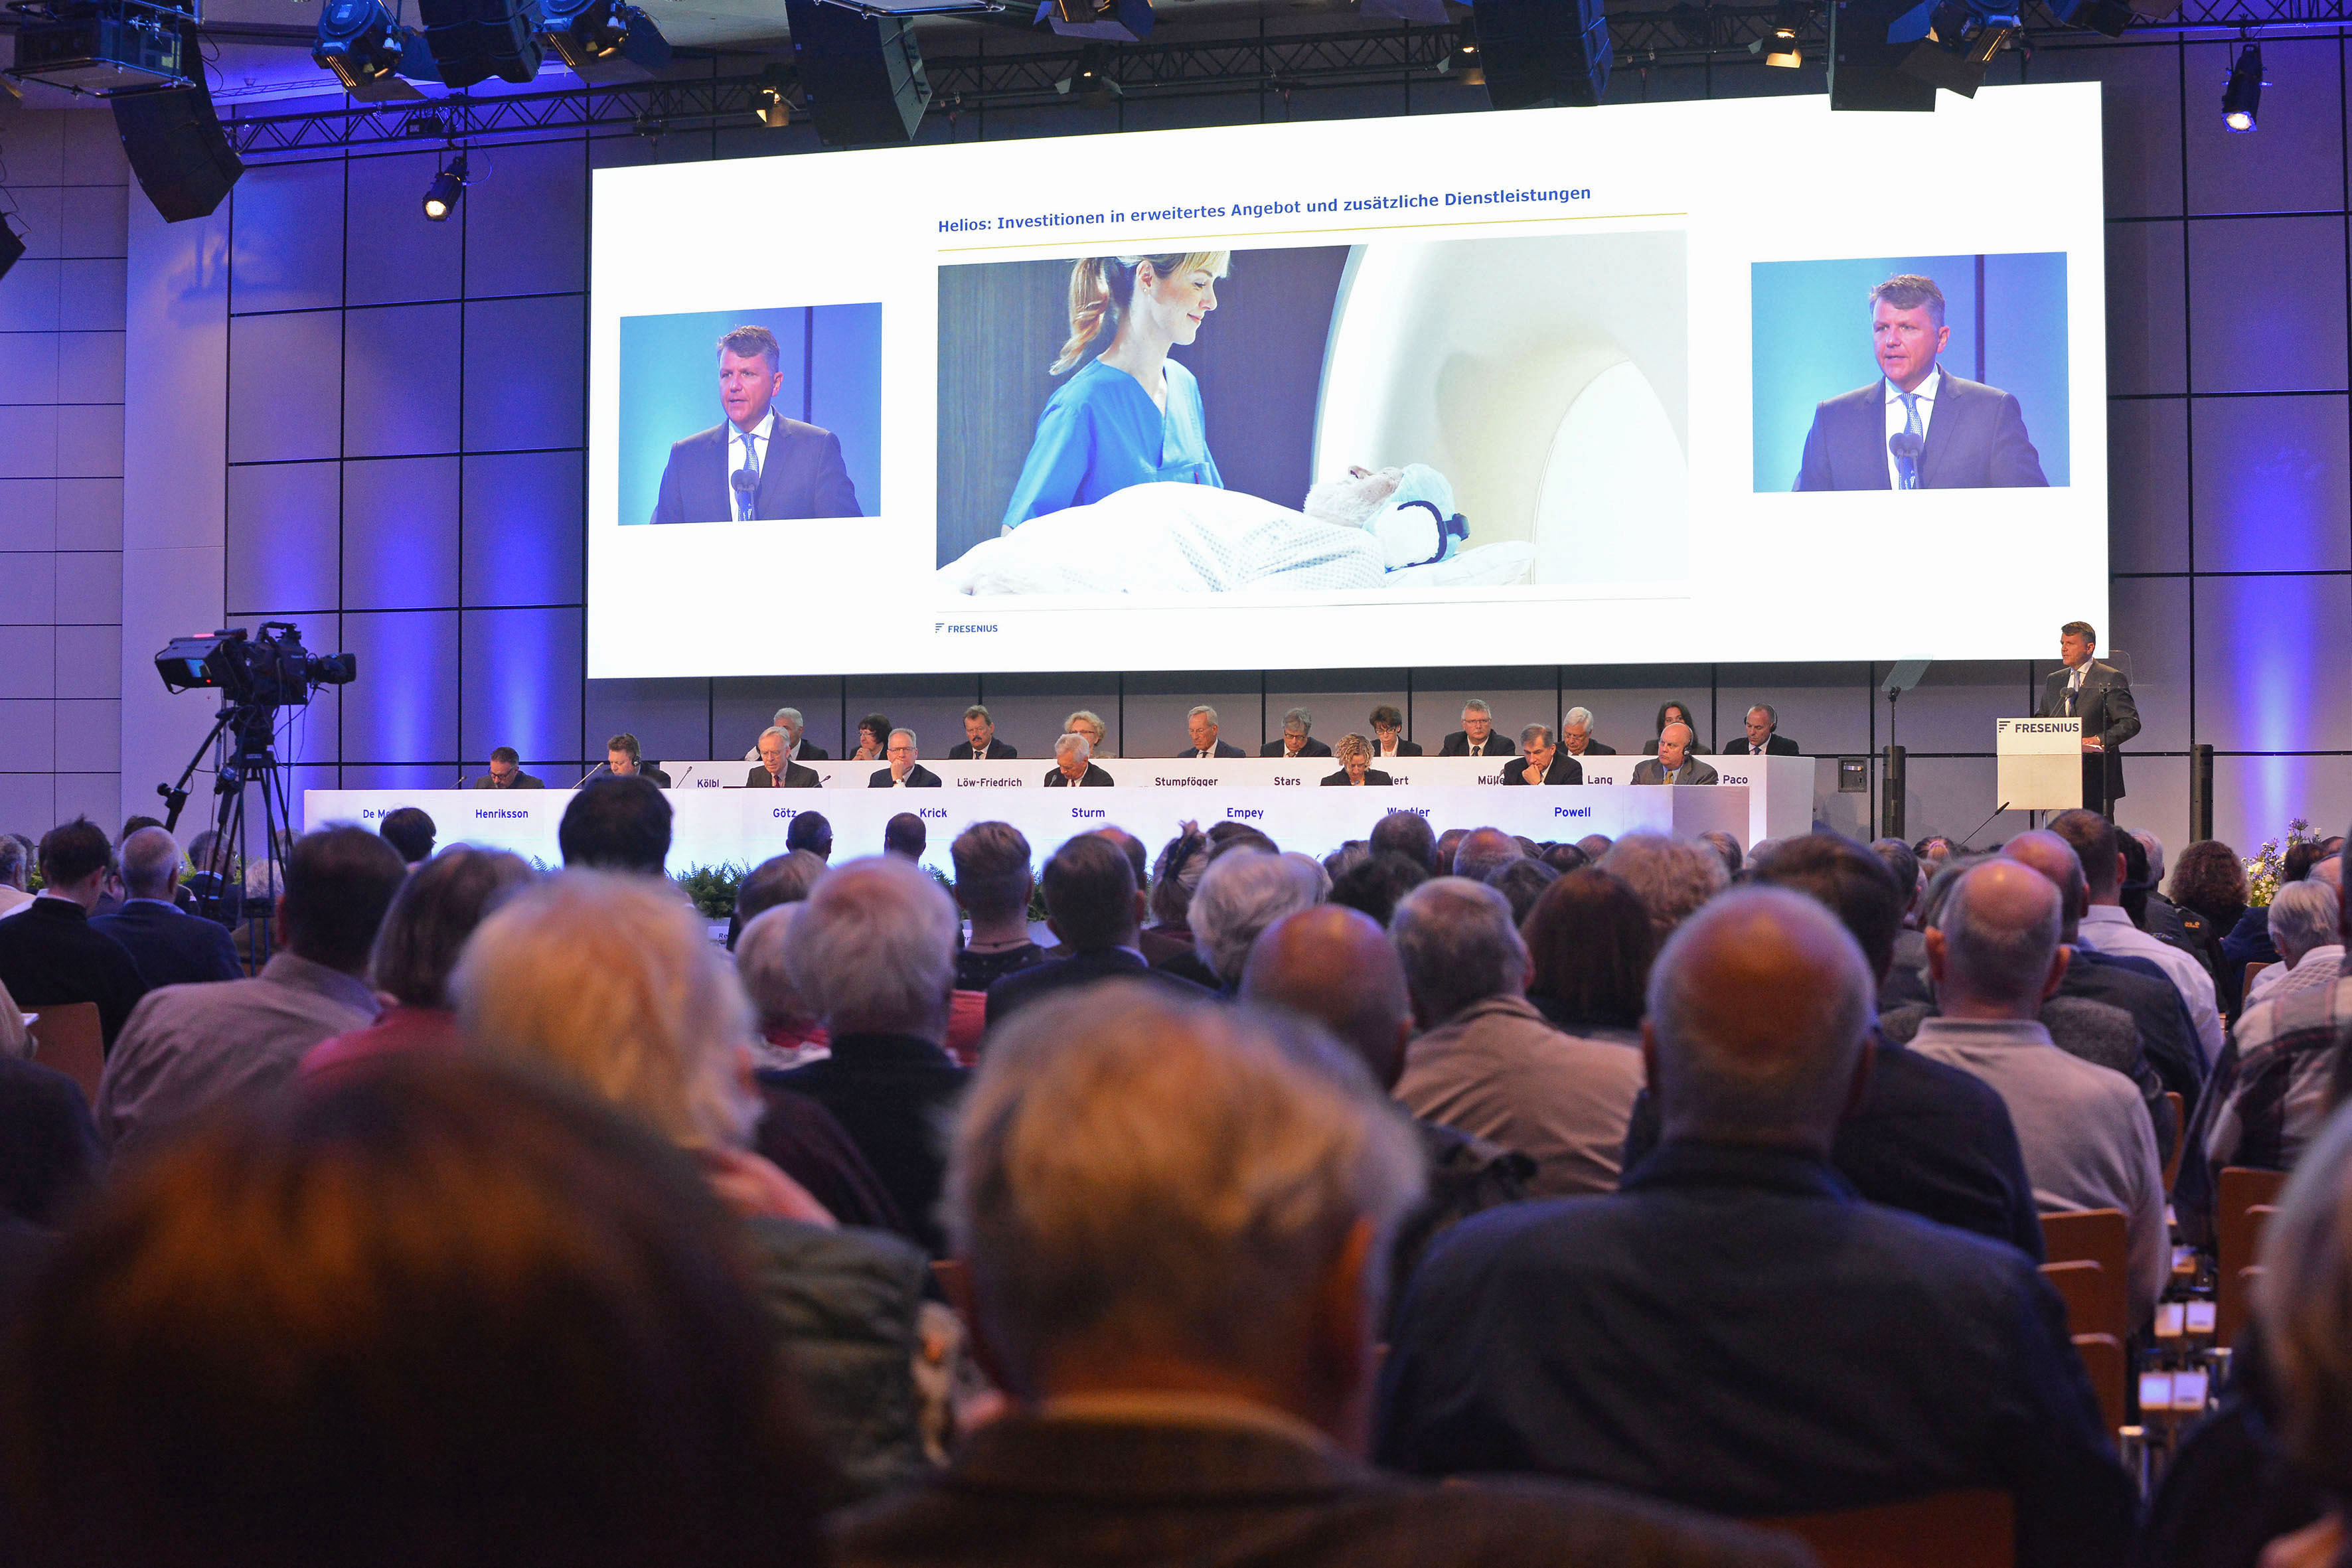
Fresenius remains on track to continue strong growth. At the Annual General meeting in Frankfurt today, Stephan Sturm, CEO of Fresenius, confirmed the global health care group’s 2018 targets, which foresee increases of 5 to 8 percent in sales and 6 to 9 percent in net income1,2, both in constant currency. Excluding the investments for the development of the biosimilars business, net income1 is expected to increase by about 10 to 13 percent in constant currency.
“Fresenius has been highly successful over many years. And Fresenius will continue to be highly successful in the coming years,” Sturm said in his speech to shareholders. “Our entry into biosimilars. The expansion of our home dialysis activities. The internationalization of Fresenius Helios. And our huge investments to secure even more quality and efficiency in our production. These are all examples of how we are shaping our business, today, to stay successful in the future. The dynamic growth of Fresenius continues.”
Shareholders approved with a majority of 89.2 percent the proposal of the General Partner and the Supervisory Board to increase the dividend for the 25th consecutive time. It was raised by 21 percent, to €0.75 per share.
With a majority of 94.3 percent, the shareholders approved a new Authorized Capital I in the amount of €125 million. New authorizations to issue convertible bonds, to repurchase own shares, and to use equity derivatives for repurchasing own shares were also approved. In addition, the shareholders approved the revised compensation system for the members of the Management Board of the General Partner.
Shareholder majorities of 97.5 percent and 89.0 percent, respectively, approved the actions of the Management and Supervisory Boards in 2017.
At the Annual General Meeting, 73 percent of the subscribed capital was represented.
1 Net income attributable to shareholders of Fresenius SE & Co. KGaA; 2017 base: €1,859 million; 2018 before special items (i.e., transaction-related effects)
2 including expenditures for further development of biosimilars business (€43 million after tax in FY/17 and ~€120 million after tax in FY/18)
This release contains forward-looking statements that are subject to various risks and uncertainties. Future results could differ materially from those described in these forward-looking statements due to certain factors, e.g. changes in business, economic and competitive conditions, regulatory reforms, results of clinical trials, foreign exchange rate fluctuations, uncertainties in litigation or investigative proceedings, and the availability of financing. Fresenius does not undertake any responsibility to update the forward-looking statements in this release.
-

About 11,000 cubic meters of earth were moved to make way for the building, with some 2,000 truckloads of cement and 2,000 tons of steel being used in its now-completed structural shell. Download Image (JPG 2.38 MB) -
![]()
From left: Klaus Dreyer, Director Corporate Real Estate, Architect Dieter Mehlo, Mayor Alexander Hetjes, CEO Stephan Sturm and CFO Rachel Empey. Download Image (JPG 874 KB) -
![]()
The topping-out ceremony took place in the atrium of the future "EK3". Download Image (JPG 1.07 MB) -
![]()
Topping-out speech by foreman and carpenter. Download Image (JPG 927 KB) -
![]()
Local officials and business representatives joined a large number of employees for the festivities. Download Image (JPG 2.11 MB) -
![]()
The five-story, “L”-formed structure will have a total volume of more than 100,000 cubic meters (over 3.5 million cubic feet) – the equivalent of about 175 single-family homes. Download Image (JPG 2.60 MB) -
![]()
Fresenius is investing a total of about €70 million in its headquarters expansion. Download Image (JPG 1.70 MB) -
![]()
When the building opens next year it will offer modern workplaces for about 600 members of the company’s steadily growing workforce, as well as conference rooms, an additional staff canteen and a parking garage. Download Image (JPG 1.20 MB) -
![]()
With its “L” form, the five-story structure was designed to fit into the overall architectural concept alongside the two existing headquarters buildings. Download Image (JPG 6.48 MB) -
![]()
The façade will include translucent panels in the distinct design colors of the four Fresenius business segments. Download Image (JPG 5.95 MB) -
![]()
The buildings approximately 21,500 square meters (231,000 square feet) of floor space will house some 600 modern office workplaces, conference rooms, an additional staff canteen and a parking garage. Download Image (JPG 1.87 MB)
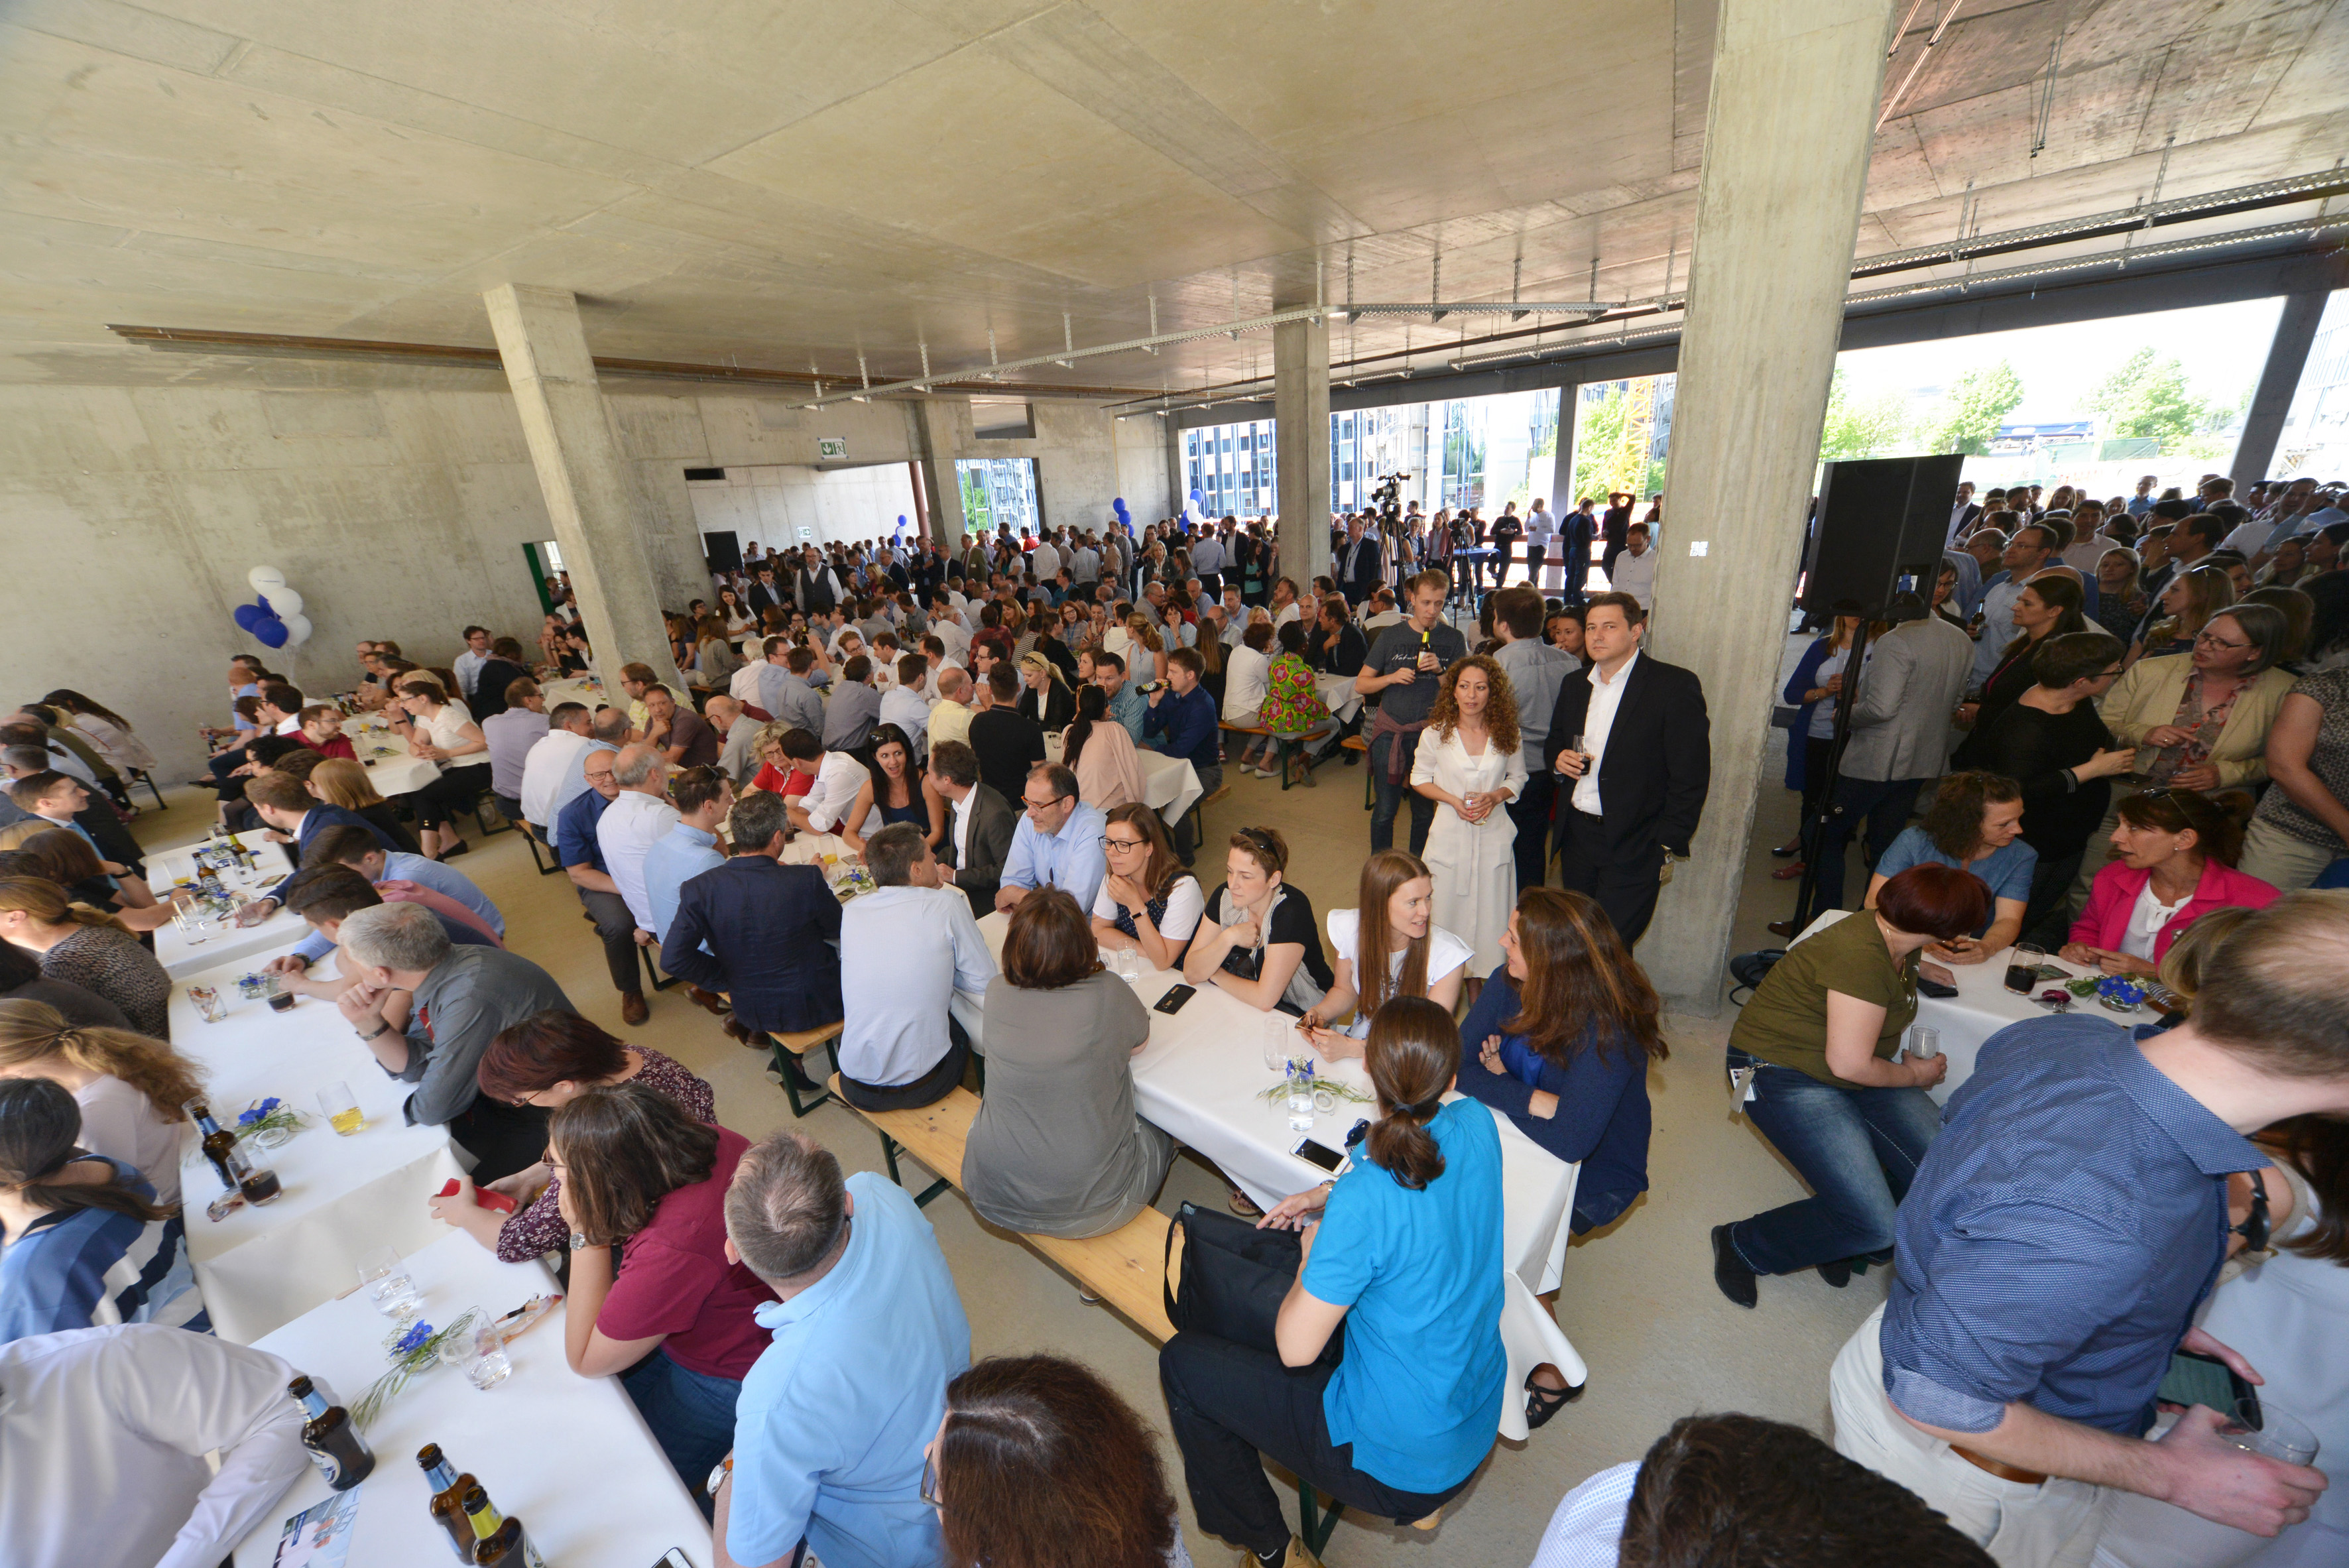

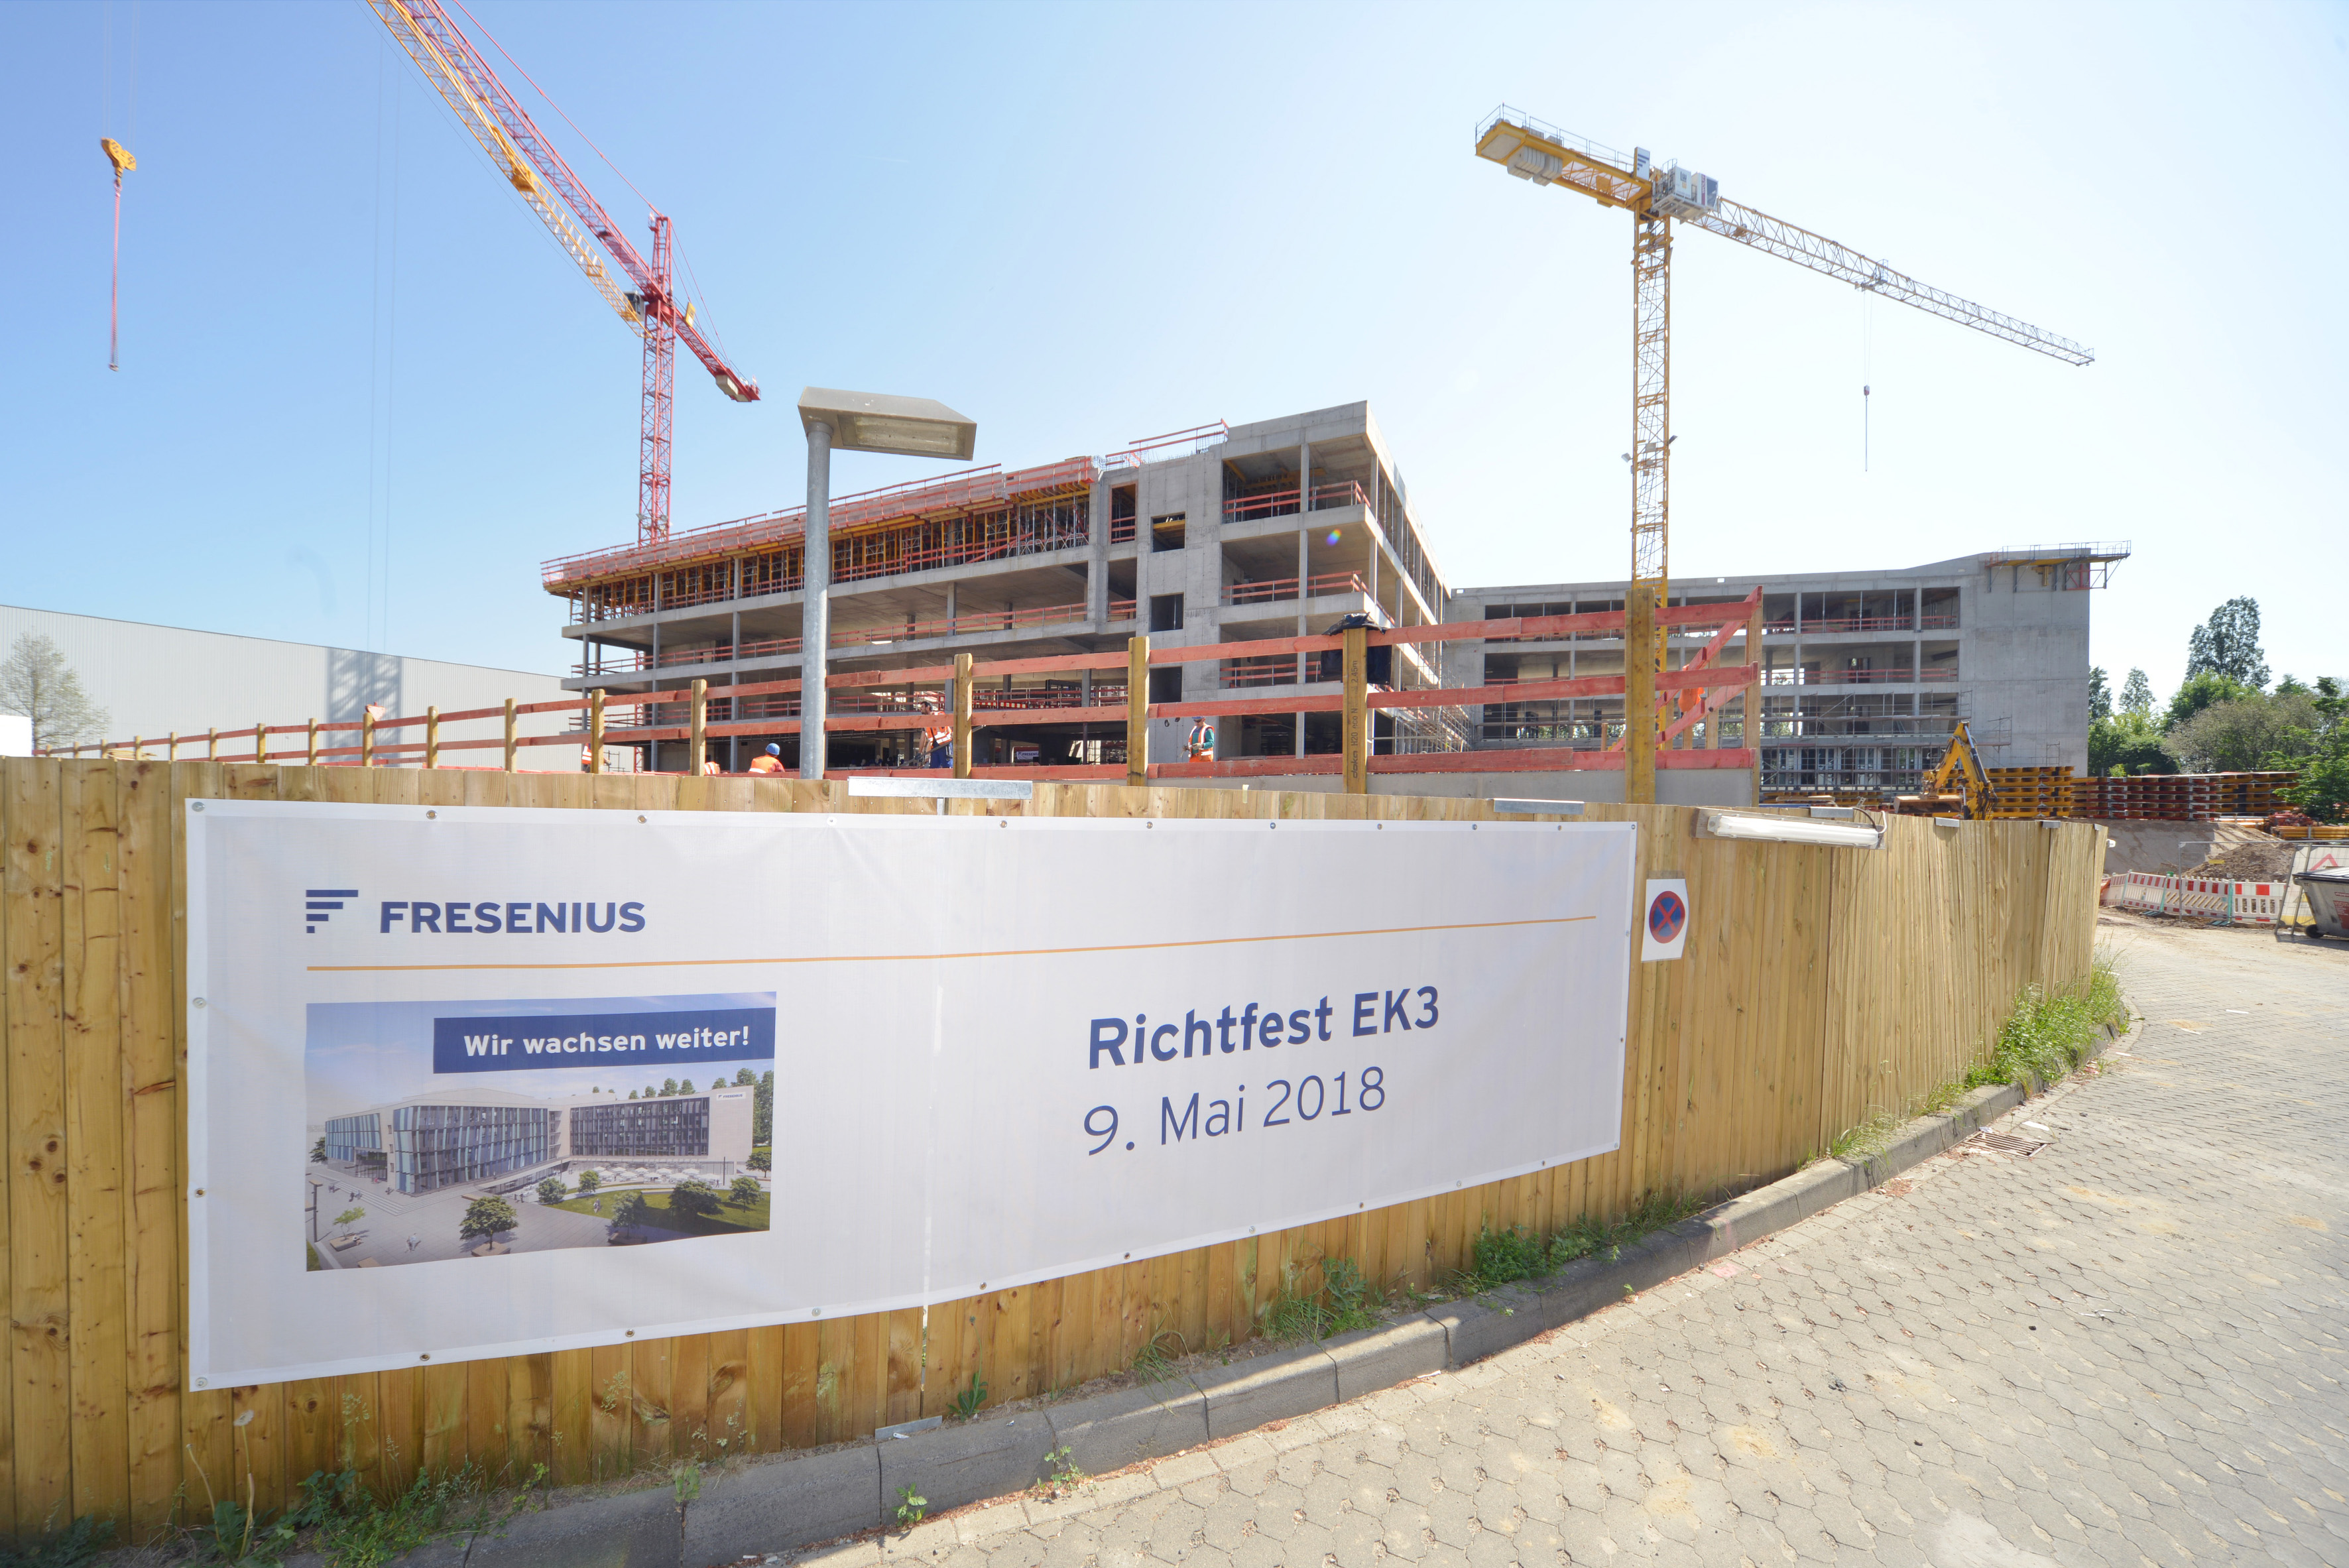
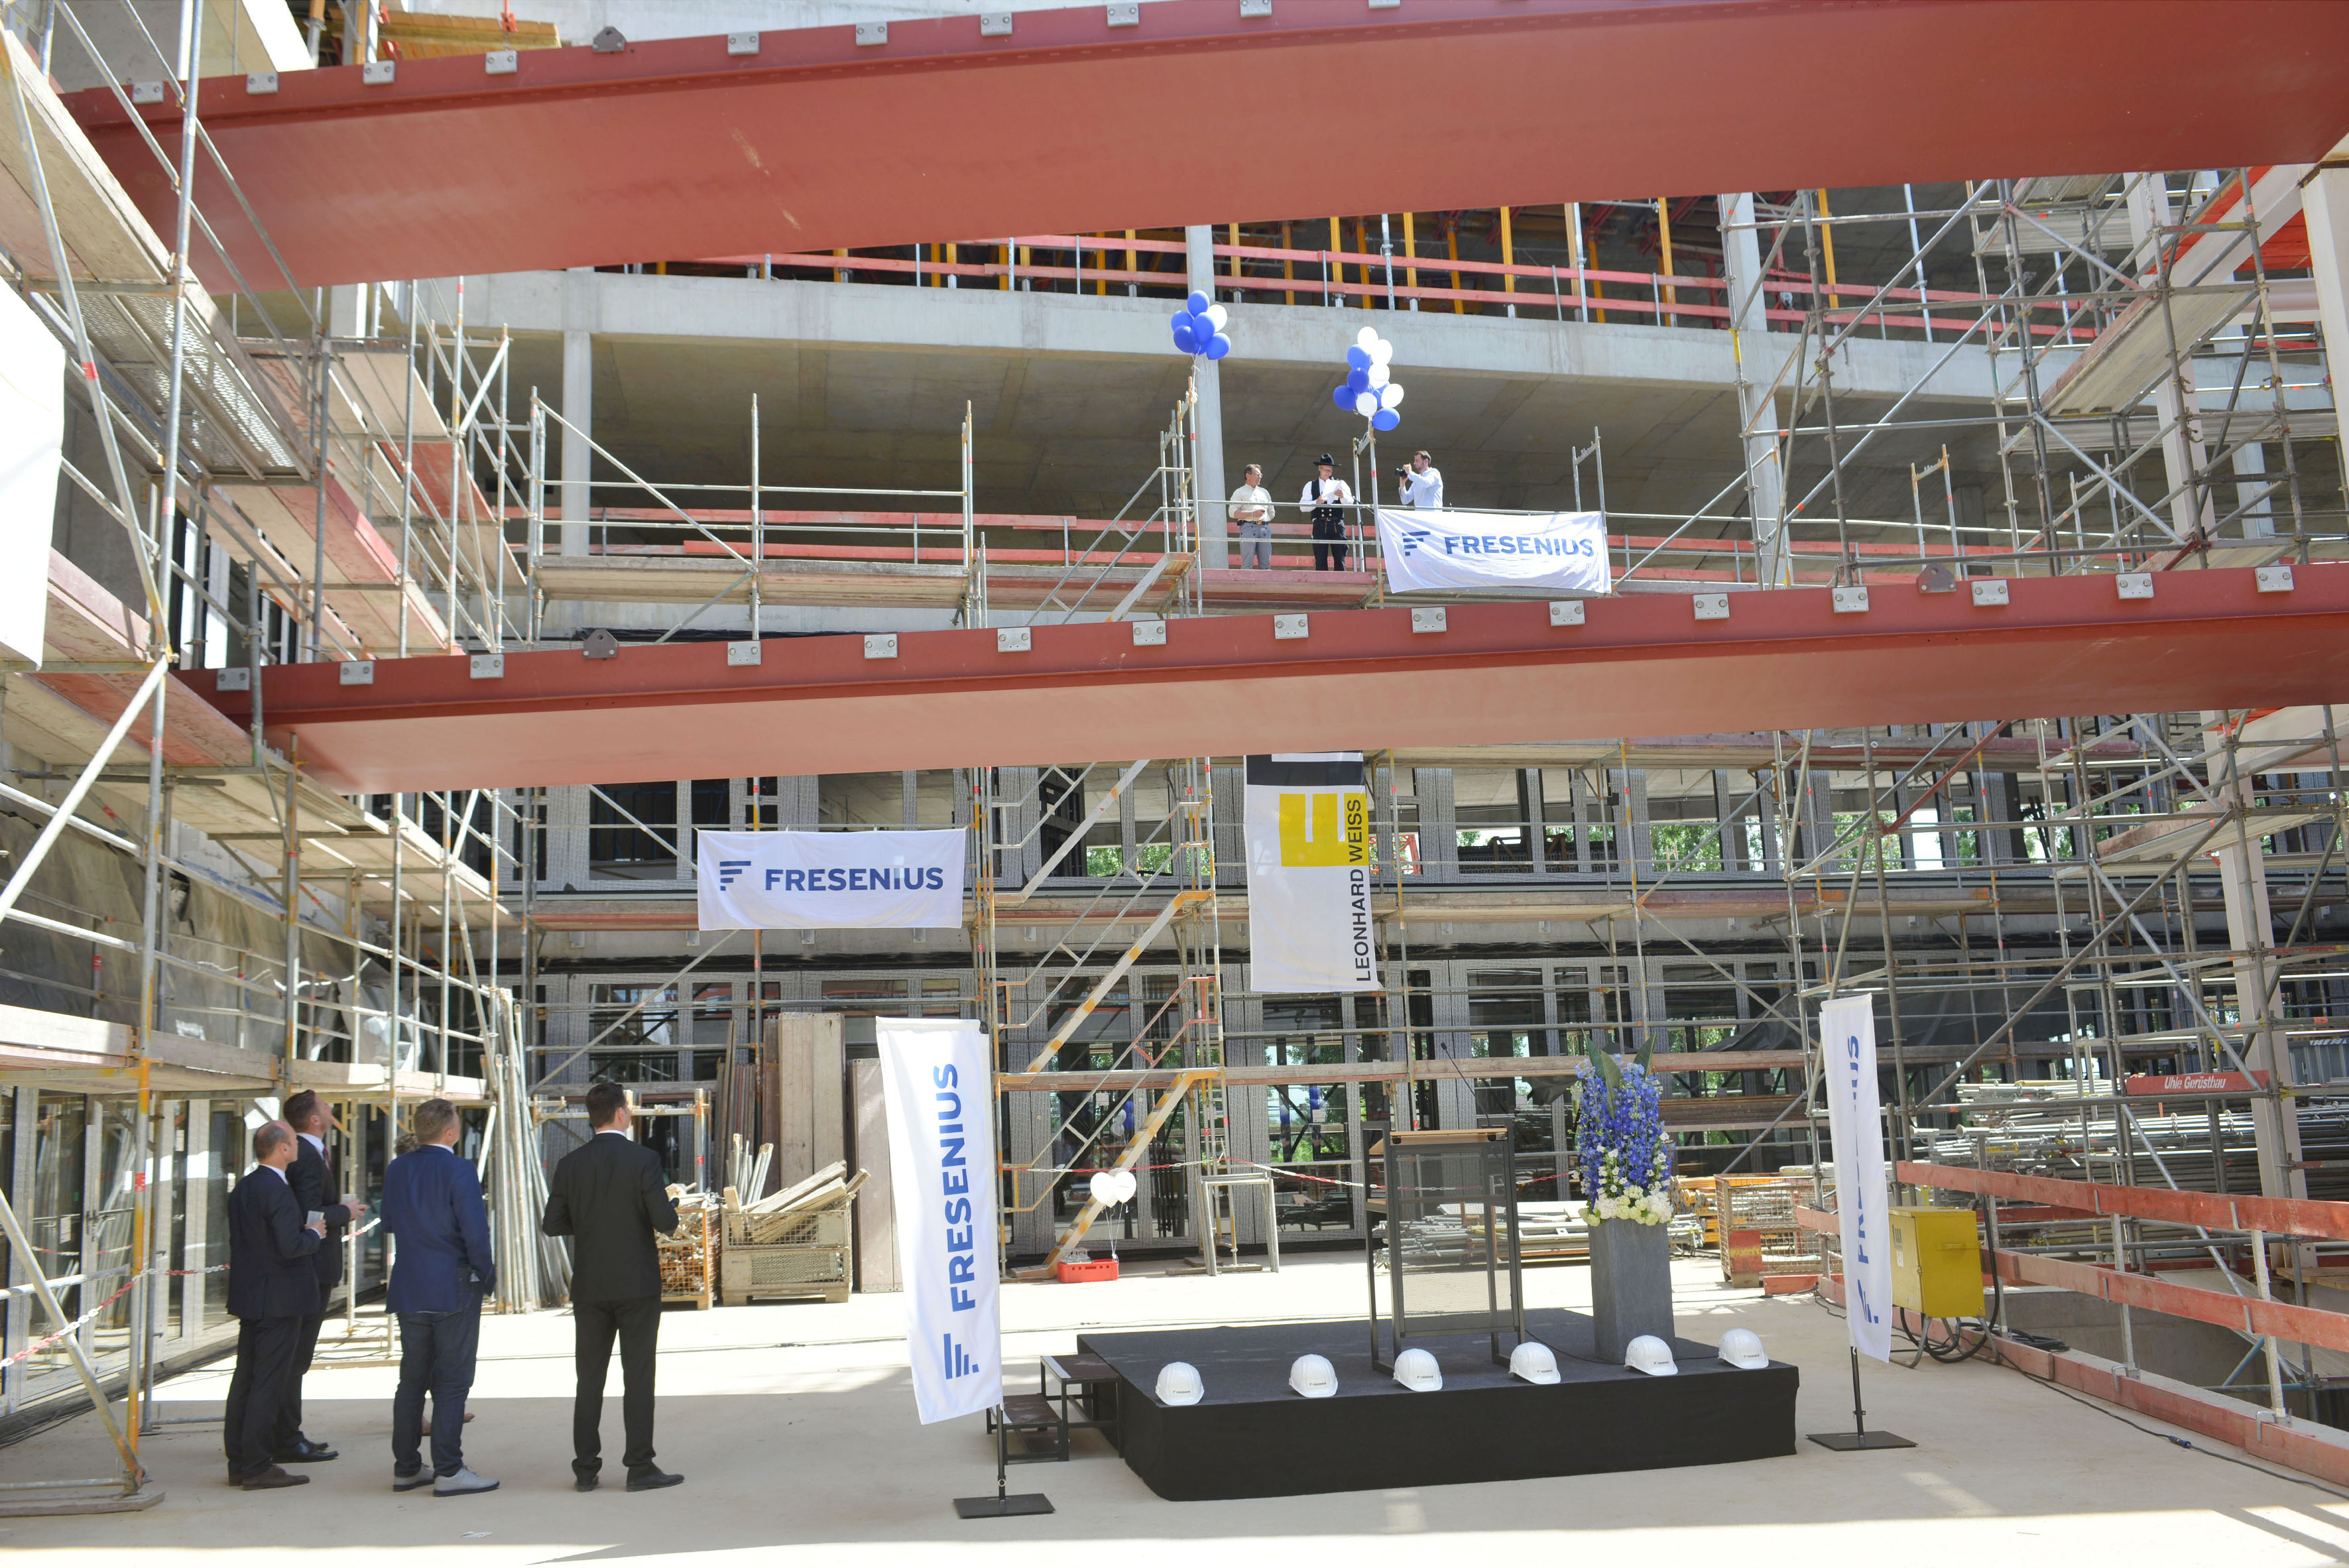
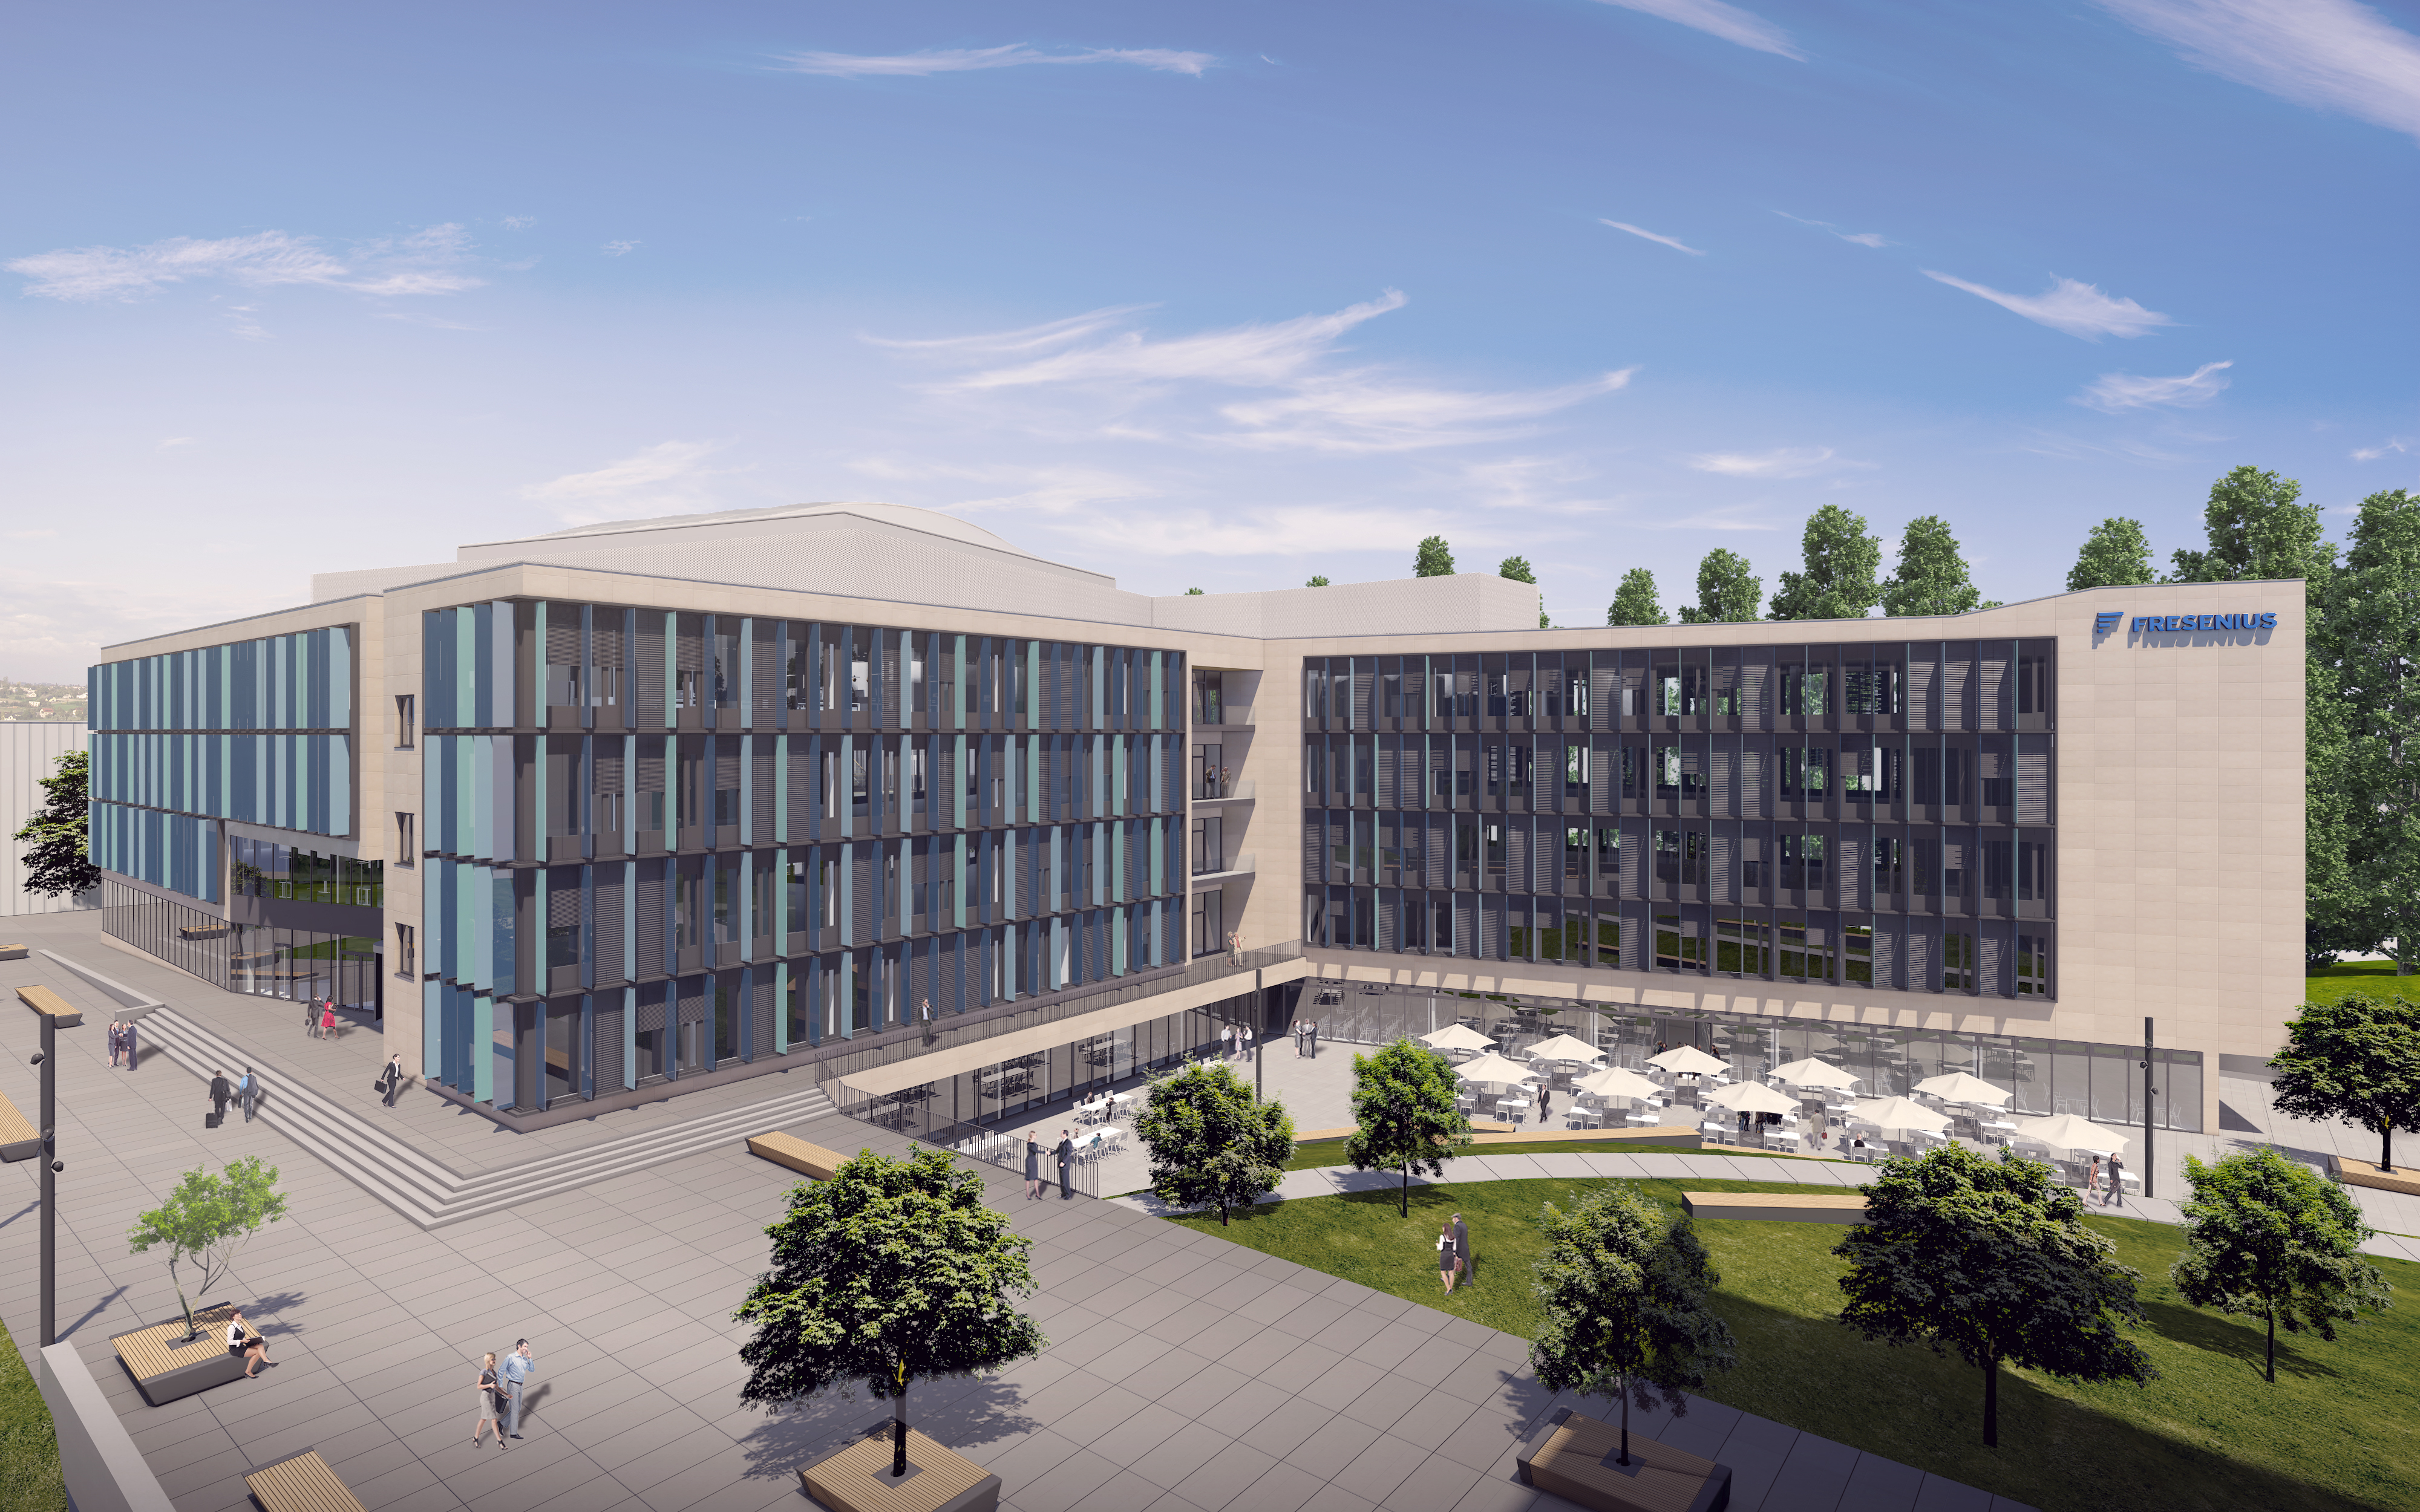

Fresenius held the topping-out ceremony today for a new office building, part of the global healthcare group’s headquarters expansion in Bad Homburg. Local officials and business representatives joined a large number of employees for the festivities.
When the building opens next year it will offer modern workplaces for about 600 members of the company’s steadily growing workforce, as well as conference rooms, an additional staff canteen and a parking garage. Known internally as “EK3” because it will be the third Fresenius headquarters building on Else-Kröner Strasse, the five-story, “L”-formed structure will have a total volume of more than 100,000 cubic meters (over 3.5 million cubic feet) – the equivalent of about 175 single-family homes. About 11,000 cubic meters of earth were moved to make way for the building, with some 2,000 truckloads of cement and 2,000 tons of steel being used in its now-completed structural shell.
Addressing the topping-out ceremony, Rachel Empey, the Chief Financial Officer of Fresenius, stressed the importance of layout and design in facilitating cooperation between colleagues inside a building. “I hope that we’ll all use this space here in EK3 to work well together, and to cooperate even more effectively in the future,” Empey said. “It’s important that we are closely interconnected throughout the Fresenius Group. Fresenius possesses an incredible amount of knowledge and know-how: We have to share it, and make it transparent inside the Group, in order to continue growing as we are now. And then we will be able to dedicate a few more buildings here in Bad Homburg.”
Mayor Alexander Hetjes of Bad Homburg said: “We congratulate Fresenius on the very rapid and smooth construction. The residents of Bad Homburg have been following the headquarters expansion with great interest. Fresenius is a major employer, a leader in its sector, and a company that organizes and stages many activities to promote good health among the people in our city. We wish the company and everyone involved every success for the rest of the construction.”
Fresenius is investing a total of about €70 million in its headquarters expansion. The company currently employs about 3,600 people in Bad Homburg, and an additional 300 in the neighboring town of Oberursel.