- Fresenius Medical Care with strong sales growth in Q1
- Fresenius Kabi with expected dip in China partially offset by spike in demand for drugs and devices for COVID-19 patients in Europe and the US
- Helios Germany supported by law to ease financial burden on hospitals
- Helios Spain’s significant contribution to combat COVID-19 faces reimbursement uncertainties
- Fresenius Vamed with solid Q1, however already marked by COVID-19 related post-acute patient losses and project delays
- Original guidance for 2020 excluding any effects of the COVID-19 pandemic maintained; Guidance update to include COVID-19 effects expected with Q2/20 financial results
- Group financial position remains strong

Stephan Sturm, CEO of Fresenius, said: “The COVID-19 pandemic has created unprecedented challenges for Fresenius. We are doing everything we can to continue providing the best possible care for our patients around the world. The last few weeks have shown that we have a crucial role to play in the health care systems around the world, and never more so than at a time of crisis. Our success to date is due, above all, to the tremendous dedication and commitment of our employees. Our solid first-quarter business results demonstrate the resilience of our operations and business models. It is, however, too early to say with any certainty what impact COVID-19 will have on the company’s full business year. What can be said with certainty is that we will keep working hard for our patients, and will continue to make an important contribution to overcoming this pandemic.”
Group guidance for FY/20 – Impact of COVID-19 on outlook cannot be reliably assessed at this time
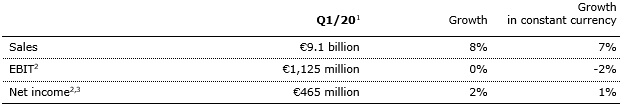
Fresenius’ FY guidance published on February 20, 2020 did not take into account effects of the COVID-19 pandemic. It projected sales growth1 of 4% to 7% in constant currency and net income growth2,3 of 1% to 5% in constant currency. Fresenius anticipates that, following the solid start to the year, COVID-19 will continue to impact its business; at this time, however, a reliable assessment and quantification of the positive and negative effects is not possible. The Group hence maintains its original guidance, excluding any COVID-19 effects. Fresenius will revisit this guidance when communicating its Q2/20 results with the aim to incorporate a reliable assessment of COVID-19 effects.
This approach also applies for the Group’s net debt/EBITDA target. The original guidance, excluding effects of the COVID-19 pandemic, projects net debt/EBITDA4 to be towards the top-end of the self-imposed target corridor of 3.0x to 3.5x at the end of 2020.
Fresenius expects to see a more pronounced negative COVID-19 effect on its financial results in the second quarter than in the first quarter of 2020.
7% sales growth in constant currency
Group sales increased by 8% (7% in constant currency) to €9,135 million in Q1/20 (Q1/19: €8,495 million) driven by all business segments. COVID-19 had only a slight negative effect on sales growth. Organic sales growth was 5%. Acquisitions/divestitures contributed net 2% to growth. Positive currency translation effects of 1% were mainly driven by the U.S. dollar strengthening against the euro.
1% net income1,2 growth in constant currency
Group EBITDA increased by 3% (2% in constant currency) to €1,755 million (Q1/191: €1,701 million).
Group EBIT remained on prior year’s level (-2% in constant currency) at €1,125 million (Q1/191: €1,130 million), impacted by negative COVID-19 effects. At Fresenius Kabi additional demand for drugs and devices to treat COVID-19 patients late in the quarter only partially offset the anticipated headwinds in China during most of the quarter. Helios Spain also faced very significant negative COVID-19 effects in March, mainly at its private hospital and ORP businesses. The EBIT margin was 12.3% (Q1/191: 13.3%).
Group net interest before special items improved to -€174 million in Q1/20 (Q1/19: -€181 million) mainly due to successful refinancing activities. Reported Group net interest improved to -€182 million (Q1/19: -€184 million).
The Group tax rate before special items was 22.6% (Q1/19: 23.3%). The reported Group tax rate was 22.6% (Q1/19: 23.3%).
Noncontrolling interest before special items was -€271 million (Q1/19: -€271 million), of which 96% was attributable to the noncontrolling interest in Fresenius Medical Care. Reported Group noncontrolling interest was -€271 million (Q1/19: -€261 million).
Group net income1 before special items increased by 2% (1% in constant currency) to €465 million (Q1/19: €457 million). Reported Group net income1 was €459 million (Q1/19: €453 million). COVID-19 had a significant negative effect on net income growth.
Earnings per share1 before special items increased by 1% (1% in constant currency) to €0.83 (Q1/19: €0.82). Reported earnings per share1 were €0.82 (Q1/19: €0.81).
Continued investment in growth
Spending on property, plant and equipment was €547 million corresponding to 6% of sales (Q1/19: €441 million; 5% of sales). The investments in Q1/20 served primarily for the modernization and expansion of dialysis clinics, production facilities as well as hospitals, and day clinics. Subject to duration and magnitude of the COVID-19 pandemic, Fresenius may face delays of investment projects planned for 2020.
Total acquisition spending was €412 million (Q1/19: €1,923 million), mainly for the acquisition of two hospitals in Colombia by Fresenius Helios.
Cash flow development
Group operating cash flow increased to €878 million (Q1/19: €289 million) with a margin of 9.6% (Q1/19: 3.4%). Growth was driven by a favorable working capital development at both Fresenius Medical Care and Fresenius Kabi. Free cash flow before acquisitions and dividends was €305 million (Q1/19: -€168 million). Free cash flow after acquisitions and dividends was -€40 million (Q1/19: -€2,111 million, driven by the acquisition of NxStage by Fresenius Medical Care).
Solid balance sheet structure
Group total assets increased by 3% (3% in constant currency) to €68,972 million (Dec. 31, 2019: €67,006 million). Current assets increased by 7% (8% in constant currency) to €16,341 million (Dec. 31, 2019: €15,264 million). Non-current assets increased by 2% (1% in constant currency) to €52,631 million (Dec. 31, 2019: €51,742 million).
Total shareholders’ equity increased by 1% (1% in constant currency) to €26,956 million (Dec. 31, 2019: €26,580 million). The equity ratio was 39.1%.
Group debt increased by 5% (4% in constant currency) to €28,557 million (Dec. 31, 2019: €?27,258 million). Group net debt increased by 4% (3% in constant currency) to €?26,529 million (Dec. 31, 2019: €?25,604 million) driven by the closing of two hospital acquisitions in Colombia by Fresenius Helios and execution of the share buy-back program at Fresenius Medical Care as well as currency translation effects.
As of March 31, 2020, the net debt/EBITDA ratio increased to 3.68x1,2 (Dec. 31, 2019: 3.61x1,2) mainly due to the acquisitions made by Fresenius Helios, the share-buy back program at Fresenius Medical Care and negative COVID-19 effects on EBITDA.
Increased number of employees
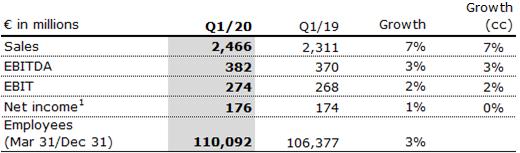
As of March 31, 2020, the number of employees was 299,594 (Dec. 31, 2019: 294,134).
Business Segments
Fresenius Medical Care (Financial data according to Fresenius Medical Care press release)
Fresenius Medical Care is the world's largest provider of products and services for individuals with renal diseases. As of March 31, 2020, Fresenius Medical Care was treating 348,703 patients in 4,002 dialysis clinics. Along with its core business, the company provides related medical services in the field of Care Coordination.

- 9% revenue increase supported by growth in all regions
- Solid cash-flow development
- Financial targets confirmed
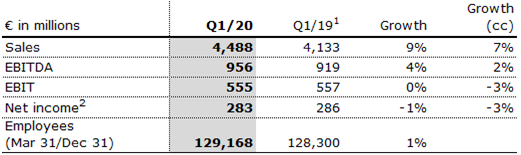
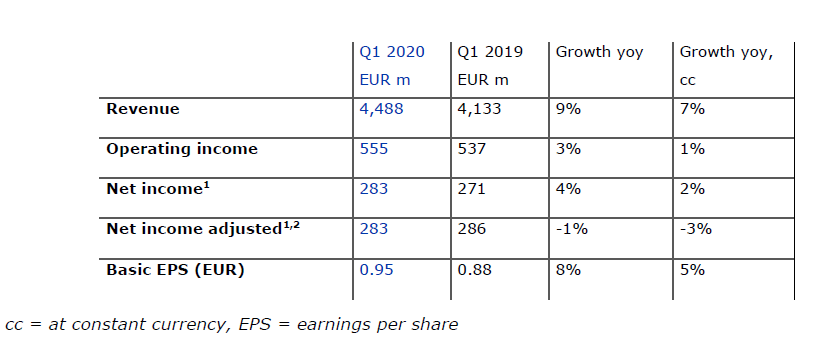
Fresenius Medical Care increased sales by 9% (7% in constant currency) to €4,488 million (Q1/19: €4,133 million). Organic sales growth was 4%. Positive currency translation effects of 2% were mainly related to the U.S. dollar strengthening against the euro.
Reported EBIT increased by 3% (1% in constant currency) to €555 million (Q1/19: €537 million) mainly driven by a favorable impact from higher treatment volume and lower costs for pharmaceuticals. The reported EBIT margin was 12.4% (Q1/19: 13.0%). The decrease in margin was largely due to the unfavorable COVID-19 pandemic effect and the prior year reduction of a contingent consideration liability related to Xenios. EBIT on an adjusted basis was flat (decreased by 3% in constant currency) at €555 million (Q1/19: €557 million). The EBIT margin on an adjusted basis was 12.4% (Q1/19: 13.5%).
Reported net income1 grew by 4% (2% in constant currency) to €283 million (Q1/19: 271 million) and decreased on an adjusted basis by 1% (-3% in constant currency) to €283 million (Q1/19: €286 million).
Operating cash flow was €584 million (Q1/19: €76 million) with a margin of 13.0% (Q1/19: 1.8%). The increase was largely driven by working capital improvement, including a positive effect from cash collections, timing of payments and change in year over year inventory levels.
Fresenius Medical Care’s FY guidance published on February 20, 2020 did not take into account COVID-19 effects. Since it is too early to reliably assess and quantify the positive and negative effects of the COVID-19 pandemic, the Company confirms its 2020 outlook of expected sales2 and net income1,3 growth both within a mid to high single digit percentage range in constant currency. These targets are based on the adjusted results 2019 including the effects of the operations of the NxStage acquisition and the IFRS 16 implementation.
For further information, please see Fresenius Medical Care’s press release at www.freseniusmedicalcare.com.
Fresenius Kabi
Fresenius Kabi offers intravenously administered generic drugs, clinical nutrition and infusion therapies for seriously and chronically ill patients in the hospital and outpatient environments. The company is also a leading supplier of medical devices and transfusion technology products. In the biosimilars business, Fresenius Kabi develops products with a focus on oncology and autoimmune diseases.

- Insignificant COVID-19 effect on sales growth, moderate negative effect on EBIT growth
- Anticipated softer demand in China during most of Q1/20 due to fewer elective surgeries followed by gradual resumption towards normal operations late in the quarter
- Increased demand for essential drugs and devices for the treatment of COVID-19 patients in North America and Europe late in Q1/20
- No major interruption at any production site
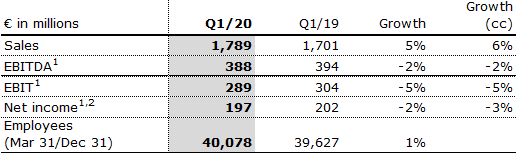
Fresenius Kabi increased sales by 5% (6% in constant currency) to €1,789 million (Q1/19: €1,701 million). Organic sales growth was 6%. Negative currency translation effects of 1% were mainly related to weakness of the Argentinian peso and the Brazilian real.
Sales in North America increased by 7% (organic growth: 5%) to €669 million (Q1/19: €623 million). Sales in Europe grew by 10% (organic growth: 10%) to €631 million (Q1/19: €573 million). In both regions, sales were driven by a spike of demand for sedation drugs, pain killers and infusion pumps starting late in Q1/20.
Sales in Asia-Pacific decreased by 6% (organic growth: -6%) to €319 million (Q1/19: €341 million). As anticipated, softer demand for clinical nutrition products and IV drugs in China was driven by the COVID-19 related postponement of elective treatments.
Sales in Latin America/Africa increased by 4% (organic growth: 16%) to €170 million (Q1/19: €164 million).
EBIT before special items decreased by 5% (-5% in constant currency) to €289 million (Q1/191: €304 million) with an EBIT margin of 16.2% (Q1/191: 17.9%). The COVID-19 pandemic had a moderate net negative effect on EBIT.
Net income1,2 decreased by 2% (-3% in constant currency) to €197 million (Q1/19: €202 million).
Operating cash flow was €174 million (Q1/19: €145 million) with a margin of 9.7% (Q1/19: 8.5%), driven by an improved working capital position.
Since it is too early to reliably assess and quantify the positive and negative effects of the COVID-19 pandemic, Fresenius Kabi maintains its 2020 outlook of expected organic sales3 growth of 3% to 6% and an EBIT4 development of -4% to 0% in constant currency, excluding any effects from COVID-19.
Fresenius Helios
Fresenius Helios is Europe's leading private hospital operator. The company comprises Helios Germany and Helios Spain (Quirónsalud). Helios Germany operates 86 hospitals, ~125 outpatient centers and 7 prevention centers. Quirónsalud operates 46 hospitals, 72 outpatient centers and around 300 occupational risk prevention centers. In addition, the company is active in Latin America with 6 hospitals and as a provider of medical diagnostics.
- Strong business development in January and February; from March, postponement and cancellation of elective treatments
- Excluding slight negative COVID-19 effect, Q1/20 sales growth moderately above outlook range; significant negative COVID-19 effect on EBIT
- Law to ease financial burden on hospitals to offset large part of COVID-19 related sales losses and cost increases in Germany
- Some remaining uncertainties regarding the compensation of Spanish hospitals for their efforts to combat the COVID-19 pandemic
Fresenius Helios increased sales by 7% (organic growth: 5%) to €2,466 million (Q1/19: €2,311 million).
Sales of Helios Germany increased by 8% (organic growth: 8%) to €1,603 million (Q1/19: €1,485 million). Organic sales growth was positively influenced by pricing effects and admissions growth in January and February. From March, COVID-19 had an insignificant net effect as foregone sales from elective admissions were largely offset by the law to ease the financial burden on hospitals.
Sales of Helios Spain increased by 4% (organic growth: 1%) to €863 million (Q1/19: €826 million) driven by the recent hospital acquisitions in Colombia. COVID-19 related foregone elective surgeries significantly weighed on organic sales growth from March.
EBIT of Fresenius Helios increased by 2% to €274 million (Q1/19: €268 million) with an EBIT margin of 11.1% (Q1/19: 11.6%).
EBIT of Helios Germany increased by 11% to €165 million (Q1/19: €149 million) with an EBIT margin of 10.3% (Q1/19: 10.0%). EBIT was positively influenced by pricing effects and admissions growth in January and February. From March, COVID-19 had an insignificant net effect as foregone EBIT from elective admissions was largely offset by the law to ease the financial burden on hospitals.
EBIT of Helios Spain decreased by 7% to €112 million (Q1/19: €121 million) with an EBIT margin of 13.0% (Q1/19: 14.6%). January and February showed positive admission growth. From March, COVID-19 had a very significant negative effect on EBIT as foregone elective treatments met higher costs amidst the comprehensive efforts to combat the pandemic.
Net income1 increased by 1% to €176 million (Q1/19: €174 million).
Operating cash flow increased to €145 million (Q1/19: €103 million) with a margin of 5.9% (Q1/19: 4.5%), driven by a good operating performance in both regions.
Since it is too early to reliably assess and quantify the positive and negative effects of the COVID-19 pandemic, Fresenius Helios maintains its 2020 outlook of expected organic sales2 growth of 3% to 6% and EBIT3 growth of 3% to 7% in constant currency, excluding any effects from COVID-19.
Fresenius Vamed
Fresenius Vamed manages projects and provides services for hospitals and other health care facilities worldwide and is a leading post-acute care provider in Central Europe. The portfolio ranges along the entire value chain: from project development, planning, and turnkey construction, via maintenance and technical management to total operational management.

- Both project and service business contributing to organic sales growth of 10%
- Slight negative COVID-19 effect on sales, very significant negative effect on EBIT growth
- Post-acute care services impacted by COVID-19 related postponements of elective surgeries and health authority enforced closures of rehabilitation clinics; technical services insignificantly impacted by COVID-19
- Further COVID-19 related delays of project business orders and execution expected throughout 2020
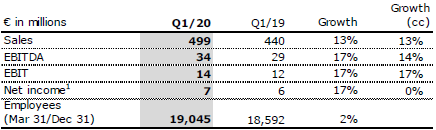
Fresenius Vamed increased sales by 13% to €499 million (Q1/19: €440 million). Organic sales growth was 10%. Acquisitions contributed 3% to growth. Both service and project business showed strong growth momentum. COVID-19 had only a slight negative effect on sales.
Sales in the service business grew by 8% to €357 million (Q1/19: €332 million). Sales of the project business increased by 31% to €142 million (Q1/19: €108 million).
EBIT increased by 17% to €14 million (Q1/19: €12 million) with an EBIT margin of 2.8% (Q1/19: 2.7%). COVID-19 had a very significant negative effect on EBIT growth. Capacities in the post-acute care clinics were left idle given a generally lower intake of elective surgery patients from acute-care hospitals as well as authority-instigated restrictions or even closures of individual facilities.
Net income1 increased by 17% to €7 million (Q1/19: €6 million).
Order intake was €124 million (Q1/19: €383 million). Order intake in the prior year was exceptionally strong. As of March 31, 2020, order backlog was at €2,846 million (December 31, 2019: €2,865 million) and already marked by COVID-19 related project delays.
Operating cash flow decreased to -€20 million (Q1/19: -€15 million) with a margin of
-4.0% (Q1/19: -3.4%), given continuing phasing effects, some delays in the international project business as well as working capital build-ups.
Since it is too early to reliably assess and quantify the positive and negative effects of the COVID-19 pandemic, Fresenius Vamed maintains its 2020 outlook of expected organic sales2 growth of 4% to 7% and EBIT3 growth of 5% to 9% in constant currency, excluding any effects from COVID-19.
Conference Call
As part of the publication of the results for Q1 2020, a conference call will be held on May 6, 2020 at 1:30 p.m. CEDT (7:30 a.m. EDT). All investors are cordially invited to follow the conference call in a live broadcast over the Internet at www.fresenius.com/investors. Following the call, a replay will be available on our website.
For additional information on the performance indicators used please refer to our website https://www.fresenius.com/alternative-performance-measures.