
August 2, 2022
Fresenius publishes financial results for the second quarter and first half of 2022 in line with preliminary results
- Business development marked by significantly worsening headwinds at Fresenius Medical Care and increased macroeconomic challenges
- Fresenius Medical Care Business development impacted by unprecedented U.S. labor market situation and worsening macroeconomic environment
- Fresenius Kabi with solid organic sales growth despite tough prior-year-quarter
- Fresenius Helios with continued good admissions growth in Germany and Spain
- Fresenius Vamed still impacted by ongoing headwinds; service business supported by increasing elective treatment activity
- Cost and efficiency program evolving according to plan
If no timeframe is specified, information refers to Q2/2022.
1 Before special items, Q1/22 restated following remeasurement Humacyte investment
2 Net income attributable to shareholders of Fresenius SE & Co. KGaA
3 Excluding Ivenix acquisition
For a detailed overview of special items please see the reconciliation tables on pages 20-23 of the pdf.
FY/22 Group guidance
As announced on July 27, 2022, at constant currency, the Company now anticipates Group sales1 to grow in a low-to-mid single-digit percentage range (previously: mid-single digit percentage range) and Group net income2,3 to decline in a low-to-mid single-digit percentage range (previously: increase in a low-single-digit percentage range).
Without the already closed acquisitions of Ivenix and the already completed acquisition of a majority stake in mAbxience as well as any further potential acquisitions, Fresenius expects the net debt/EBITDA4 ratio (December 31, 2021: 3.51x5) to be slightly above the top end of the self-imposed target corridor of 3.0x to 3.5x by the end of 2022.
Assumptions for guidance FY/22
Due to the meaningfully increased uncertainty and volatility related to the war in Ukraine, the ongoing impacts of the COVID-19 pandemic, and a rapidly worsening global macro-economic development, Fresenius now expects significantly more pronounced headwinds in 2022 from supply chain disruptions and cost inflation, including energy prices. Furthermore, Fresenius expects significant negative effects from ongoing labor shortages and associated wage inflation, especially at Fresenius Medical Care in the U.S.
The war in Ukraine is directly and indirectly affecting Fresenius Group operations. The direct adverse effects of the war amounted to €20 million at net income6 level of Fresenius Group in H1/22 and are treated as a special item. Fresenius will continue to closely monitor the potential further consequences of the war, including balance sheet valuations. The guidance does not consider a significant disruption of gas or electricity supplies in Europe.
COVID-19 will continue to impact Fresenius Group operations in 2022. An unlikely but possible significant deterioration of the situation triggering containment measures that could have a significant and direct impact on the health care sector without any appropriate compensation is not reflected in the Group’s FY/22 guidance.
Furthermore, the updated assumptions for Fresenius Medical Care's FY/22 guidance are also fully applicable to Fresenius Group's FY/22 guidance. All of these assumptions are subject to considerable uncertainty. The acquisitions of Ivenix and of the majority stake in mAbxience as well as any further potential acquisitions remain excluded from guidance.
1 FY/21 base: €37,520 million
2 Net income attributable to shareholders of Fresenius SE & Co. KGaA
3 FY/21 base: €1,867 million; before special items; FY/22: before special items
4 At LTM average exchange rates for both net debt and EBITDA; pro forma closed acquisitions/divestitures; excluding further potential acquisitions; before special items; including lease liabilities
5 At LTM average exchange rates for both net debt and EBITDA; pro forma closed acquisitions/divestitures; before special items; including lease liabilities
6 Net income attributable to shareholders of Fresenius SE & Co. KGaA
For a detailed overview of special items please see the reconciliation tables on pages 20-23.
Cost and efficiency program
The Group’s cost and efficiency program is running according to plan and Fresenius confirms its increased savings targets provided in February 2022 of at least €150 million p.a. after tax and minority interest in 2023. For the years thereafter, a further significant increase in sustainable cost savings is expected.
3% sales increase in constant currency
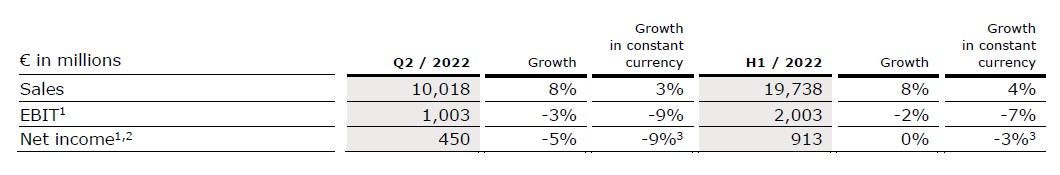
Group sales increased by 8% (3% in constant currency) to €10,018 million (Q2/21: €9,246 million). Organic growth was 2%. Acquisitions/divestitures contributed net 1% to growth. Currency translation increased sales growth by 5%. Excluding estimated COVID-19 effects1, Group sales growth would have been 2% to 3% in constant currency (Q2/21: 6% to 7%).
In H1/22, Group sales increased by 8% (4% in constant currency) to €19,738 million (H1/21: €18,230 million). Organic growth was 3%. Acquisitions/divestitures contributed net 1% to growth. Currency translation increased sales growth by 4%. Excluding estimated COVID-19 effects1, Group sales growth would have been 4% to 5% in constant currency (H1/21: 5% to 6%).
9% net income2,3,4 decline in constant currency
Group EBITDA before special items remained stable (-6% in constant currency) at €1,682 million (Q2/212: €1,674 million). Reported Group EBITDA was €1,528 million (Q2/21: €1,662 million).
In H1/22, Group EBITDA before special items increased by 1% (-4% in constant currency) to €3,344 million (H1/212: €3,305 million). Reported Group EBITDA was €3,123 million (H1/21: €3,290 million).
Group EBIT before special items decreased by 3% (-9% in constant currency) to €1,003 million (Q2/212: €1,033 million). The decrease was mainly driven by worsened labor shortages and related meaningfully increased wage inflation at Fresenius Medical Care in the U.S. as well as elevated material and logistic costs. The EBIT margin before special items was 10.0% (Q2/212: 11.2%). Reported Group EBIT was €845 million (Q2/21: €1,021 million).
In H1/22, Group EBIT before special items decreased by 2% (-7% in constant currency) to €2,003 million (H1/212: €2,042 million). The EBIT margin before special items was 10.1% (H1/212: 11.2%). Reported Group EBIT was €1,747 million (H1/21: €2,027 million).
1 For estimated COVID-19 effects please see table on page 18 of the pdf.
2 Before special items
3 Net income attributable to shareholders of Fresenius SE & Co. KGaA
4 Excluding Ivenix acquisition
Group net interest before special items improved to -€116 million (Q2/21: -€121 million) mainly due to positive one-time effects despite an increased interest rate environment. Reported Group net interest also improved to -€116 million (Q2/21: -€121 million). In H1/22, Group net interest before special items improved to -€235 million (H1/211: -€258 million). Reported Group net interest also improved to -€234 million (H1/21: -€258 million).
Group tax rate before special items was 23.0% (Q2/211: 21.5%) while the reported Group tax rate was 22.6% (Q2/21: 21.3%). In H1/22, Group tax rate before special items was 22.9% (H1/211: 22.1%) while the reported Group tax rate was 23.1% (H1/2021: 22.0%).
Noncontrolling interests before special items were -€233 million (Q2/211: -€241 million) of which 90% were attributable to the noncontrolling interests in Fresenius Medical Care. Reported noncontrolling interests were -€181 million (Q2/21: -€237 million). In H1/22, Noncontrolling interests before special items were -€451 million (H1/211: -€478 million) of which 89% were attributable to the noncontrolling interests in Fresenius Medical Care. Reported noncontrolling interests were -€367 million (H1/21: -€473 million).
Group net income2 before special items decreased by 5% (-9%3 in constant currency) to €450 million (Q2/211: €475 million). The decrease was mainly driven by worsened labor shortages and related meaningfully increased wage inflation at Fresenius Medical Care in the U.S. as well as elevated material and logistic costs. Excluding estimated COVID-19 effects4, Group net income2 before special items was -16% to -12% in constant currency (Q2/21: 10% to 14%). Reported Group net income2 decreased to €383 million (Q2/21: €471 million).
In H1/22, Group net income2 before special items remained stable (-3%3 in constant currency) at €913 million (H1/211: €911 million). Excluding estimated COVID-19 effects4, Group net income2 before special items was -10% to -6% in constant currency (H1/21: 4% to 8%). Reported Group net income2 decreased to €796 million (H1/21: €906 million).
1 Before special items
2 Net income attributable to shareholders of Fresenius SE & Co. KGaA
3 Excluding Ivenix acquisition
4 For estimated COVID-19 effects please see table on page 18 of the pdf.
For a detailed overview of special items please see the reconciliation tables on pages 20-23 of the pdf.
Earnings per share1 before special items decreased by 6% (-11% in constant currency) to €0.80 (Q2/212: €0.85). Reported earnings per share1 were €0.68 (Q2/21: €0.84). In H1/22, earnings per share1 before special items remained stable (-4% in constant currency) at €1.63 (H1/212: €1.63). Reported earnings per share1 were €1.42 (H1/21: €1.62).
Continued investment in growth
Spending on property, plant and equipment was €419 million corresponding to 4% of sales (Q2/21: €509 million; 6% of sales). These investments served primarily for the modernization and expansion of dialysis clinics, production facilities as well as hospitals and day clinics. In H1/22, spending on property, plant and equipment was €757 million corresponding to 4% of sales (H1/21: €893 million; 5% of sales).
Total acquisition spending was €291 million (Q2/21: €491 million), mainly for the acquisition of Ivenix by Fresenius Kabi and dialysis clinics at Fresenius Medical Care. In H1/22, total acquisition spending was €453 million (H1/21: €640 million).
Cash flow development
Group operating cash flow decreased to €1,017 million (Q2/21: €1,451 million) with a margin of 10.2% (Q2/21: 15.7%), mainly driven by working capital build-up from higher raw material inventories and receivables, among others, as well as phasing effects. Free cash flow before acquisitions and dividends decreased to €581 million (Q2/21: €952 million). Free cash flow after acquisitions and dividends decreased to -€391 million (Q2/21: -€359 million).
In H1/22, Group operating cash flow decreased to €1,118 million (H1/21: €2,103 million) with a margin of 5.7% (H1/21: 11.5%). Free cash flow before acquisitions and dividends decreased to €326 million (H1/21: €1,193 million). Free cash flow after acquisitions and dividends decreased to -€794 million (H1/21: -€242 million).
1 Net income attributable to shareholders of Fresenius SE & Co. KGaA
2 Before special items
For a detailed overview of special items please see the reconciliation tables on pages 20-23 of the pdf.
Solid balance sheet structure
Group total assets increased by 6% (1% in constant currency) to €76,112 million (Dec. 31, 2021: €71,962 million) given currency translation effects and the expansion of business activities. Current assets increased by 8% (4% in constant currency) to €18,818 million (Dec. 31, 2021: €17,461 million), mainly driven by the increase of trade accounts receivables. Non-current assets increased by 5% (1% in constant currency) to €57,294 million (Dec. 31, 2021: €54,501 million).
Total shareholders’ equity increased by 9% (3% in constant currency) to €32,033 million (Dec. 31, 2021: €29,288 million). The equity ratio was 42.1% (Dec. 31, 2021: 40.7%).
Group debt increased by 4% (2% in constant currency) at €28,368 million (Dec. 31, 2021: € 27,155 million). Group net debt increased by 8% (5% in constant currency) to € 26,239 million (Dec. 31, 2021: € 24,391 million).
As of June 30, 2022, the net debt/EBITDA ratio increased to 3.72x1,2 (Dec. 31, 2021: 3.51x1,2) mainly driven by dividend payments, lower EBITDA contribution as well as acquisition spending. The net debt/EBITDA as of June 30, 2022 excluding the already closed acquisition of Ivenix was 3.681,2.
1 At LTM average exchange rates for both net debt and EBITDA; pro forma closed acquisitions/divestitures
2 Before special items
For a detailed overview of special items please see the reconciliation tables on pages 20-23 of the pdf.
Increased number of employees
As of June 30, 2022, the Fresenius Group had 318,647 employees worldwide (December 31, 2021: 316,078).
Business Segments
Fresenius Medical Care (Financial data according to Fresenius Medical Care press release)
Fresenius Medical Care is the world's largest provider of products and services for individuals with renal diseases. As of June 30, 2022, Fresenius Medical Care was treating 345,687 patients in 4,163 dialysis clinics. Along with its core business, the Renal Care Continuum, the company focuses on expanding in complementary areas and in the field of critical care.
- Business development impacted by unprecedented U.S. labor market situation and worsening macroeconomic environment driving cost inflation and supply chain disruptions
- Meaningful decline in COVID-19-related excess mortality
- Solid support by positive exchange rates
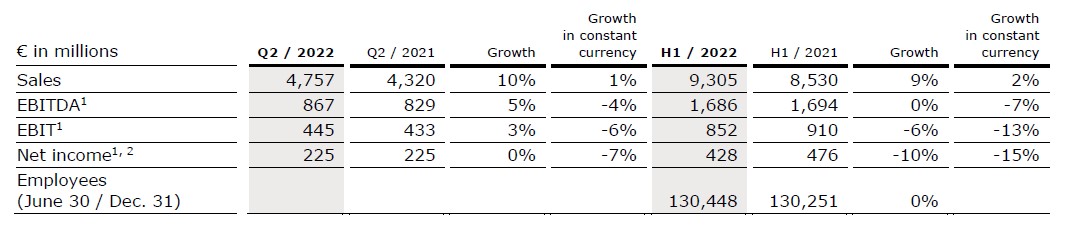
Sales increased by 10% (1% in constant currency) to €4,757 million (Q2/21: €4,320 million). Organic growth was 0%. Currency translation increased sales growth by 9%. In H1/22, sales increased by 9% (2% in constant currency) to €9,305 million (H1/21: €8,530 million). Organic growth was 1%. Currency translation increased sales growth by 7%.
EBIT decreased by 20% (-27% in constant currency) to €341 million (Q2/21: €424 million) resulting in a margin of 7.2% (Q2/21: 9.8%). EBIT before special items, i.e. costs incurred for FME25, the impacts related to the war in Ukraine, the impact of hyperinflation in Turkey and the remeasurement effect on the fair value of the investment in Humacyte, Inc. increased by 3% (-6% in constant currency) to €445 million (Q2/21: €433 million), resulting in a margin1 of 9.4% (Q2/21: 10.0%). At constant currency, the decline was mainly due to higher labor costs as well as inflationary and supply chain cost increases. This was partially offset by Provider Relief Funding received from the U.S. government to compensate for certain COVID-19-related costs.
1 Before special items
2 Net income attributable to shareholders of Fresenius Medical Care AG & Co. KGaA
For a detailed overview of special items please see the reconciliation tables on pages 20-23 of the pdf.
In H1/22, EBIT decreased by 23% (-29% in constant currency) to €688 million (H1/21: €898 million) resulting in a margin of 7.4% (H1/21: 10.5%). EBIT6 before special items decreased by 6% (-13% in constant currency) to €852 million (H1/21: €910 million), resulting in a margin1 of 9.2% (H1/21: 10.7%).
Net income2 decreased by 33% (-39% in constant currency) to €147 million (Q2/21: €219 million). Net income2 before special items remained stable (-7% in constant currency) at €225 million (Q2/21: €225 million) mainly due to the mentioned negative effects on operating income.
In H1/22, net income2 decreased by 35% (-39% in constant currency) to €305 million (H1/21: €468 million). Net income2 before special items decreased by 10% (-15% in constant currency) to €428 million (H1/21: €476 million).
Operating cash flow was €751 million (Q2/21: €921 million) with a margin of 15.8% (Q2/21: 21.3%). The decrease was mainly due to an unfavorable development of days sales outstanding as well as a decrease in net income2, partially offset by U.S. government relief funding. In H1/22, operating cash flow was €910 million (H1/21: €1,129 million) with a margin of 9.8% (H1/21: 13.2%).
As announced on July 27, 2022, Fresenius Medical Care expects revenue3 to grow at a low single digit percentage rate and net income2,4 to decline at around a high teens percentage range.
Revenue and net income guidance are both on a constant currency basis and before special items5.
Given the uncertain labor situation and macro-economic inflationary environment and the substantially reduced earnings base compared to 2020, Fresenius Medical Care does not expect today to be able to achieve the meaningfully higher compounded annual average increases that would now be needed to accomplish its 2025 targets. Against this background, Fresenius Medical Care has cut its financial targets for FY 2022 and withdrawn its 2025 targets.
For further information, please see Fresenius Medical Care’s press release at www.freseniusmedicalcare.com.
1 Before special items
2 Net income attributable to shareholders of Fresenius Medical Care AG & Co. KGaA
3 FY/21 base: €17,619 million
4 FY/21 base: €1,018 million, before special items; FY/22 before special items
5 These targets are based on the 2021 results excluding the costs related to FME25 of EUR 49 million (for Net Income). They are in constant currency and exclude special items. Special items include further costs related to FME25, the impact of the War in Ukraine, the impact of Hyperinflation in Turkey, the Humacyte investment remeasurement and other effects that are unusual in nature and have not been foreseeable or not foreseeable in size or impact at the time of giving guidance.
For a detailed overview of special items please see the reconciliation tables on pages 20-23.
Fresenius Kabi
Fresenius Kabi offers intravenously administered generic drugs, clinical nutrition and infusion therapies for seriously and chronically ill patients in the hospital and outpatient environments. The company is also a leading supplier of medical devices and transfusion technology products. In the biosimilars business, Fresenius Kabi develops products with a focus on oncology and autoimmune diseases.
- North America with solid organic sales growth despite macroeconomic headwinds
- Asia-Pacific impacted by price pressure from NVBP tenders in China
- Biosimilars business progressing well; completing acquisition of majority stake in mAbxience
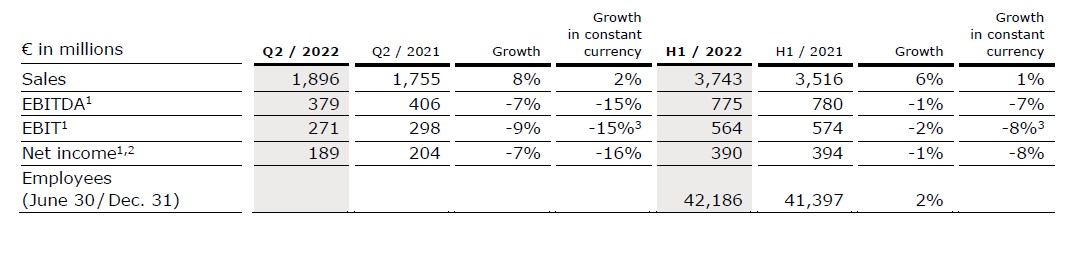
Sales increased by 8% (2% in constant currency) to €1,896 million (Q2/21: €1,755 million). Organic growth was 2%. In H1/22, sales increased by 6% (1% in constant currency) to €3,743 million (H1/21: €3,516 million). Organic growth was 1%. Positive currency translation effects of 6% in Q2/22 and 5% in H1/22 were mainly related to the U.S. dollar and Chinese yuan.
Sales in North America increased by 16% (organic growth: 3%) to €606 million (Q2/21: €522 million). The significant sales growth was mainly driven by positive currency effects while organic growth continued to be impacted a high level of COVID-related absenteeism of production staff, ongoing competitive pressure and supply chain challenges. In H1/22, sales in North America increased by 10% (organic growth: 0%) to €1,185 million (H1/21: €1,080 million).
Sales in Europe increased by 4% (organic growth: 4%) to €658 million (Q2/21: €634 million) driven by a broad-based positive development and biosimilars. In H1/22, sales in Europe increased by 3% (organic growth: 3%) to €1,298 million (H1/21: €1,260 million).
1 Before special items
2 Net income attributable to shareholders of Fresenius SE & Co. KGaA
3 Excluding Ivenix acquisition
For a detailed overview of special items please see the reconciliation tables on pages 20-23.
Sales in Asia-Pacific increased by 4% (organic growth: -4%) to €425 million (Q2/21: €409 million). Organic growth was primarily affected by price pressure from the NVBP (National Volume-Based Procurement) tenders in China while Asia-Pacific ex China showed healthy underlying growth. In H1/22, sales in Asia-Pacific increased by 7% (organic growth: -1%) to €858 million (H1/21: €801 million).
Sales in Latin America/Africa increased by 9% (organic growth: 2%) to €207 million (Q2/21: €190 million), over a high prior-year COVID-19-related base. In H1/22, sales in Latin America/Africa increased by 7% (organic growth: 2%) to €402 million (H1/21: €375 million).
Sales in the Biosimilars business was €29 million. In H1/22, sales in the Biosimilars business was €52 million, consistent with Fresenius Kabi’s expectations. The U.S. Food and Drug Administration (FDA) has accepted for review Fresenius Kabi's Biologics License Application (BLA) for MSB11456, a biosimilar candidate of Actemra®4 (tocilizumab). Moreover, Fresenius Kabi closed the majority stake acquisition of mAbxience Holding S.L., a leading international biopharmaceutical company. The transaction was announced in March 2022. The acquisition significantly strengthens Fresenius Kabi’s footprint in the biopharmaceuticals space. The purchase price will be a combination of c. €495 million upfront payment and milestone payments, strictly tied to the achievement of commercial and development targets.
EBIT1 decreased by 9% (-15%2 in constant currency) to €271 million (Q2/21: €298 million) with an EBIT margin1 of 14.3% (Q2/21: 17.0%). Ongoing competitive pressure, staff shortages, supply chain challenges as well as accelerated input cost inflation weighed on the financial performance. In H1/22, EBIT1 decreased by 2% (-8%2 in constant currency) to €564 million (H1/21: €574 million) with an EBIT margin1 of 15.1% (H1/21: 16.3%).
Net income1,3 decreased by 7% (-16% in constant currency) to €189 million (Q2/21: €204 million). In H1/22, net income1,3 decreased by 1% (-8% in constant currency) to €390 million (H1/21: €394 million).
Operating cash flow decreased to €109 million (Q2/21: €197 million) with a margin of 5.7% (Q2/21: 11.2%), mainly driven by a working capital build-up from e.g. higher raw material inventories. In H1/22, operating cash flow decreased to €242 million (H1/21: €475 million) with a margin of 6.5% (H1/21: 13.5%).
1 Before special items
2 Excluding Ivenix acquisition
3 Net income attributable to shareholders of Fresenius SE & Co. KGaA
4 Actemra® is a registered trademark of Chugai Seiyaku Kabushiki Kaisha Corp., a member of the Roche Group
For a detailed overview of special items please see the reconciliation tables on pages 20-23 of the pdf.
For FY/22, Fresenius Kabi confirms its outlook and expects organic sales1 growth in a low-single-digit percentage range. Constant currency EBIT2 is expected to decline in a high-single- to low-double-digit percentage range. Both sales and EBIT outlook include expected COVID-19 effects. The financial effects from the acquisitions of Ivenix and the majority stake in mAbxience remain excluded from guidance.
Save the date: Fresenius will host a virtual Meet the Management event on its business segment Fresenius Kabi on Friday, October 7, 2022 (virtual event).
1 FY/21 base: €7,193 million
2 FY/21 base: €1,153 million, before special items, FY/22 before special items
For a detailed overview of special items please see the reconciliation tables on pages 20-23 of the pdf.
Fresenius Helios
Fresenius Helios is Europe's leading private hospital operator. The company comprises Helios Germany, Helios Spain and Helios Fertility. Helios Germany operates 87 hospitals, ~130 outpatient centers and 6 prevention centers. Helios Spain operates 50 hospitals, 97 outpatient centers and around 300 occupational risk prevention centers. In addition, the company is active in Latin America with 8 hospitals and as a provider of medical diagnostics. Helios Fertility offers a wide spectrum of state-of-the-art services in the field of fertility treatments.
- Fresenius Helios with solid organic growth in Germany and Spain based on increased number of admissions
- Helios Fertility with solid financial performance
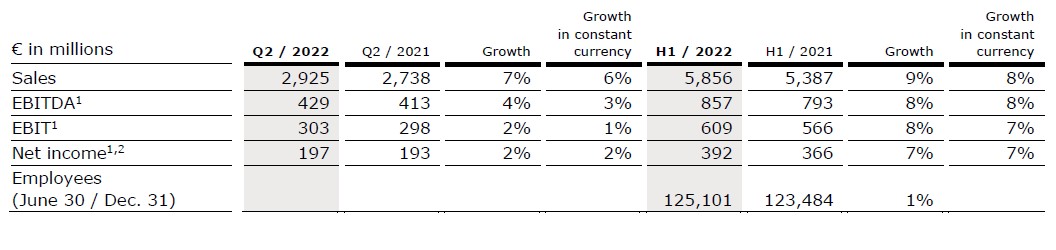
Sales increased by 7% (6% in constant currency) to €2,925 million (Q2/21: €2,738 million). Organic growth was 5%. Acquisitions, mainly at Helios Fertility, contributed 1% to sales growth. In H1/22, sales increased by 9% (8% in constant currency) to €5,856 million (H1/21: €5,387 million). Organic growth was 6%. Acquisitions contributed 2% to sales growth.
Sales of Helios Germany increased by 5% (organic growth: 4%) to €1,758 million (Q2/21: €1,675 million), mainly driven by increasing admissions, which are however still below pre-pandemic levels. Acquisitions contributed 1% to sales growth. In H1/22, sales of Helios Germany increased by 6% (organic growth: 5%) to €3,541 million (H1/21: €3,348 million). Acquisitions contributed 1% to sales growth.
Sales of Helios Spain increased by 8% (7% in constant currency) to €1,101 million (Q2/21: €1,020 million). Organic growth of 6% was driven by consistently high activity levels. The hospitals in Latin America also contributed to sales growth. Acquisitions contributed 2% to sales growth. In H1/22, sales of Helios Spain increased by 10% (9% in constant currency) to €2,190 million (H1/21: €1,996 million). Organic growth was 9%.
Sales of the Helios Fertility were €65 million (Q2/21: €42 million). In H1/22, sales of the Helios Fertility were €122 million.
1 Before special items
2 Net income attributable to shareholders of Fresenius SE & Co. KGaA
For a detailed overview of special items please see the reconciliation tables on pages 20-23 of the pdf.
EBIT1 increased by 2% (1% in constant currency) to €303 million (Q2/21: €298 million) with an EBIT margin1 of 10.4% (Q2/21: 10.9%). In H1/22, EBIT1 increased by 8% (7% in constant currency) to €609 million (H1/21: €566 million) with an EBIT margin1 of 10.4% (H1/21: 10.5%).
EBIT1 of Helios Germany increased by 1% to €154 million (Q2/21: €152 million) with an EBIT margin1 of 8.8% (Q2/21: 9.1%). COVID-related elevated staff absenteeism weighed on profitability. Inflationary effects had only a small negative impact. In H1/22, EBIT1 of Helios Germany increased by 2% to €308 million (H1/21: €302 million) with an EBIT margin1 of 8.7% (H1/21: 9.0%).
EBIT1 of Helios Spain increased by 1% (0% in constant currency) to €148 million (Q2/21: €147 million) due to an extraordinary high prior-year quarter comp. The Latin American business also showed a good performance. The EBIT margin1 was 13.4% (Q2/21: 14.4%). In H1/22, EBIT1 of Helios Spain increased by 10% (10% in constant currency) to €301 million (H1/21: €273 million). The EBIT margin1 was 13.7% (H1/21: 13.7%).
EBIT1 of Helios Fertility was €7 million with an EBIT margin1 of 10.8% (Q2/21: €5 million). In H1/22, EBIT1 of Helios Fertility was €11 million with an EBIT margin1 of 9.0%.
Net income1,2 increased by 2% (2% in constant currency) to €197 million (Q2/21: €193 million). In H1/22, net income1,2 increased by 7% (7% in constant currency) to €392 million (H1/21: €366 million).
Operating cash flow decreased to €194 million (Q2/21: €223 million) with a margin of
6.6% (Q2/21: 8.1%) following COVID-19-related delays in budget negotiations in Germany. In H1/22, operating cash flow decreased to €58 million (H1/21: €438 million) with a margin of 1.0% (H1/21: 8.1%)
For FY/22, Fresenius Helios confirms its outlook and expects organic sales3 growth in a low- to mid-single-digit percentage range and constant currency EBIT4 growth in a mid-single-digit percentage range. Both sales and EBIT outlook include expected COVID-19 effects.
1 Before special items
2 Net income attributable to shareholders of Fresenius SE & Co. KGaA
3 FY/21 base: €10,891 million
4 FY/21 base: €1,127 million, before special items, FY/22 before special items
For a detailed overview of special items please see the reconciliation tables on pages 20-23 of the pdf.
Fresenius Vamed
Fresenius Vamed manages projects and provides services for hospitals and other health care facilities worldwide and is a leading post-acute care provider in Central Europe. The portfolio ranges along the entire value chain: from project development, planning, and turnkey construction, via maintenance and technical management to total operational management.
- Project business still marked by the Ukraine war and COVID-19-related headwinds in project execution as well as global supply chain challenges and cost inflation
- Service business supported by increasing elective treatment activity
- Order backlog at all-time high
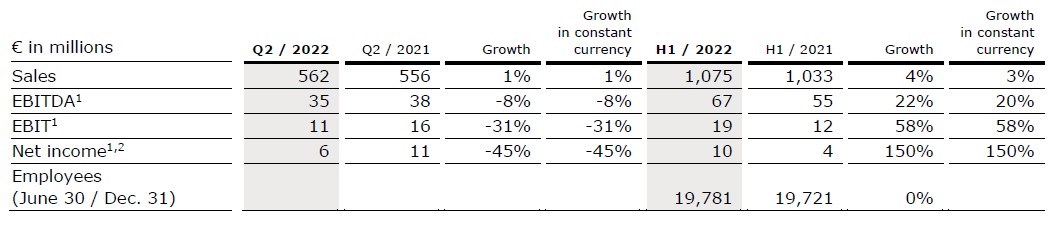
Sales increased by 1% (1% in constant currency) to €562 million (Q2/21: €556 million). Organic growth was 1%. In H1/22, sales increased by 4% (3% in constant currency) to €1,075 million (H1/21: €1,033 million). Organic growth was 4%.
Sales in the service business increased by 6% (6% in constant currency) to €417 million (Q2/21: €392 million) due to recovering elective treatments. Sales in the project business decreased by 12% (-12% in constant currency) to €145 million (Q2/21: €164 million),
driven by the Ukraine war and COVID-19-related headwinds as well as global supply chain challenges. In H1/22, sales in the service business increased by 9% (8% in constant currency) to €822 million (H1/21: €755 million). Sales in the project business decreased by 9% (-9% in constant currency) to €253 million (H1/21: €278 million).
EBIT1 decreased by 31% to €11 million (Q2/21: €16 million) with an EBIT margin1 of 2.0% (Q2/21: 2.9%) driven by the Ukraine war and COVID-19-related headwinds as well as global supply chain challenges. In H1/22, EBIT1 increased by 58% to €19 million (H1/21: €12 million) with an EBIT margin1 of 1.8% (H1/21: 1.2%).
1 Before special items
2 Net income attributable to shareholders of VAMED AG
For a detailed overview of special items please see the reconciliation tables on pages 20-23.
Net income1,2 decreased by 45% to €6 million (Q2/21: €11 million). In H1/22, Net income1,2 increased to €10 million (H1/21: €4 million).
Order intake was €253 million (Q2/21: €713 million). In H1/22 order intake was €516 million (H1/21: €851 million). As of June 30, 2022, order backlog was at €3,732 million (December 31, 2021: €3,473 million).
Operating cash flow decreased to €7 million (Q2/21: €58 million) with a margin of 1.2% (Q2/21: 10.4%), due to phasing effects and COVID-19-related delays in the project business as well as some working capital build-ups. In H1/22, operating cash flow decreased to -€38 million (H1/21: €14 million) with a margin of -3.5% (H1/21: 1.4%).
For FY/22, Fresenius Vamed confirms its outlook and expects organic sales3 growth in a high-single to low-double-digit percentage range and constant currency EBIT4 to return to absolute pre-COVID-19 levels (FY/19: €134 million). Both sales and EBIT outlook include expected COVID-19 effects.
1 Before special items
2 Net income attributable to shareholders of VAMED AG
3 FY/21 base: €2,297 million
4 FY/21 base: €101 million, before special items; FY/22 before special items
For a detailed overview of special items please see the reconciliation tables on pages 20-23
This release contains forward-looking statements that are subject to various risks and uncertainties. Future results could differ materially from those described in these forward-looking statements due to certain factors, e.g. changes in business, economic and competitive conditions, regulatory reforms, results of clinical trials, foreign exchange rate fluctuations, uncertainties in litigation or investigative proceedings, the availability of financing and unforeseen impacts of international conflicts. Fresenius does not undertake any responsibility to update the forward-looking statements in this release.