
Fresenius Kabi has entered into a global license agreement to commercialize a Ustekinumab biosimilar candidate (FYB202) being developed by Formycon AG. The proposed biosimilar is currently in advanced clinical stage. FYB202 is a biosimilar candidate referencing Johnson & Johnson’s Stelara®*, a human monoclonal antibody that targets the cytokines interleukin-12 and interleukin-23 for treatment of immune-mediated disorders. Stelara is approved for treatment of moderate-to-severe plaque psoriasis, Crohn’s disease, ulcerative colitis as well as active psoriatic arthritis. The global license agreement gives Fresenius Kabi exclusive rights to commercialize the proposed Ustekinumab biosimilar product in key global markets.
*Stelara® is a registered trademark of Johnson & Johnson
Fresenius Medical Care (FME), the world’s leading provider of products and services for individuals with renal diseases, has taken the Zero Health Gaps Pledge at the World Economic Forum in Davos, Switzerland.
The Zero Health Gaps Pledge is part of the Global Health Equity Network (GHEN), which brings together key stakeholders from the public and private sectors to advance a collective vision of Zero Health Gaps, in line with the UN Sustainable Development Goals. In total, 36 companies from eight countries committed to sign the first-in-kind global pledge. By taking the pledge, Fresenius Medical Care is declaring its commitment to meaningful action and collaboration toward health equity.
“We believe that access to equitable and high-quality health care is a fundamental human right, and we are committed to working with global leaders and organizations to improve the lives of millions of people throughout the world,” said Helen Giza, CEO of Fresenius Medical Care. “We will also look inward and achieve clear, actionable steps to make our processes economically and environmentally sustainable, while increasing access to the care we provide in the global communities we serve.”
The difference in average life expectancy at birth between high- and low-income countries is glaring at 78 and 64 years respectively. Global climate and health crises, including the COVID-19 pandemic, have heightened both the severity of these inequities and the potential consequences of inaction. The Zero Health Gaps Pledge is a direct response to the growing health disparities across the globe.
Fresenius Medical Care has taken a number of actions to address health equity. The company’s Health Equity Dashboard provides important demographic and regional data to identify possible inequities in key patient outcomes. The goal is to tailor interventions to individuals in different locations to help ensure there are no care delivery gaps.
“Around 3.8 million patients worldwide regularly undergo dialysis treatment. Fresenius Medical Care is passionate about the importance of closing the gaps in health equity,” said Franklin W. Maddux, MD, Global Chief Medical Officer. “We are excited to help lead the way for the international health care community by taking the Zero Health Gaps Pledge and look forward to tackling this significant challenge head on.”
Nwamaka (Amaka) Eneanya, MD, Head of Strategy and Operations for the Global Medical Office, will lead the company’s global health equity strategy including its efforts to meet the Zero Health Gaps Pledge. She will work with Mignon Early, Vice President of Diversity, Equity, and Inclusion, to ensure strategic initiatives are developed in the context of Fresenius Medical Care’s diverse employee base.
Click here to read the complete “Zero Health Gaps Pledge” including its ten key commitments, and click here to learn more about the Global Health Equity Network.
Disclaimer:
This release contains forward-looking statements that are subject to various risks and uncertainties. Actual results could differ materially from those described in these forward-looking statements due to various factors, including, but not limited to, changes in business, economic and competitive conditions, legal changes, regulatory approvals, impacts related to the COVID-19 pandemic results of clinical studies, foreign exchange rate fluctuations, uncertainties in litigation or investigative proceedings, and the availability of financing. These and other risks and uncertainties are detailed in Fresenius Medical Care AG & Co. KGaA's reports filed with the U.S. Securities and Exchange Commission. Fresenius Medical Care AG & Co. KGaA does not undertake any responsibility to update the forward-looking statements in this release.
Fresenius Medical Care, the world’s leading provider of products and services for individuals with renal diseases, has entered the Dow Jones Sustainability World Index. Additionally, the company has been included for the 13th time in the Dow Jones Sustainability Index (DJSI) Europe. Fresenius Medical Care achieved an improved rating in most of the evaluated categories, and was awarded maximum scores for its environmental and social reporting. The company was also awarded significantly higher scores in the areas of occupational health and safety, talent attraction and retention, and customer relationship management.
“To us, successful sustainability management means creating lasting economic, environmental and social value,” said Helen Giza, CEO of Fresenius Medical Care. “We are proud that the DJSI has recognized our efforts to integrate sustainable actions systematically into our company.”
To compile the Dow Jones Sustainability Indexes, the international financial services company S&P Global evaluates the environmental, social and economic performance of companies. The 10 percent of global companies with the highest evaluations form the DJSI World. The DJSI Europe index is composed of the top 20 percent of the companies headquartered in Europe.
You can find an overview of Fresenius Medical Care’s progress in sustainability here.
This release contains forward-looking statements that are subject to various risks and uncertainties. Actual results could differ materially from those described in these forward-looking statements due to various factors, including, but not limited to, changes in business, economic and competitive conditions, legal changes, regulatory approvals, impacts related to COVID-19, results of clinical studies, foreign exchange rate fluctuations, uncertainties in litigation or investigative proceedings, and the availability of financing. These and other risks and uncertainties are detailed in Fresenius Medical Care AG & Co. KGaA's reports filed with the U.S. Securities and Exchange Commission. Fresenius Medical Care AG & Co. KGaA does not undertake any responsibility to update the forward-looking statements in this release.
Implementation of measures as presented herein may be subject to information & consultation procedures with works councils and other employee representative bodies, as per local laws and practice. Consultation procedures may lead to changes on proposed measures.
In this year's ranking, CDP has confirmed Fresenius' classification in the second-highest category B. Fresenius is thus once again one of the leading companies in the health care sector. Companies in categories A and B are characterized by transparency, coordinated climate protection measures and the implementation of corresponding best-practice approaches. CDP is one of the most renowned climate and environmental rankings in the capital market. More than 680 investors use the annual results to evaluate climate protection activities and climate-related risks and opportunities of the companies assessed.
Fresenius has been included again in the Dow Jones Sustainability Index (DJSI Europe). The DJSI Europe index represents the top 20 percent of companies based on S&P Global’s analysis of their economic, environmental, and social performance. Fresenius achieved improvements in many categories, the most significant ones in the areas of Occupational Health and Safety, Climate Strategy, as well as Risk and Crisis Management.


Helen Giza (54) has been appointed Chief Executive Officer of Fresenius Medical Care, the world's leading provider of products and services for individuals with renal diseases, with immediate effect. Previously, she was Deputy CEO of Fresenius Medical Care. The Supervisory Board of Fresenius Medical Care Management AG unanimously appointed her to succeed Dr. Carla Kriwet (51), who will leave the company at her own request and by mutual agreement due to strategic differences. Helen Giza will continue to serve as Chief Financial Officer of Fresenius Medical Care until a successor is appointed for this position.
In her capacity as CEO of Fresenius Medical Care, Ms. Helen Giza will also be a member of the Management Board of Fresenius Management SE. Dr. Carla Kriwet has resigned from her position as a member of the Management Board of Fresenius Management SE.
Michael Sen, Chairman of the Fresenius Medical Care Management AG Supervisory Board and CEO of Fresenius, said: “In a fundamentally sound industry Fresenius Medical Care now needs to sharpen its focus on the operational turnaround, further drive performance improvements, and focus on its core. We are delighted that Helen Giza will take over as CEO. She is ideally suited to lead Fresenius Medical Care for what lies ahead. During her tenure with the company, Helen Giza has gained thorough expertise in renal healthcare and has a deep understanding of the company. I am very much looking forward to continuing working with Helen Giza in her new role. On behalf of the Supervisory Board, I would like to thank Carla Kriwet, and we wish her all the best for the future.”
Helen Giza said: “I am honored by the appointment and trust the Supervisory Board has placed in me. The role comes with significant responsibility towards the patients we serve. With the knowledge gained as CFO and Chief Transformation Officer of the company, I feel well placed to sharpen the focus on operational turnaround. I truly believe in Fresenius Medical Care’s mission, its passionate employees and great potential.”
Carla Kriwet said: “In this short time, I have met a fascinating company with a very positive corporate culture that works every day to make patients' lives more worth living. The company has great growth potential and is about to undergo a major transformation. I thank my whole team for the great support and wish the company all the best!“
Helen Giza joined Fresenius Medical Care in 2019 as Chief Financial Officer and took on the additional roles of Deputy CEO and Chief Transformation Officer in 2022 heading the FME25 transformation program. Previously, she was Chief Integration and Divestiture Management Officer at Takeda Pharmaceuticals since 2018. Before joining the Takeda Corporate Executive Team, she served as Chief Financial Officer of Takeda’s U.S. business unit since 2008. Prior to that she held a number of key international finance and controlling positions, amongst others at TAP Pharmaceuticals and Abbott Laboratories. Helen Giza is a U.K. Chartered Certified Accountant and holds a Master of Business Administration from the Kellogg School of Management at Northwestern University in Evanston, Illinois, USA.
Disclaimer:
This release contains forward-looking statements that are subject to various risks and uncertainties. Actual results could differ materially from those described in these forward-looking statements due to various factors, including, but not limited to, changes in business, economic and competitive conditions, legal changes, regulatory approvals, impacts related to the COVID-19 pandemic results of clinical studies, foreign exchange rate fluctuations, uncertainties in litigation or investigative proceedings, and the availability of financing. These and other risks and uncertainties are detailed in Fresenius Medical Care AG & Co. KGaA's reports filed with the U.S. Securities and Exchange Commission. Fresenius Medical Care AG & Co. KGaA does not undertake any responsibility to update the forward-looking statements in this release.

Dennis Hofmann has been appointed Head of Global Corporate Communications at Fresenius. He succeeds the previous Head of Communications Matthias Link, who will leave the company after 14 years by mutual agreement end of 2022. In his new role, Dennis Hofmann will report to the CEO, Michael Sen and work closely with him, the Management Board and senior executives on all aspects of strategic communications. Dennis will also be responsible for coordinating relevant strategic comms activities within the Fresenius Group and across different business segments.
“I would like to express my sincere gratitude to Matthias Link for his many years of very successful commitment and service to our company and wish him all the best for his future endeavors. Equally, I am very much looking forward to working with Dennis Hofmann. In Dennis, we gain a proven communications expert with a good understanding of people and issues relevant to the company. His diverse communications experience across industries and surrounding the implementation of transformation processes will further strengthen Fresenius’ positioning as a leading healthcare company and make him an asset to our management team”, said Michael Sen, CEO of Fresenius.
“Now more than ever, communication plays a crucial role on the path to #FutureFresenius. I am honored to lead the communications department of such a great company”, Hofmann said. “Every day, more than 300,000 employees worldwide contribute to improving the quality of life of millions of people. It's a privilege to be part of Fresenius’ mission and I will work with my team to ensure we deliver strong corporate communications support that drives business growth and cultural change.”
Dennis Hofmann took up his position as Head of Global Communications at Fresenius Kabi in September 2022. Previously, he spent several years in senior positions within the communications, marketing, and investor relations fields. Most recently he served as Senior Vice President for Corporate Communications & Investor Relations at Leoni AG in Nuremberg. Prior to that, he spent approximately 18 years at Siemens AG where, in his final four years, he held the position of Corporate Senior Vice President for Global Internal and External Communications.
This release contains forward-looking statements that are subject to various risks and uncertainties. Future results could differ materially from those described in these forward-looking statements due to certain factors, e.g. changes in business, economic and competitive conditions, regulatory reforms, results of clinical trials, foreign exchange rate fluctuations, uncertainties in litigation or investigative proceedings, the availability of financing and unforeseen impacts of international conflicts. Fresenius does not undertake any responsibility to update the forward-looking statements in this release.
The information and documents contained on the following pages of this website are for information purposes only. These materials do neither constitute an offer nor an invitation to subscribe to or to purchase securities, nor any investment advice or service, and are not meant to serve as a basis for any kind of obligation, contractual or otherwise. Securities may not be offered or sold in the United States of America (“US”) absent registration under the US Securities Act of 1933, as amended, or an exemption from registration. The securities described on the following pages are not offered for sale in the US or to "US persons" (as defined in Regulation S under the US Securities Act of 1933, as amended).
THE FOLLOWING INFORMATION AND DOCUMENTS ARE NOT DIRECTED AT AND ARE NOT INTENDED FOR USE BY (I) PERSONS WHO ARE RESIDENTS OF OR LOCATED IN THE US, CANADA, JAPAN OR AUSTRALIA OR WHO ARE US PERSONS (AS DEFINED IN REGULATION S UNDER THE US SECURITIES ACT OF 1933, AS AMENDED), OR (II) PERSONS IN ANY OTHER JURISDICTION WHERE THE COMMUNICATION OR RECEIPT OF SUCH INFORMATION IS RESTRICTED IN SUCH A WAY THAT PROVIDES THAT SUCH PERSONS SHALL NOT RECEIVE IT. SUCH PERSONS, OR PERSONS ACTING FOR THE BENEFIT OF ANY SUCH PERSONS, ARE NOT PERMITTED TO VISIT THE FOLLOWING PAGES OF THE WEBSITE.
To visit the following parts of this website you must confirm that
(i) you are not a resident of the United States of America, Canada, Japan or Australia or a "US person" (as defined in Regulation S under the US Securities Act of 1933, as amended),
(ii) you are not a person to whom the communication of the information contained on the website is restricted,
(iii) you will not distribute any of the information and documents contained thereon to any such person, and
(iv) you are not acting for the benefit of any such person.
By clicking on the "Accept" button below, you will be deemed to have made this confirmation.
NOT FOR RELEASE, PUBLICATION OR DISTRIBUTION, DIRECTLY OR INDIRECTLY, IN OR INTO THE UNITED STATES OF AMERICA, AUSTRALIA, CANADA OR JAPAN.
Fresenius today successfully placed bonds with an aggregate volume of €1 billion across two tranches:
- €500 million bonds with a maturity in May 2026 and an annual coupon of 4.25% and
- €500 million bonds with a maturity in November 2029 and an annual coupon of 5.00%.
The proceeds will be used for general corporate purposes, including refinancing of existing financial liabilities.
The bonds were drawn under the Fresenius Debt Issuance Program (DIP) and issued by Fresenius SE & Co KGaA. Fresenius has applied to the Luxembourg Stock Exchange to admit the bonds to trading on its regulated market.
The envisaged settlement date is November 28, 2022.
This announcement does not contain or constitute an offer of, or the solicitation of an offer to buy or subscribe for, securities to any person in Australia, Canada, Japan, or the United States of America (the “United States”) or in any jurisdiction to whom or in which such offer or solicitation is unlawful. The securities referred to herein may not be offered or sold in the United States or to, or for the account or benefit of, U.S. persons, absent registration under the U.S. Securities Act of 1933, as amended (the “Securities Act”) except pursuant to an exemption from, or in a transaction not subject to, the registration requirements of the Securities Act. Subject to certain exceptions, the securities referred to herein may not be offered or sold in Australia, Canada or Japan or to, or for the account or benefit of, any national, resident or citizen of Australia, Canada or Japan. The offer and sale of the securities referred to herein has not been and will not be registered under the Securities Act or under the applicable securities laws of Australia, Canada or Japan. There will be no public offer of the securities in the United States.
This announcement is a general information and not a prospectus. Investors should not purchase or subscribe for any securities referred to in this announcement except on the basis of information in the prospectus to be issued by the company in connection with the offering of such securities. Copies of the prospectus will, following publication, be available free of charge from Fresenius SE & Co. KGaA at Else-Kröner Strasse 1, 61352 Bad Homburg, Germany.
This announcement has been prepared on the basis that any offer of securities in any Member State of the European Economic Area ("EEA") will be made pursuant to the prospectus prepared by Fresenius SE & Co. KGaA, Fresenius Finance Ireland Public Limited Company and Fresenius Finance Ireland II Public Limited Company in combination with the relevant final terms relating to such securities or pursuant to an exemption under Regulation (EU) 1129/2017 (the Prospectus Regulation) from the requirement to publish a prospectus for offers of securities. Neither Fresenius SE & Co. KGaA, Fresenius Finance Ireland Public Limited Company nor Fresenius Finance Ireland II Public Limited Company have authorized, nor do they authorize, the making of any offer of securities in circumstances in which an obligation arises for Fresenius SE & Co. KGaA, Fresenius Finance Ireland Public Limited Company and Fresenius Finance Ireland II Public Limited Company or any other person to publish or supplement a prospectus for such offer.
This announcement is directed at and/or for distribution in the United Kingdom only to (i) persons who have professional experience in matters relating to investments falling within article 19(5) of the Financial Services and Markets Act 2000 (Financial Promotion) Order 2005 (the “Order”) or (ii) high net worth entities falling within article 49(2)(a) to (d) of the Order (all such persons are referred to herein as “relevant persons”). This announcement is directed only at relevant persons. Any person who is not a relevant person should not act or rely on this announcement or any of its contents. Any investment or investment activity to which this announcement relates is available only to relevant persons and will be engaged in only with relevant persons.
With regard to the EEA and the United Kingdom ("UK"), the identified target market for the securities referred to in this press release is eligible counterparties and professional clients only. No key information document (KID) within the meaning of Regulation (EU) No 1286/2014 (as amended the "PRIIPs Regulation") or the PRIIPS Regulation as it forms part of UK law by virtue of the European Union (Withdrawal) Act 2018 (EUWA) (the "UK PRIIPs Regulation"), as applicable, has been prepared and therefore offering or selling the securities or otherwise making them available to any retail investor in the EEA or UK will be unlawful under the PRIIPs Regulation or UK PRIIPS Regulation, as applicable.
This announcement contains forward-looking statements that are subject to various risks and uncertainties. Future results could differ materially from those described in these forward-looking statements due to certain factors, e.g. changes in business, economic and competitive conditions, regulatory reforms, results of clinical trials, foreign exchange rate fluctuations, uncertainties in litigation or investigative proceedings, the availability of financing and unforeseen impacts of international conflicts. Neither Fresenius SE & Co. KGaA, Fresenius Finance Ireland Public Limited Company nor Fresenius Finance Ireland II Public Limited Company undertake any responsibility to update the forward-looking statements in this announcement.
- Business development continues to be strongly impacted by highly uncertain macroeconomic environment driving wage and general cost inflation in all reporting segments
- Impacts of improvements in North American Health Care Services operations delayed
- COVID-19-related excess mortality in line with expectations
- Important step in value-based care achieved with closing of InterWell Health merger
- Management Team in the process of detailing broader turnaround plan
- Revised FY 2022 targets:
o revenue growth still expected at a low-single digit percentage rate
o income now expected to decline in the high teens to mid-twenties percentage range
Carla Kriwet, Chief Executive Officer of Fresenius Medical Care since 1st October, said: “I am excited having started to work for this great company. From the many visits and exchanges in my first month as CEO, I can witness the tremendous dedication of our employees to our patients around the world, under difficult macroeconomic circumstances. While the FME25 new operating model and savings provide an important foundation, there is also a clear urgency to turnaround our operational performance with bold interventions. We are defining a broader turnaround plan, which will also include a culture of performance and accountability.”
“Fresenius Medical Care continues to operate in a challenging and highly volatile macroeconomic and operational environment. As expected, inflationary developments persisted and weighed on our earnings. Open positions in our dialysis clinics were reduced but remained at an elevated level, impacting both costs and growth in Health Care Services. While it is disappointing that the execution against our North America recovery plan is delayed, we are confident that the intensified efforts will improve the performance. Against this backdrop, as a matter of caution, we revise our guidance for 2022 net income development.”, said Helen Giza, Chief Financial Officer of Fresenius Medical Care.
1 Special items include costs related to the FME25 program, the impact of the war in Ukraine, the impact of hyperinflation in Turkiye, the remeasurement effect on the fair value of the investment in Humacyte, Inc. (Humacyte investment remeasurement), the net gain related to InterWell Health and other effects that are unusual in nature and have not been foreseeable or not foreseeable in size or impact at the time of giving guidance. These items are excluded to ensure comparability of the figures presented with the Company’s financial targets which have been defined excluding special items. For further details please see the reconciliation at the end of the Press Release.
2 Attributable to shareholders of Fresenius Medical Care AG & Co. KGaA
Key priorities
Given the operational environment and the likely headwinds for 2023, the Management Team is defining a broad turnaround plan. It will address performance issues in North American Health Care Services, the structural cost base of Health Care Products and an extended cost saving program.
Based on the Company’s new operating model, that will come to life in January 2023, Fresenius Medical Care will not only simplify its organization and significantly reduce overhead costs but rigorously optimize its portfolio in both – the future Care Delivery (Health Care Services) and Care Enablement (Health Care Products) segments. The subsequent capital allocation will focus on profitable growth businesses and improving operational leverage.
InterWell Health merger closed
With the closing of the three-way merger of Fresenius Health Partners, InterWell Health and Cricket Health, a premier value-based kidney care provider has been created in the U.S. This is an important step in the execution of Fresenius Medical Care’s strategy. The new company operates under the InterWell Health brand and will be fully consolidated by Fresenius Medical Care as the majority owner. The closing of the merger resulted in a net gain of EUR 56 million (on operating income level) in the third quarter, which is treated as a special item.
Improvements in North American Health Care Services delayed
Fresenius Medical Care continues to face an unprecedented labor market situation in the U.S., resulting in staff shortages, high turnover rates and meaningfully higher costs. This has continued to impact growth in U.S. Dialysis Services as well as in downstream assets and consequently affected operational leverage in both. Earnings effects were partially mitigated by income attributable to a consent agreement on certain pharmaceuticals in the third quarter.
The impacts of Fresenius Medical Care’s focused efforts to improve North American Health Care Services operations are delayed against the Company’s previous assumptions. Fresenius Medical Care now expects the related effects to materialize in 2023.
The challenging macroeconomic inflationary environment persists, resulting in higher logistics costs as well as raw material and energy prices. Due to this situation not easing, it is assumed to further significantly impact the earnings development, in particular in Health Care Products, for the remainder of the year.
COVID-19-related excess mortality in line with expectations
In the third quarter, COVID-19-related excess mortality among Fresenius Medical Care’s patients amounted to approximately 1,100 (Q1 2022: ~2,400; Q2 2022: ~800 ), in line with the Company’s expectations for the full year. Fresenius Medical Care carefully observes and assesses the development of infection rates in fall. Excess mortality accumulated to approximately 24,600 since the start of the pandemic.
The overall estimated adverse effect of accumulated excess mortality on organic growth in the Health Care Services business amounted to around 230 basis points in the third quarter.
Earnings impacted by higher labor costs and inflationary cost increases
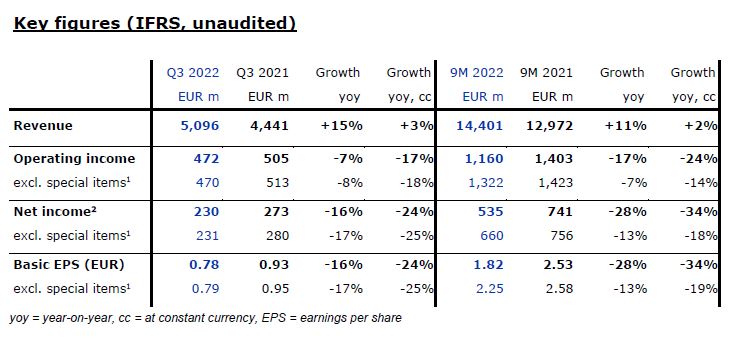
Revenue increased by 15% to EUR 5,096 million (+3% at constant currency, +2% organic) in the third quarter.
Health Care Services revenue grew by 16% to EUR 4,082 million (+2% at constant currency, +2% organic). At constant currency, this was mainly driven by organic growth in EMEA, Asia-Pacific and Latin America, which was partially offset by negative organic growth in North America due to COVID-19 and capacity constraints in certain clinics.
Health Care Products revenue increased by 11% to EUR 1,014 million (+4% at constant currency, +4% organic). Constant currency growth was mainly driven by higher sales of in-center disposables and renal pharmaceuticals, partially offset by lower sales of machines for chronic treatment.
In the first nine months, revenue grew by 11% to EUR 14,401 million (+2% at constant currency, +1% organic). Health Care Services revenue increased by 12% to EUR 11,471 million (+2% at constant currency, +1% organic); Health Care Products revenue grew by 8% to EUR 2,930 million (+3% at constant currency, +3% organic).
Operating income decreased by 7% to EUR 472 million (-17% at constant currency) in the third quarter, resulting in a margin of 9.3% (Q3 2021: 11.4%). Operating income excluding special items1 decreased by 8% to EUR 470 million (-18% at constant currency), resulting in a margin of 9.2% (Q3 2021: 11.6%). At constant currency, the decline was mainly due to higher labor costs as well as inflationary and supply chain cost increases. This was partially offset by EUR 80 million (Q3 2021: EUR 0.3 million) of Provider Relief Funding from the U.S. government to compensate for certain COVID-19-related costs.
3 Historical excess mortality updated for late entries
In the first nine months, operating income declined by 17% to EUR 1,160 million (-24% at constant currency), resulting in a margin of 8.1% (9M 2021: 10.8%). At constant currency, the development was supported by EUR 240 million (9M 2021: EUR 14 million) of Provider Relief Funding from the U.S. government to compensate for certain COVID-19-related costs. Excluding special items1, operating income decreased by 7% to EUR 1,322 million (-14% at constant currency), resulting in a margin of 9.2% (9M 2021: 11.0%).
Net income2 decreased by 16% to EUR 230 million (-24% at constant currency) in the third quarter. Excluding special items, net income2 declined by 17% to EUR 231 million (-25% at constant currency). Besides the above-mentioned effects on operating income, the constant currency decline was mainly due to an increase in the proportionate share of non-tax-deductible expenses compared to taxable income. Basic earnings per share (EPS) decreased by 16% to EUR 0.78 (-24% at constant currency). Excluding special items1, EPS declined by 17% to EUR 0.79 (-25% at constant currency).
In the first nine months, net income2 decreased by 28% to EUR 535 million (-34% at constant currency). Excluding special items1, net income2 declined by 13% to EUR 660 million (-18% at constant currency). EPS decreased by 28% to EUR 1.82 (-34% at constant currency). Excluding special items1, EPS declined by 13% to EUR 2.25 (-19% at constant currency).
Regional developments
In North America, revenue increased by 15% to EUR 3,556 million (-1% at constant currency, -2% organic) in the third quarter. At constant currency, this was mainly due to a decline in organic growth in the Health Care Services business, which was due to COVID-19 and capacity constraints in certain clinics, as well as in the Health Care Products business due to lower sales of machines for chronic treatment including the effects the machine shipping hold, products for acute care treatments and in-center disposables. These effects were only partially offset by contributions from acquisitions. In the first nine months, revenue grew by 12% to EUR 10,021 million (stable at constant currency, -1% organic).
Operating income in North America increased by 5% to EUR 469 million (-8% at constant currency) in the third quarter, resulting in a margin of 13.2% (Q3 2021: 14.5%). At constant currency, the decline in operating income was mainly due to higher labor costs, the impact of COVID-19, as well as inflationary and supply chain cost increases. This was partially offset by provider relief funding from the U.S. government to compensate for certain COVID-19-related costs, the net gain related to InterWell Health and income attributable to a consent agreement on certain pharmaceuticals. In the first nine months, operating income declined by 10% to EUR 1,113 million (-20% at constant currency), resulting in a margin of 11.1% (9M 2021: 13.9%).
Revenue in the EMEA region increased by 7% to EUR 720 million in the third quarter (+8% at constant currency, +8% organic). At constant currency, this was mainly due to organic growth in Health Care Services and Health Care Products, both including the effects of hyperinflation in Turkiye. Organic growth in Health Care Products was also driven by higher sales of in-center disposables and renal pharmaceuticals, partially offset by lower sales of acute cardiopulmonary products. In the first nine months, revenue grew by 4% to EUR 2,121 million (+6% at constant currency, +6% organic).
Operating income in EMEA decreased by 40% to EUR 48 million (-41% at constant currency) in the third quarter, resulting in a margin of 6.6% (Q3 2021: 11.7%). At constant currency, the decline in operating income was mainly due to inflationary operational cost increases, costs associated with the FME25 program, and lower income from certain equity method investees. In the first nine months, operating income declined by 27% to EUR 169 million (-26% at constant currency), resulting in a margin of 8.0% (9M 2021: 11.4%).
In Asia-Pacific, revenue increased by 13% to EUR 565 million (+7% at constant currency, +7% organic) in the third quarter. At constant currency, this was mainly driven by organic growth in the Health Care Products business, which was primarily due to higher sales of in-center disposables, products for acute care treatments and machines for chronic treatment. In the first nine months, revenue increased by 9% to EUR 1,588 million (+4% at constant currency, +4% organic).
Operating income decreased by 1% to EUR 85 million (-2% at constant currency) in the third quarter, resulting in a margin of 15.1% (Q3 2021: 17.2%). At constant currency, the decline in operating income was mainly due to inflationary cost increases and higher bad debt expenses, almost offset by favorable foreign currency transaction effects and growth in certain business lines. In the first nine months, operating income was stable and amounted to EUR 255 million (-1% at constant currency), resulting in a margin of 16.1% (9M 2021: 17.5%).
Latin America revenue increased by 36% to EUR 243 million (+36% at constant currency, +37% organic) in the third quarter, mainly driven by organic growth in the Health Care Services business, as well as higher sales of machines for chronic treatment and in-center disposables. In the first nine months, revenue grew by 25% to EUR 633 million (+23% at constant currency, +24% organic).
Operating income increased to EUR 11 million in the third quarter, resulting in a margin of 4.5% (Q3 2021: 2.4%). At constant currency, the increase in operating income was mainly due to income from investments in debt securities, favorable foreign currency transaction effects and lower bad debt expense, partially offset by inflationary cost increases. In the first nine months, operating income grew by 17% to EUR 16 million (-6% at constant currency), resulting in a margin of 2.5% (9M 2021: 2.7%).
Cash flow development
In the third quarter, Fresenius Medical Care generated EUR 658 million of operating cash flow (Q3 2021: EUR 692 million), resulting in a margin of 12.9% (Q3 2021: 15.6%). The decrease was mainly due to lower net income. In the first nine months, operating cash flow amounted to EUR 1,568 million (9M 2021: EUR 1,820 million), resulting in a margin of 10.9% (9M 2021: 14.0%).
Free cash flow4 amounted to EUR 501 million (Q3 2021: EUR 511 million) in the third quarter, resulting in a margin of 9.8% (Q3 2021: 11.5%). In the first nine months, free cash flow amounted to EUR 1,082 million (9M 2021: EUR 1,259 million), resulting in a margin of 7.5% (9M 2021: 9.7%).
Patients, clinics and employees
As of September 30, 2022, Fresenius Medical Care treated 344,593 patients in 4,153 dialysis clinics worldwide and had 122,758 employees (full-time equivalents) globally, compared to 123,528 employees as of September 30, 2021.
FME25 Savings generation on track
The target range of EUR 40-70 million set for 2022 as part of the FME25 transformation program has been reached with savings of EUR 54 million in the first nine months of the year. Fresenius Medical Care will continue to look for opportunities to extend FME25 initiatives to support the turnaround plan.
4 Net cash provided by / used in operating activities, after capital expenditures, before acquisitions, investments, and dividends
Outlook
Based on the delayed impacts of improvements in North American Health Care Services operations, the continuously challenging and uncertain macroeconomic environment, and the results for the third quarter, which had a more pronounced support by one-time effects, Fresenius Medical Care, as a matter of caution, extends its 2022 guidance range for net income decline from a high-teens to a high-teens to mid-twenties percentage range. The Company confirms its target for revenue to grow at a low single digit percentage rate in full year 2022.
Revenue and net income guidance are both on a constant currency basis and excluding special items.5
Conference call
Fresenius Medical Care will host a conference call to discuss the results of the third quarter 2022 on October 31, at 3:30 p.m. CET / 10:30 a.m. EDT. Details will be available in the “Investors” section of the Company’s website. A replay will be available shortly after the call.
5 These targets are based on the 2021 results excluding the costs related to FME25 of EUR 49 million (for Net Income). They are in constant currency and exclude special items. Special items include further costs related to FME25, the impact of the war in Ukraine, the impact of hyperinflation in Turkiye, the Humacyte investment remeasurement, the net gain related to InterWell Health and other effects that are unusual in nature and have not been foreseeable or not foreseeable in size or impact at the time of giving guidance.
This release contains forward-looking statements that are subject to various risks and uncertainties. Actual results could differ materially from those described in these forward-looking statements due to various factors, including, but not limited to, changes in business, economic and competitive conditions, legal changes, regulatory approvals, impacts related to COVID-19, results of clinical studies, foreign exchange rate fluctuations, uncertainties in litigation or investigative proceedings, and the availability of financing. These and other risks and uncertainties are detailed in Fresenius Medical Care AG & Co. KGaA's reports filed with the U.S. Securities and Exchange Commission. Fresenius Medical Care AG & Co. KGaA does not undertake any responsibility to update the forward-looking statements in this release.
Implementation of measures as presented herein may be subject to information and consultation procedures with works councils and other employee representative bodies, as per local laws and practice. Consultation procedures may lead to changes on proposed measures.
- Healthy organic sales growth and ongoing margin pressure
- Fresenius Medical Care’s business development impacted by delayed effects from improvements in North American Services business in challenging environment
- Fresenius Kabi with healthy sales growth and sequential improvement
- Fresenius Helios with strong organic sales growth, solid EBIT in line with usual third quarter seasonality
- Fresenius Vamed impacted by macroeconomic headwinds and COVID-19
If no timeframe is specified, information refers to Q3/2022.

1 Before special items, Q1/22 restated following remeasurement Humacyte investment
2 Net income attributable to shareholders of Fresenius SE & Co. KGaA
3 Excluding Ivenix and mAbxience acquisitions
For a detailed overview of special items please see the reconciliation tables on pages 22-25 in the PDF.
Michael Sen, CEO of Fresenius said, “Over the past month, I’ve met with many of my Fresenius colleagues. Like me, they have tremendous passion and commitment to patients, physicians and health care professionals. What we do is life-saving.”
Sen continued, “Everyone at Fresenius knows we must improve on what we do. My priorities are clear: Reset the company aiming at becoming a stronger company and delivering value for our shareholders. Our businesses are growing yet in a more challenging environment. Now we sharpen our focus on structural productivity. More fundamentally, we have embarked on a top-to-bottom review of every business activity, looking at the entire corporate portfolio. The focus is on returns. This will not happen overnight, but we will move at a faster pace and more decisively than ever before. This will benefit all our stakeholders. This is #FutureFresenius.”
Sen concluded, “Fresenius is a strong company, with great products, great market positions. Now we have to make it stronger.”
FY/22 Group guidance
Since Fresenius Medical Care continues to operate in a challenging environment, the impacts of the Company’s focused efforts to improve North American Health Care Services operations are delayed against previous assumptions. Therefore, Fresenius Medical Care now assumes lower contributions in the financial year 2022.
Consequently, Fresenius Medical Care now expects net income (attributable to shareholders of Fresenius Medical Care AG & Co. KGaA) for the financial year 2022 to decline in the high teens to mid-twenties percentage range. The Company continues to anticipate revenue to grow at a low-single digit percentage range in the financial year 2022. These targets are in constant currency and exclude special items.
All other business segments of the Fresenius Group, in particular Vamed, are also affected by a challenging overall economic environment. Thus, there are increased uncertainties, inflation-related cost increases, staff shortages, disruptions in supply chains, and increased energy costs. This has a direct impact on customer and patient behavior.
However, as a consequence of the development at Fresenius Medical Care, Fresenius Vamed, and in view of increasing indications of a persistent unfavorable development of these and other factors for the further course of the financial year, the Management Board has changed its risk assessment and consequently also adjusted the Group outlook for FY/22.
At constant currency, the Company now anticipates Group net income1,2 to decline around ten percent (previously: decline in a low-to-mid single-digit percentage range). Group sales3 in constant currency continue to be expected to grow in a low-to-mid single-digit percentage range.
Without the closed acquisition of Ivenix and the completed acquisition of a majority stake in mAbxience as well as any further potential acquisitions, Fresenius expects the net debt/EBITDA4 ratio to be roughly on the same level as in Q3/22 (3.64x5) by the end of 2022 (December 31, 2021: 3.51x5).
1 Net income attributable to shareholders of Fresenius SE & Co. KGaA
2 FY/21 base: €1,867 million, before special items; FY/22: before special items
3 FY/21 base: €37,520 million
4 At LTM average exchange rates for both net debt and EBITDA; pro forma closed acquisitions/divestitures; excluding further potential acquisitions; before special items; including lease liabilities
5 At LTM average exchange rates for both net debt and EBITDA; pro forma closed acquisitions/divestitures;
before special items; including lease liabilities
For a detailed overview of special items please see the reconciliation tables on pages 22-25 in the PDF.
Assumptions for guidance FY/22
For 2022 and beyond, Fresenius expects that the current challenging market environment and the global macro-economic headwinds will remain. In particular, the general cost inflation, labor shortages, meaningful uncertainty with regard to the future development of energy prices, burdens from supply chain disruptions and ongoing impacts of the COVID-19 pandemic are expected to continue. The guidance does not consider a significant disruption of gas or electricity supplies in Europe.
Fresenius will continue to closely monitor the potential further consequences of the overall heightened volatility and muted visibility, including balance sheet valuations.
The war in Ukraine is directly and indirectly affecting Fresenius Group operations. The direct adverse effects of the war amounted to €24 million at net income1 level of Fresenius Group in Q1-3/22 and are treated as a special item.
An unlikely but possible significant deterioration of the situation triggering containment measures that could have a significant and direct impact on the health care sector without any appropriate compensation is not reflected in the Group’s FY/22 guidance.
For Fresenius Medical Care‘s contribution to the Group’s financial figures, the assumptions for Fresenius Medical Care's FY/22 guidance are also fully applicable to Fresenius Group's FY/22 guidance.
All of these assumptions are subject to considerable uncertainty.
The acquisitions of Ivenix and of the majority stake in mAbxience as well as any further potential acquisitions remain excluded from guidance.
1 Net income attributable to shareholders of Fresenius SE & Co. KGaA
5% sales increase in constant currency
Group sales increased by 12% (5% in constant currency) to €10,459 million (Q3/21: €9,324 million). Organic growth was 4%. Acquisitions/divestitures contributed net 1% to growth. Currency translation increased sales growth by 7%. Excluding estimated COVID-19 effects1, Group sales growth would have been 4% to 5% in constant currency (Q3/21: 7% to 8%).
In Q1-3/22, Group sales increased by 10% (4% in constant currency) to €30,197 million (Q1-3/21: €27,554 million). Organic growth was 3%. Acquisitions/divestitures contributed net 1% to growth. Currency translation increased sales growth by 6%. Excluding estimated COVID-19 effects1, Group sales growth would have been 3% to 4% in constant currency (Q1-3/21: 5% to 6%).
19% net income2,3,4 decline in constant currency
Group EBITDA before special items decreased by 2% (-10% in constant currency) to €1,662 million (Q3/212: €1,703 million). Reported Group EBITDA was €1,658 million (Q3/21: €1,667 million).
In Q1-3/22, Group EBITDA before special items remained nearly unchanged (-6% in constant currency) at €5,006 million (Q1-3/212: €5,008 million). Reported Group EBITDA was €4,781 million (Q1-3/21: €4,957 million).
Group EBIT before special items decreased by 9% (-17% in constant currency) to €949 million (Q3/212: €1,044 million). The decrease was mainly driven by higher labor costs at Fresenius Medical Care in the U.S., general cost inflation, revaluation of contract assets in the international service and project business at Fresenius Vamed as well as higher costs in the Corporate segment. The EBIT margin before special items was 9.1% (Q3/212: 11.2%). Reported Group EBIT was €887 million (Q3/21: €1,008 million).
In Q1-3/22, Group EBIT before special items decreased by 4% (-10% in constant currency) to €2,952 million (Q1-3/212: €3,086 million). The EBIT margin before special items was 9.8% (Q1-3/212: 11.2%). Reported Group EBIT was €2,634 million (Q1-3/21: €3,035 million).
1 For estimated COVID-19 effects please see table on page 20.
2 Before special items
3 Net income attributable to shareholders of Fresenius SE & Co. KGaA
4 Excluding Ivenix and mAbxience acquisitions
For a detailed overview of special items please see the reconciliation tables on pages 22-25 in the PDF.
Group net interest before special items was -€141 million (Q3/211: -€126 million) mainly due to currency translation effects and overall higher interest rates. Reported Group net interest decreased to -€141 million (Q3/21: -€126 million).
In Q1-3/22, Group net interest before special items improved to -€376 million (Q1-3/211: -€384 million). Reported Group net interest improved to -€375 million (Q1-3/21: -€384 million).
Group tax rate before special items was 25.0% (Q3/211: 22.9%) mainly due to an increase in the proportionate share of non-tax-deductible expenses compared to taxable income at Fresenius Medical Care. Reported Group tax rate was 26.1% (Q3/21: 22.8%). In Q1-3/22, Group tax rate before special items was 23.5% (Q1-3/211: 22.4%) while the reported Group tax rate was 24.1% (Q1-3/21: 22.3%).
Noncontrolling interests before special items were -€235 million (Q3/211: -€273 million) of which 90% were attributable to the noncontrolling interests in Fresenius Medical Care. Reported noncontrolling interests were -€230 million (Q3/21: -€268 million).
In Q1-3/22, Noncontrolling interests before special items were -€686 million (Q1-3/211: -€751 million) of which 89% were attributable to the noncontrolling interests in Fresenius Medical Care. Reported noncontrolling interests were -€597 million (Q1-3/21: -€741 million).
Group net income2 before special items decreased by 15% (-22%/-19%3 in constant currency) to €371 million (Q3/211: €435 million). The decrease was mainly driven by higher labor costs at Fresenius Medical Care in the U.S., general cost inflation, revaluation of contract assets in the international service and project business at Fresenius Vamed as well as higher costs in the Corporate/Other segment. Moreover, increased interest expenses and a higher tax rate had a negative effect on Group net income. Excluding estimated COVID-19 effects4, Group net income2 before special items was -26% to -22% in constant currency (Q3/21: 12% to 16%). Reported Group net income2 decreased to €321 million (Q3/21: €413 million).
In Q1-3/22, Group net income2 before special items decreased by 5% (-10%/-8%3 in constant currency) to €1,284 million (Q1-3/211: €1,346 million). Excluding estimated COVID-19 effects4, Group net income2 before special items was -15% to -11% in constant currency (Q1-3/21: 7% to 11%). Reported Group net income2 decreased to €1,117 million (Q1-3/21: €1,319 million).
1 Before special items
2 Net income attributable to shareholders of Fresenius SE & Co. KGaA
3 Excluding Ivenix and mAbxience acquisitions
4 For estimated COVID-19 effects please see table on page 20
For a detailed overview of special items please see the reconciliation tables on pages 22-25 in the PDF.
Earnings per share1 before special items decreased by 15% (-22% in constant currency) to €0.66 (Q3/212: €0.78). Reported earnings per share1 were €0.57 (Q3/21: €0.74).
In Q1-3/22, earnings per share1 before special items decreased by 5% (-10% in constant currency) to €2.29 (Q1-3/212: €2.41). Reported earnings per share1 were €1.99 (Q1-3/21: €2.36).
Continued investment in growth
Spending on property, plant and equipment was €416 million corresponding to 4% of sales (Q3/21: €449 million; 5% of sales). These investments served primarily for the modernization and expansion of dialysis clinics, production facilities as well as hospitals and day clinics. In Q1-3/22, spending on property, plant and equipment was €1,173 million corresponding to 4% of sales (Q1-3/21: €1,342 million; 5% of sales).
Total acquisition spending was €502 million (Q3/21: €167 million), mainly for the majority stake in mAbxience by Fresenius Kabi. In Q1-3/22, total acquisition spending was €955 million (Q1-3/21: €807 million).
Cash flow development
Group operating cash flow increased to €1,256 million (Q3/21: €1,226 million) with a margin of 12.0% (Q3/21: 13.1%). Free cash flow before acquisitions and dividends increased to €876 million (Q3/21: €793 million). Free cash flow after acquisitions and dividends decreased to €388 million (Q3/21: €594 million).
In Q1-3/22, Group operating cash flow decreased to €2,374 million (Q1-3/21: €3,329 million) with a margin of 7.9% (Q1-3/21: 12.1%). Free cash flow before acquisitions and dividends decreased to €1,202 million (Q1-3/21: €1,986 million). Free cash flow after acquisitions and dividends decreased to -€406 million (Q1-3/21: €352 million).
Solid balance sheet structure
Group total assets increased by 12% (4% in constant currency) to €80,328 million (Dec. 31, 2021: €71,962 million) given currency translation effects, acquisitions and the expansion of business activities. Current assets increased by 11% (6% in constant currency) to €19,443 million (Dec. 31, 2021: €17,461 million), mainly driven by the increase of trade accounts receivables and inventories. Non-current assets increased by 12% (4% in constant currency) to €60,885 million (Dec. 31, 2021: €54,501 million).
Total shareholders’ equity increased by 17% (6% in constant currency) to €34,156 million (Dec. 31, 2021: €29,288 million). The equity ratio was 42.5% (Dec. 31, 2021: 40.7%).
Group debt increased by 5% (1% in constant currency) at €28,607 million (Dec. 31, 2021: € 27,155 million). Group net debt increased by 9% (4% in constant currency) to € 26,479 million (Dec. 31, 2021: € 24,391 million).
As of September 30, 2022, the net debt/EBITDA ratio was 3.74x1,2 (Dec. 31, 2021: 3.51x1,2) mainly driven by lower EBITDA contribution as well as acquisition spending. The net debt/EBITDA as of September 30, 2022 excluding the closed acquisition of Ivenix and the completed acquisition of a majority stake in mAbxience was 3.641,2.
1 At LTM average exchange rates for both net debt and EBITDA; pro forma closed acquisitions/divestitures
2 Before special items
For a detailed overview of special items please see the reconciliation tables on pages 22-25 in the PDF.
Business Segments
Fresenius Medical Care
(Financial data according to Fresenius Medical Care press release)Fresenius Medical Care is the world's largest provider of products and services for individuals with renal diseases. As of September 30, 2022, Fresenius Medical Care was treating 344,593 patients in 4,153 dialysis clinics. Along with its core business, the Renal Care Continuum, the company focuses on expanding in complementary areas and in the field of critical care.

- Business development continues to be strongly impacted by uncertain inflationary macroeconomic environment
- Impacts of improvements in North American Health Care Services operations delayed
- COVID-19-related excess mortality in line with expectations
- Important step in value-based care achieved with closing of InterWell Health merger
Sales increased by 15% (3% in constant currency) to €5,096 million (Q3/21: €4,441 million). Organic growth was 2%. Currency translation increased sales growth by 12%. In Q1-3/22, sales increased by 11% (2% in constant currency) to €14,401 million (Q1-3/21: €12,972 million). Organic growth was 1%. Currency translation increased sales growth by 9%.
EBIT decreased by 7% (-17% in constant currency) to €472 million (Q3/21: €505 million) resulting in a margin of 9.3% (Q3/21: 11.4%). EBIT before special items decreased by 8% (-18% in constant currency) to €470 million (Q3/21: €513 million), resulting in a margin1 of 9.2% (Q3/21: 11.6%). At constant currency, the decline was mainly due to higher labor costs as well as inflationary and supply chain cost increases. This was partially offset by €80 million (Q3 2021: €0.3 million) of Provider Relief Funding from the U.S. government to compensate for certain COVID-19-related costs. In Q1-3/22, EBIT decreased by 17% (-24% in constant currency) to €1,160 million (Q1-3/21: €1,403 million) resulting in a margin of 8.1% (Q1-3/21: 10.8%). EBIT before special items decreased by 7% (-14% in constant currency) to €1,322 million (Q1-3/21: €1,423 million), resulting in a margin1 of 9.2% (Q1-3/21: 11.0%).
Net income2 decreased by 16% (-24% in constant currency) to €230 million (Q3/21: €273 million). Net income2 before special items decreased by 17% (-25% in constant currency) to €231 million (Q3/21: €280 million). Besides the above-mentioned effects on operating income, the constant currency decline was mainly due to an increase in the proportionate share of non-tax-deductible expenses compared to taxable income.
In Q1-3/22, net income2 decreased by 28% (-34% in constant currency) to €535 million (Q1-3/21: €741 million). Net income2 before special items decreased by 13% (-18% in constant currency) to €660 million (Q1-3/21: €756 million).
Operating cash flow was €658 million (Q3/21: €692million) with a margin of 12.9% (Q3/21: 15.6%). The decrease was mainly due to lower net income. In Q1-3/22, operating cash flow was €1,568 million (Q1-3/21: €1,820 million) with a margin of 10.9% (Q1-3/21: 14.0%).
Based on the delayed impacts of improvements in North American Health Care Services operations, the continuously challenging and uncertain macroeconomic environment, and the results for the third quarter, which had a more pronounced support by one-time effects, Fresenius Medical Care, as a matter of caution, extends its 2022 guidance range for net income2,3 decline from a high-teens to a high-teens to mid-twenties percentage range. The Company confirms its target for revenue4 to grow at a low single digit percentage rate in full year 2022. Revenue and net income guidance are both on a constant currency basis and excluding special items5.
1 Before special items
2 Net income attributable to shareholders of Fresenius Medical Care AG & Co. KGaA
3 FY/21 base: €1,018 million, before special items; FY/22 before special items
4 FY/21 base: €17,619 million
5 These targets are based on the 2021 results excluding the costs related to FME25 of EUR 49 million (for Net Income). They are in constant currency and exclude special items. Special items include further costs related to FME25, the impact of the war in Ukraine, the impact of hyperinflation in Turkiye, the Humacyte investment remeasurement, the net gain related to InterWell Health and other effects that are unusual in nature and have not been foreseeable or not foreseeable in size or impact at the time of giving guidance.
For a detailed overview of special items please see the reconciliation tables on pages 22-25 in the PDF.
InterWell Health merger closed
With the closing of the three-way merger of Fresenius Health Partners, InterWell Health and Cricket Health, a premier value-based kidney care provider has been created in the U.S. This is an important step in the execution of Fresenius Medical Care’s strategy. The new company operates under the InterWell Health brand and will be fully consolidated by Fresenius Medical Care as the majority owner. The closing of the merger resulted in a net gain of €56 million (on EBIT level) in the third quarter, which is treated as a special item.
For further information, please see Fresenius Medical Care’s press release at www.freseniusmedicalcare.com.
Fresenius Kabi
Fresenius Kabi offers intravenously administered generic drugs, clinical nutrition and infusion therapies for seriously and chronically ill patients in the hospital and outpatient environments. The company is also a leading supplier of medical devices and transfusion technology products. In the biosimilars business, Fresenius Kabi develops products with a focus on oncology and autoimmune diseases.

1 Before special items
2 Net income attributable to shareholders of Fresenius SE & Co. KGaA
3 Excluding Ivenix and mAbxience acquisitions
For a detailed overview of special items please see the reconciliation tables on pages 22-25 in the PDF.
- Solid organic sales growth in all three growth vectors against already strong Q3/21
- Biopharmaceuticals continue strong trajectory in line with ambitious plan
- Growth in Europe and rest of the world outweighing pressures in North America
- Sequentially constant EBIT margin3 despite headwinds from cost increases
Sales increased by 12% (4% in constant currency) to €2,071 million (Q3/21: €1,854 million). Organic growth was 3%. In Q1-3/22, sales increased by 8% (2% in constant currency) to €5,814 million (Q1-3/21: €5,370 million). Organic growth was 2%. Positive currency translation effects of 8% in Q3/22 and 6% in Q1-3/22 were mainly related to the U.S. dollar and Chinese yuan.
Sales in North America increased by 13% (organic growth: -2%) to €668 million (Q3/21: €589 million). The significant sales growth was mainly driven by positive currency effects while organic growth continued to be impacted by ongoing competitive pressure and supply chain challenges. In Q1-3/22, sales in North America increased by 11% (organic growth: -1%) to €1,853 million (Q1-3/21: €1,669 million).
Sales in Europe increased by 8% (organic growth: 6%) to €669 million (Q3/21: €620 million) driven by a broad-based positive development, and biopharmaceuticals. In Q1-3/22, sales in Europe increased by 5% (organic growth: 4%) to €1,967 million (Q1-3/21: €1,880 million).
Sales in Asia-Pacific increased by 4% (organic growth: -4%) to €467 million (Q3/21: €447 million). Organic growth was affected by price pressure from the NVBP (National Volume-Based Procurement) tenders in China. In Q1-3/22, sales in Asia-Pacific increased by 6% (organic growth: -2%) to €1,325 million (Q1-3/21: €1,248 million).
Sales in Latin America/Africa increased by 35% (organic growth: 27%) to €267 million (Q3/21: €198 million), due to a positive business development in both regions. In Q1-3/22, sales in Latin America/Africa increased by 17% (organic growth: 11%) to €669 million (Q1-3/21: €573 million).
Sales in the Biopharmaceuticals business was €64 million. In Q1-3/22, sales in the Biopharmaceuticals business was €116 million.
EBIT1 decreased by 7% (-18%/-11% in constant currency) to €280 million (Q3/21: €300 million), mainly related to ongoing cost inflation, supply chain challenges as well as competitive pressure. EBIT margin1 was 13.5% (Q3/21: 16.2%). Excluding the acquisitions of Ivenix and the majority stake in mAbxience, the constant currency EBIT margin1 was sequentially stable at 14.6%2 in Q3/22 (Q2/22: 14.7%2) despite the mentioned headwinds. In Q1-3/22, EBIT1 decreased by 3% (-12%/-9%2 in constant currency) to €844 million (Q1-3/21: €874 million) with an EBIT margin1 of 14.5%/15.0%2 (Q1-3/21: 16.3%).
Net income1,3 decreased by 11% (-21% in constant currency) to €184 million (Q3/21: €206 million). In Q1-3/22, net income1,3 decreased by 4% (-13% in constant currency) to €574 million (Q1-3/21: €600 million).
1 Before special items
2 Excluding Ivenix and mAbxience acquisitions
3 Net income attributable to shareholders of Fresenius SE & Co. KGaA
For a detailed overview of special items please see the reconciliation tables on pages 22-25 in the PDF.
Operating cash flow decreased to €301 million (Q3/21: €393 million) with a margin of 14.5% (Q3/21: 21.2%), mainly driven by a working capital build-up from e.g. higher inventories. In Q1-3/22, operating cash flow decreased to €543 million (Q1-3/21: €868 million) with a margin of 9.3% (Q1-3/21: 16.2%).
For FY/22, Fresenius Kabi confirms its outlook and expects organic sales1 growth in a low-single-digit percentage range. Constant currency EBIT2 is expected to decline in a high-single- to low-double-digit percentage range. Both sales and EBIT outlook include expected COVID-19 effects. The financial effects from the acquisitions of Ivenix and the majority stake in mAbxience remain excluded from guidance.
1 FY/21 base: €7,193 million
2 FY/21 base: €1,153 million, before special items, FY/22 before special items,
excluding Ivenix and mAbxience acquisitions
For a detailed overview of special items please see the reconciliation tables on pages 22-25 in the PDF.
Fresenius Helios
Fresenius Helios is Europe's leading private hospital operator. The company comprises Helios Germany, Helios Spain and Helios Fertility. Helios Germany operates 87 hospitals, ~130 outpatient centers and 6 prevention centers. Helios Spain operates 50 hospitals, 101 outpatient centers and around 300 occupational risk prevention centers. In addition, the company is active in Latin America with 8 hospitals and as a provider of medical diagnostics. Helios Fertility offers a wide spectrum of state-of-the-art services in the field of fertility treatments.

- Fresenius Helios with strong organic sales growth; solid EBIT development in line with usual third quarter seasonality
- Helios Germany with gradually improving admissions
- Helios Spain with ongoing healthy activity levels
- Helios Fertility with lower volumes driven by delayed treatments
Sales increased by 8% (7% in constant currency) to €2,829 million (Q3/21: €2,622 million). Organic growth was 6%. Acquisitions, mainly at Helios Fertility, contributed 2% to sales growth. Divestments reduced sales by 1%. In Q1-3/22, sales increased by 8% (8% in constant currency) to €8,685 million (Q1-3/21: €8,009 million). Organic growth was 6%. Acquisitions contributed 2% to sales growth.
Sales of Helios Germany increased by 6% (organic growth: 5%) to €1,731 million (Q3/21: €1,640 million), mainly driven by gradually increasing admissions, which are however still below pre-pandemic levels. Acquisitions contributed 1% to sales growth. In Q1-3/22, sales of Helios Germany increased by 6% (organic growth: 5%) to €5,272 million (Q1-3/21: €4,988 million). Acquisitions contributed 1% to sales growth.
Sales of Helios Spain increased by 10% (9% in constant currency) to €1,037 million (Q3/21: €941 million). Organic growth of 8% was driven by the continuous high level of treatment activity. The clinics in Latin America also showed a good performance. Acquisitions contributed 1% to sales growth. In Q1-3/22, sales of Helios Spain increased by 10% (9% in constant currency) to €3,227 million (Q1-3/21: €2,937 million). Organic growth was 9%.
Sales of the Helios Fertility were €62 million (Q3/21: €40 million). In Q1-3/22, sales of the Helios Fertility were €184 million.
EBIT1 remained stable (-1% in constant currency) at €222 million (Q3/21: €222 million) with an EBIT margin1 of 7.8% (Q3/21: 8.5%). In Q1-3/22, EBIT1 increased by 5% (5% in constant currency) to €831 million (Q1-3/21: 788 million) with an EBIT margin1 of 9.6% (Q1-3/21: 9.8%).
EBIT1 of Helios Germany increased by 1% to €141 million (Q3/21: €140 million) with an EBIT margin1 of 8.1% (Q3/21: 8.5%). The increase of costs from the use of external staff due to COVID-19 related staff absenteeism continued to weigh on profitability. Inflationary cost effects had only a small negative impact. In Q1-3/22, EBIT1 of Helios Germany increased by 2% to €449 million (Q1-3/21: €442 million) with an EBIT margin1 of 8.5% (Q1-3/21: 8.9%).
EBIT1 of Helios Spain increased by 5% (3% in constant currency) to €83 million (Q3/21: €79 million) despite increased cost inflation. The EBIT margin1 was 8.0% (Q3/21: 8.4%). In Q1-3/22, EBIT1 of Helios Spain increased by 9% (9% in constant currency) to €384 million (Q1-3/21: €352 million). The EBIT margin1 was 11.9% (Q1-3/21: 12.0%).
EBIT1 of Helios Fertility was €4 million with an EBIT margin1 of 6.5% (Q3/21: €9 million). Lower volumes by delayed treatments driven by macroeconomic environment. Prior year quarter was inflated by a positive special item. In Q1-3/22, EBIT1 of Helios Fertility was €15 million (Q1-3/21: €14 million) with an EBIT margin1 of 8.2%.
Net income1,2 increased by 2% (1% in constant currency) to €138 million (Q3/21: €135 million). In Q1-3/22, net income1,2 increased by 6% (5% in constant currency) to €530 million (Q1-3/21: €501 million).
Operating cash flow increased to €353 million (Q3/21: €157 million) with a margin of 12.5% (Q3/21: 6.0%) mainly due to an improved receivables management in Spain. In Q1-3/22, operating cash flow decreased to €411 million (Q1-3/21: €595 million) with a margin of 4.7% (Q1-3/21: 7.4%)
For FY/22, Fresenius Helios confirms its outlook and expects organic sales3 growth in a low- to mid-single-digit percentage range and constant currency EBIT4 growth in a mid-single-digit percentage range. Both sales and EBIT outlook include expected COVID-19 effects.
1 Before special items
2 Net income attributable to shareholders of Fresenius SE & Co. KGaA
3 FY/21 base: €10,891 million
4 FY/21 base: €1,127 million, before special items, FY/22 before special items
For a detailed overview of special items please see the reconciliation tables on pages 22-25 in the PDF.
Fresenius Vamed
Fresenius Vamed manages projects and provides services for hospitals and other health care facilities worldwide and is a leading post-acute care provider in Central Europe. The portfolio ranges along the entire value chain: from project development, planning, and turnkey construction, via maintenance and technical management to total operational management.

- Service business with solid top-line performance, but higher than estimated COVID-19 impact in rehabilitation business impacts earnings
- Despite improved top-line development, macro challenges remain a headwind in the project business
- Revaluation of contractual assets in the international service and project business weighed on EBIT development
Sales increased by 11% (10% in constant currency) to €572 million (Q3/21: €516 million). Organic growth was 10%. In Q1-3/22, sales increased by 6% (6% in constant currency) to €1,647 million (Q1-3/21: €1,549 million). Organic growth was 6%.
Sales in the service business increased by 2% (1% in constant currency) to €418 million (Q3/21: €410 million) due to increasing rehabilitation treatments given fewer capacity restrictions. Sales in the project business increased by 45% (45% in constant currency) to €154 million (Q3/21: €106 million. In Q1-3/22, sales in the service business increased by 6% (5% in constant currency) to €1,240 million (Q1-3/21: €1,165 million). Sales in the project business increased by 6% (6% in constant currency) to €407 million (Q1-3/21: €384 million).
EBIT1 decreased by 57% to €10 million (Q3/21: €23 million) with an EBIT margin1 of 1.7% (Q3/21: 4.5%) driven by macroeconomic headwinds, ongoing COVID impacts, cost inflation as well as the revaluation of contractual assets in the international service and project business. In Q1-3/22, EBIT1 decreased by 17% to €29 million (Q1-3/21: €35 million) with an EBIT margin1 of 1.8% (Q1-3/21: 2.3%).
Net income1,2 decreased by 64% to €5 million (Q3/21: €14 million). In Q1-3/22, Net income1,2 decreased by 17% to €15 million (Q1-3/21: €18 million).
Order intake was €153 million (Q3/21: €120 million). In Q1-3/22 order intake was €669 million (Q1-3/21: €971 million). As of September 30, 2022, order backlog was at €3,726 million (December 31, 2021: €3,473 million).
Operating cash flow decreased to -€18 million (Q3/21: €9 million) with a margin of -3.1% (Q3/21: 1.7%), due to working capital build-ups. In Q1-3/22, operating cash flow decreased to -€56 million (Q1-3/21: €23 million) with a margin of -3.4% (Q1-3/21: 1.5%).
Fresenius Vamed adjusts its outlook for FY/22 and now expects organic sales3 to grow in a mid-single digit percentage range (previously: high-single to low-double-digit percentage range). Constant currency EBIT4 is expected to be around €100 million (previously: return to absolute pre-COVID-19 levels (FY/19: €134 million). Both sales and EBIT outlook include expected COVID-19 effects.
1 Before special items
2 Net income attributable to shareholders of VAMED AG
3 FY/21 base: €2,297 million
4 FY/21 base: €101 million, before special items; FY/22 before special items
For a detailed overview of special items please see the reconciliation tables on pages 22-25 in the PDF.
This release contains forward-looking statements that are subject to various risks and uncertainties. Future results could differ materially from those described in these forward-looking statements due to certain factors, e.g. changes in business, economic and competitive conditions, regulatory reforms, results of clinical trials, foreign exchange rate fluctuations, uncertainties in litigation or investigative proceedings, the availability of financing and unforeseen impacts of international conflicts. Fresenius does not undertake any responsibility to update the forward-looking statements in this release.