
At Fresenius, we are at the heart of healthcare. For all our activities, our patients take center stage. We focus on world-class therapies, which we continuously improve to keep pace with the major trends in healthcare. Our therapy focus is reflected in three platforms:
(Bio)Pharma
Biosimilars
IV Generics and Fluids
Clinical Nutrition
MedTech
Infusion and Nutrition Systems
Transfusion Medicine and Cell Therapies
Care Provision
Inpatient and Outpatient Treatments
Occupational Healthcare and Prevention
Reproductive Medicine
Furthermore, our Investment Company Fresenius Vamed expands our offering to:
Project Business and Services
Rehabilitation, Care and Health Tourism
An open dialog with our shareholders and the financial community is important to us. The Fresenius Investor Relations team will be happy to answer all your questions and inquiries.
You can submit your Feedback quickly and easily (anonymously if you prefer). You will be redirected to QuantiFire which conducts this survey in own controllership.
Fresenius SE & Co. KGaA
Investor Relations
Else-Kröner-Str. 1
D-61352 Bad Homburg
Germany
ir-fre@fresenius.com
Postal address:
Fresenius SE & Co. KGaA
Investor Relations
D-61346 Bad Homburg v.d.H.
Nick Stone
Senior Vice President Investor Relations
Head of Investor Relations
T: +49 (0) 6172 608-97033
nick.stone@fresenius.com
Karen Janek
Assistant Investor Relations
T: +49 (0) 6172 608-2487
karen.janek@fresenius.com
Florian Feick
Vice President Investor Relations
Deputy Head of Investor Relations
T: +49 (0) 6172 608-5167
florian.feick@fresenius.com
Kacper Boborykin
Director Investor Relations
(US based)
T: +1 224 566 1998
kacper.boborykin@fresenius.com
Stefanie Drees
Director Investor Relations
T: +49 (0) 6172 608-5211
stefanie.drees@fresenius.com
Felix Klein
Director Investor Relations
T: +49 (0) 6172 608-96484
felix.klein@fresenius.com
Michael Otto
Director Investor Relations
T: +49 (0) 6172 608-2419
michael.otto@fresenius.com
Elisabeth Truckenbrodt
Director Investor Relations
T: +49 (0) 6172 608-2486
elisabeth.truckenbrodt@fresenius.com
Mara Sinsel
Senior Manager Investor Relations
T: +49 (0) 6172 608-96538
mara.sinsel@fresenius.com
Luca Thorißen
Senior Manager Investor Relations
T +49 6172 608-97049
luca.thorissen@fresenius.com
Elisabeth Jung
Senior Manager Investor Relations
T: +49 (0) 6172 608-2421
elisabeth.jung@fresenius.com
Annette Hainz
Manager Investor Relations
T: +49 (0) 6172 608-2604
annette.hainz@fresenius.com
Based on the outcomes of the materiality assessment 2023, we consider following topical standards of the European Sustainability Reporting Standards as material:
- Climate change
- Pollution
- Water and marine resources
- Resource use and circular economy
- Own workforce
- Workers in the value chain
- Consumers and end-users
- Digitalization
- Innovation
- Business conduct
- Cybersecurity
Our materiality analysis is based on the principle of double materiality and complies with the requirements of the European Sustainability Reporting Standards. The aim is to identify the material impacts, risks, and opportunities that arise in our own business and along our value chain. The sustainability aspects that are relevant for us and our stakeholders arise from this.
In line with the principle of double materiality, we have considered sustainability from two different perspectives:
- Impact materiality: includes all potential and actual positive and negative impacts of Fresenius’ operations on our stakeholders, including social and environmental impacts
- Financial materiality: includes all financial risks and opportunities that could affect Fresenius’ future profitability due to sustainability aspects. This encompasses the financial performance, results of operations, cash flows, access to finance or cost of capital of Fresenius.
A sustainability aspect fulfills the double materiality criterion if it is material from either or both perspectives.
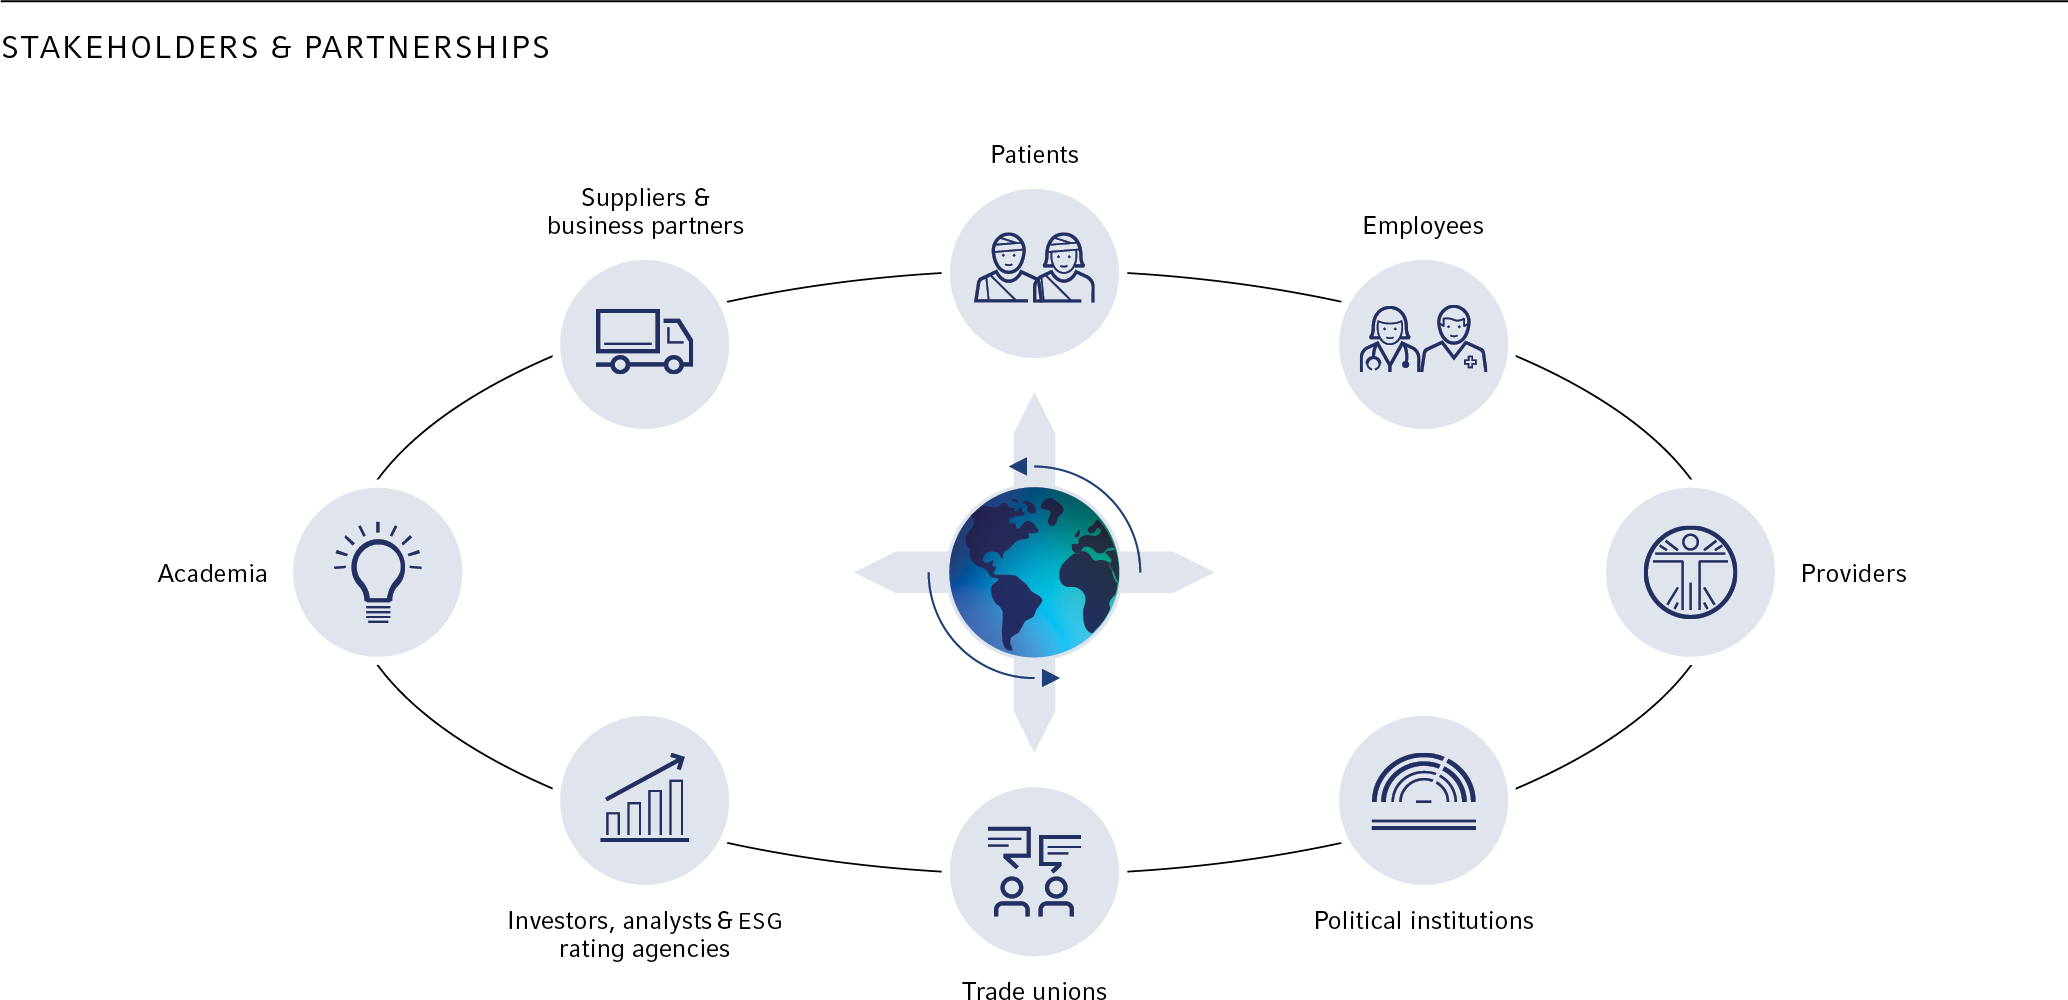
Stakeholders and partnerships
Fresenius is integrated into a diverse network of interest groups. From this exchange, we gain valuable insights that help us to continuously improve the management of material topics and reporting.
We engage with our stakeholders through a variety of channels. The corporate functions at Fresenius primarily focus on stakeholders who are relevant to the Group as a whole. The business segments actively engage with patients, employees, customers, and regulatory authorities, among others.
For the integration of affected stakeholders in our operating activities, we consider, for example findings from existing due diligence processes and risk assessments in the area of quality, internal employee satisfaction surveys, dialogs with employee representatives and works councils, patient and customer surveys. Another important element of our stakeholder dialogs is our active participation in industry and interest groups, as well as our exchange with business partners.
For more information on this topic see the Sustainability Statement.
Contact
If you have any questions about sustainability, please contact us:
sustainability@fresenius.com
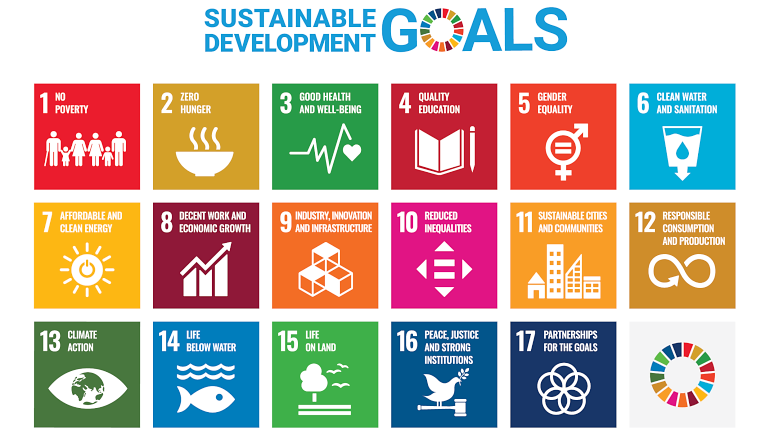
Our contribution to the UN Sustainable Development Goals
The 17 Sustainable Development Goals (SDGs) with 169 targets, adopted by the 191 member states of the United Nations (UN) back in 2015, are the roadmap for tackling mankind´s key challenges on the path to a more sustainable world, such as poverty, discrimination and climate change. To achieve these goals, the public sector, governments and companies must work together.
As a global healthcare group, we are doing our part. Our activities might be relevant with regards to all the 17 SDGs, we see a direct link between our core business activities and our sustainability ambition and the SDGs listed below.
For a holistic overview of our sustainability related activities incl. potential risks, please refer to our Sustainability Statement and our Sustainability Highlights Magazine 2024.
Ensure healthy lives and promote well-being for all at all ages

For more than 100 years, we have been committed to preserving life, promoting health and improving the quality of life for our patients. As an employer, it´s our priority to create a safe and healthy working environment, and to prevent occupational diseases.
Learn more:
Ensure inclusive and equitable quality education and promote lifelong learning opportunities for all

We are convinced that lifelong learning is essential to the personal success of our employees and the basis for the future viability of our company. This is why, we provide our employees with multiple learning opportunities, engage in the area of vocational trainings and dual study programs.
Learn more:
Ensure availability and sustainable management of water and sanitation for all

Water is one of earths' most precious resources. As a company we rely on access to clean water for providing high-quality and safe healthcare to people, and for the manufacturing of medical products. We focus on efficient water use and take measures to prevent water pollution.
Learn more:
Promote sustained, inclusive and sustainable economic growth, full and productive employment and decent work for all

We are committed to providing a fair and respectful work environment that promotes equal opportunities, along with safe and healthy working conditions and fair and appropriate wages. We expect our business partners to support our commitment to human rights and to take respective measures in their value chains.
Learn more:
Build resilient infrastructure, promote inclusive and sustainable industrialization and foster innovation

We bring healthcare innovation to people. As part our of our activities we create and strengthen infrastructure in the healthcare sector. With our research & development activities we aim for innovations that increase access to healthcare, enable modernization and digitalization in healthcare and improve treatment options through research, telemedicine and artificial intelligence.
Learn more:
Take urgent action to combat climate change and its impacts

Climate action is at the core of our sustainability efforts. We work towards increasing energy efficiency and make use of renewable energy sources to continuously reduce our carbon footprint.
Learn more:
Strengthen the means of implementation and revitalize the Global Partnership for Sustainable Development

Achieving the vision behind Agenda 2030 requires concerted efforts and collaboration among multiple stakeholders at local and global levels. We engage in sector-specific and cross-sector multi-stakeholder initiatives and foster collaboration in areas such as innovation and education.
Learn more:
Contact
If you have any questions about sustainability, please contact us:
sustainability@fresenius.com