
Fresenius Helios completed today its acquisition of a 519-bed municipal hospital in the German state of North Rhine-Westphalia. Located in the city of Velbert, the hospital had 2015 sales of about €69 million. The acquisition, which was announced in February, will be accretive to Fresenius Group earnings from this year.
The Supervisory Board of Fresenius Medical Care AG & Co. KGaA has decided in its meeting on March 9, 2016, to propose to the Annual General Meeting on May 12, 2016 the following candidates for regular election to the Supervisory Board:
- Dr. Gerd Krick, former Chairman of the Management Board of Fresenius AG, Chairman of the Supervisory Board since 1998
- Dr. Dieter Schenk, attorney and tax advisor, partner of Noerr LLP, Vice Chairman of the Supervisory Board since 1996
- Rolf A. Classon, Chairman of the Board of Directors of Hill-Rom Corp. (formerly Hillenbrand Industries, Inc.), member of the Supervisory Board since 2011
- William P. Johnston, former Chairman of the Board of Directors of the Renal Care Group, Inc., member of the Supervisory Board since 2006
- Deborah Doyle McWhinney, former Chief Executive Officer and Chief Operating Officer of Citi Enterprise Payments (Citigroup, Inc.)
- Pascale Witz, Executive Vice President, Global Diabetes & Cardiovascular, Sanofi S.A.
In case of the election by the Annual General Meeting, two new members, Deborah Doyle McWhinney and Pascale Witz, will join the Supervisory Board. Dr. Walter L. Weisman, member of the Supervisory Board since 1996, as well as Prof. Dr. Bernd Fahrholz, member of the Supervisory Board since 1998, will leave the Supervisory Board following the Annual General Meeting on May 12, 2016.
The Supervisory Board proposes the election of the candidates to the Supervisory Board for a 5 year term until the conclusion of the Annual General Meeting which resolves on the discharge for fiscal year 2020.
It is intended to propose the election of Dr. Gerd Krick as Chairman of the Supervisory Board in case of his reelection as a member of the Supervisory Board.
Dr. Gerd Krick, Dr. Dieter Schenk, Rolf A. Classon and William P. Johnston as well as Dr. Ulf M. Schneider shall continue to be members of the Supervisory Board of Fresenius Medical Care Management AG. Stephan Sturm, Chief Financial Officer of Fresenius, shall be elected as a new member of the Supervisory Board. Dr. Walter L. Weisman will leave the Supervisory Board effective on May 12, 2016.
Fresenius Medical Care Management AG is the General Partner of Fresenius Medical Care AG & Co. KGaA, which acts on its own responsibility, manages the Company and conducts the Company's business. The Supervisory Board of Fresenius Medical Care Management AG appoints the members of the Management Board of Fresenius Medical Care Management AG.
The invitation and detailed agenda for the Annual General Meeting of Fresenius Medical Care AG & Co. KGaA on May 12, 2016, are expected to be published on March 31, 2016.
Disclaimer
This release contains forward-looking statements that are subject to various risks and uncertainties. Actual results could differ materially from those described in these forward-looking statements due to certain factors, including changes in business, economic and competitive conditions, regulatory reforms, foreign exchange rate fluctuations, uncertainties in litigation or investigative proceedings, and the availability of financing. These and other risks and uncertainties are detailed in Fresenius Medical Care AG & Co. KGaA's reports filed with the U.S. Securities and Exchange Commission. Fresenius Medical Care AG & Co. KGaA does not undertake any responsibility to update the forward-looking statements in this release.
At its meeting today, the Supervisory Board of Fresenius SE & Co. KGaA nominated the following candidates for election to the Supervisory Board by the Annual General Meeting on May 13, 2016:
- Prof. Dr. med. D. Michael Albrecht, Medical Director and Spokesman of the Management Board of the Universitätsklinikum Carl Gustav Carus Dresden; member of the Supervisory Board since 2011
- Michael Diekmann, former Chief Executive Officer of Allianz SE; member of the Supervisory Board since 2015
- Dr. Gerd Krick, former Chief Executive Officer of Fresenius AG; member of the Supervisory Board since 2003
- Prof. Dr. med. Iris Löw-Friedrich, Chief Medical Officer and Executive Vice President, Head of Development and Medical Patient Value Practices at UCB S.A.
- Klaus-Peter Müller, Chairman of the Supervisory Board of Commerzbank AG; member of the Supervisory Board since 2008
- Hauke Stars, Member of the Management Board of Deutsche Börse AG
If elected by the Annual General Meeting, Prof. Dr. med. Iris Löw-Friedrich und Ms. Hauke Stars will join the Supervisory Board as new shareholder representatives. Prof. Dr. Roland Berger, a member since 2008, and Gerhard Roggemann, a member from 1998 to 2004 and again since 2011, will leave the Supervisory Board at the close of the Annual General Meeting.
All candidates are nominated for a five-year term, ending with the close of the 2021 Annual General Meeting. If re-elected to the Supervisory Board, Dr. Gerd Krick will be proposed for election as Chairman.
The Supervisory Board of Fresenius SE & Co. KGaA consists of 12 members. The six employee representatives are elected by the European works council.
Dr. Gerd Krick, Michael Diekmann and Klaus-Peter Müller, as well as Dr. Dieter Schenk, a lawyer and tax consultant, and Dr. Karl Schneider, former Spokesman of the Management Board of Südzucker AG, are nominated for re-election to the Supervisory Board of Fresenius Management SE. Effective on May 13, 2016, Prof. Dr. Roland Berger will leave the Supervisory Board of Fresenius Management SE. Dr. Kurt Bock, Chief Executive Officer of BASF SE, is nominated to join the Supervisory Board of Fresenius Management SE.
As the general partner, Fresenius Management SE manages Fresenius SE & Co. KGaA. The Supervisory Board of Fresenius Management SE, which consists of six members and is not subject to employee co-determination, appoints the Management Board of Fresenius Management SE.
The invitation and complete agenda for the Annual General Meeting of Fresenius SE & Co. KGaA, to be held on May 13, 2016, will be published on March 31, 2016.
This release contains forward-looking statements that are subject to various risks and uncertainties. Future results could differ materially from those described in these forward-looking statements due to certain factors, e.g. changes in business, economic and competitive conditions, regulatory reforms, results of clinical trials, foreign exchange rate fluctuations, uncertainties in litigation or investigative proceedings, and the availability of financing. Fresenius does not undertake any responsibility to update the forward-looking statements in this release.
- Targets for 2015 achieved: revenue + 11% (constant currency), net income1,2 +2%
- 3% dividend increase to be proposed at the Annual General Meeting
- Excellent organic growth and positive operating earnings development in North America
- Strong organic growth dynamic in Care Coordination activities, still in investment mode
- International performance furthermore impacted by currency fluctuations
- Result pushed by Global Efficiency Program and lower costs for healthcare supplies
- 2016 outlook in line with projection: Net revenue +7-10% (constant currency), Net income +15-20%
Fourth quarter 2015 key figures:
Net revenue: $4,348 million, +1% / +5%cc
Operating income (EBIT): $662 million, 0%
Operating income (EBIT) excluding special items2: $704 million, +5%
Net income1: $317 million, -6%
Net income excluding special items1,2: $347 million, +2%
Basic earnings per share: $1.04, -6%
Full year 2015 key figures:
Net revenue: $16,738 million, +6% / +11%cc
Operating income (EBIT): $2,327 million, +3%
Operating income (EBIT) excluding special items2: $2,388 million, +5%
Net income1: $1,029 million, -2%
Net income excluding special items1,2: $1,082 million, +2%
Basic earnings per share: $3.38, -2%
Dividend proposal:
Per share €0.80 +3%
cc = at constant currency rates
1 excluding special items: divestiture of dialysis business in Venezuela, sale of the European marketing rights to Vifor and settlement costs for an agreement in principle for the GranuFlo® case in 2015 as well as closing of manufacturing plants in 2014
2 attributable to shareholders of Fresenius Medical Care AG & Co. KGaA
Rice Powell, Chief Executive Officer of Fresenius Medical Care stated: “Our commitment to our patients continues to produce substantial results. After investing heavily in new business activities, 2015 was a year that focused on operational excellence. Strong market dynamics in our core dialysis markets had been supported by new operating profitability levels. In 2016 we even want to accelerate the value creation for all our shareholders. We delivered on revenue, net income guidance for 2015 and confirm our targets for 2016: strong revenue growth combined with even higher net income growth.”
Fourth quarter 2015
Revenue
Net revenue for the fourth quarter of 2015 increased slightly by 1% to $4,348 million (+5% at constant currency) as compared to the fourth quarter of 2014. Organic revenue growth was 5%. Net Health Care revenue grew by 4% to $3,462 million (+7% at constant currency). The organic growth rate was 6%. After a very strong first half in the product business, the dialysis product revenue was down by 11% to $886 million. The company generated more than 70% of the product business in the three International segments which implied a strong currency headwind. On a constant currency basis, dialysis product revenue decreased by 2%.
North America revenue for the fourth quarter of 2015 increased by 7% to $3,084 million. Organic revenue growth was 5%. Net Health Care revenue contributed $2,845 million (+8% on a year on year basis), the product business $239 million (+1% on a year on year basis). The Care Coordination business recorded revenue of $501 million – corresponding to a significant growth of 27% over the previous years fourth quarter. Organic revenue growth was 23%.
International revenue decreased by 12% to $1,257 million (an increase of 2% on a constant currency basis), clearly negatively impacted by currency translation. Organic revenue growth was 3%. Net Health Care revenue was $617 million (-10%, +5% at constant currency). Dialysis product revenue decreased by 13% to $640 million (-1% at constant currency).
International segments:
Europe, Middle East and Africa (EMEA) revenue decreased by 12% to $673 million. Constant currency and organic revenue growth was 1%. Net Health Care revenue decreased by 11% to $306 million (+4% at constant currency). Dialysis product revenue decreased by 13% to $367 million (-1% at constant currency and stable on an organic perspective).
Asia-Pacific revenue decreased by 6% to $394 million (+1% at constant currency). Net Health Care revenue amounted to $171 million (+3% at constant currency), dialysis product revenue decreased to $223 million (stable level at constant currency rates).
Latin America revenue decreased by 20% to $ 190 million. At constant currency revenue grew by 3%. Organic revenue growth was 15%. Net Health Care revenue decreased by 14% to $140 million (+9% at constant currency). With a plus of 27% organic growth was very strong. Dialysis product revenue decreased by 33% to $50 million (a decrease of 9% at constant currency).
Earnings
Operating income (EBIT) was $662 million, stable compared to last year. The sale of remaining European marketing rights to a Joint Venture was recognized in the fourth quarter resulting in an additional gain of $18 million. The company also reached an agreement in principle to resolve a product liability litigation in the United States involving GranuFlo®/NaturaLyte®. This caused a pre-tax charge of $60 million. Excluding both special items operating income increased 5% from $669 million to $704 million.
Operating income for North America for the fourth quarter of 2015 was $514 million, an increase of 4% as compared to the corresponding quarter in 2014. Excluding the $60 million settlement costs for the GranuFlo®/NaturaLyte® case the operating income was $574 million, a strong increase of 16%.
International segments:
Operating income for EMEA for the fourth quarter of 2015 increased by 20% to $172 million as compared to the same quarter 2014. Operating income, excluding the $ 18 million gain resulting from the sale of the European marketing rights, was $154 million, reflecting an increase of 8%. Operating income for Asia-Pacific was $79 million, a sequential improvement of $11 million and a decrease of 21% on a year on year basis. Operating income for Latin America for the fourth quarter of 2015 was $23 million (Q4 2014: $35 million).
The corporate costs were up at $ 126 million compared to $108 million in Q4 2014.
Net interest expense for the reported quarter was with $88 million clearly below Q4 of last year (-25%) due to higher interest income resulting from the early repayment of interest-bearing notes receivables and due to a decreased average debt level.
Income tax expense was $180 million for Q4 2015, which translates into an effective tax rate of 31.4%. This compares to income tax expense of $143 million and a tax rate of 26.2%, which was influenced favorably by the resolution of challenged deductions for the civil payments taken in prior years.
Net income attributable to shareholders of Fresenius Medical Care AG & Co. KGaA for the fourth quarter of 2015 was $317 million compared to $335 million in the fourth quarter of 2014. Excluding special items net income attributable to shareholders of Fresenius Medical Care AG & Co. KGaA was $347 million – this means an increase by 2%. Net income attributable to noncontrolling interest increased to $77 million ($68 million in Q4 2014).
Basic earnings per share (EPS) for the fourth quarter of 2015 was $1.04, compared to $1.11 for the corresponding period in 2014. The weighted average number of shares outstanding for Q4 2015 was approximately 305.1 million shares, compared to approximately 303.3 million shares.
Cash flow
In the fourth quarter of 2015, the company generated $548 million, representing approximately 13% of revenue, in net cash provided by operating activities, compared to the corresponding figure of last year of $588 million.
A total of $299 million was spent for capital expenditures, net of disposals. Free cash flow was $249 million compared to $306 million in the comparable quarter of 2014.
A total of $151 million in cash was spent for acquisitions and investments. Divestitures driven by the early repayment of interest bearing notes receivables were $209 million. Free cash flow after investing activities was $307 million as compared to -$419 million in Q4 2014
Full year 2015
Revenue and earnings
Net revenue for full year 2015 increased by 6% to $16,738 million (+11% at constant currency) as compared to fiscal 2014. Organic revenue growth worldwide was 6%.
Operating income (EBIT) for the full year 2015 increased by 3% to $2,327 million. Excluding special items operating income grew by 5% and reached $2,388 million as compared to $2,271 million for fiscal 2014.
Net interest expense for fiscal 2015 was $391 million as compared to $411 million for the corresponding period in 2014.
Income tax expense for full year 2015 was $623 million, which translates into an effective tax rate of 32.1%. This compares to income tax expense of $584 million and a tax rate of 31.7% for 2014.
For full year 2015, net income attributable to shareholders of Fresenius Medical Care AG & Co. KGaA was $1,029 million compared to $ 1,045 million in 2014. Excluding special items net income attributable to shareholders of Fresenius Medical Care AG & Co. KGaA increased to $1,082 million, plus 2% compared with the comparable number of $1,058 million for fiscal 2014.
For fiscal year 2015, basic earnings per share (EPS) was down at $3.38 as compared to the corresponding number for full year 2014 ($3.46). The weighted average number of shares outstanding for 12 months of 2015 was approximately 304.4 million shares (full year 2014: 302.3 million).
Cash flow
In the reported period 2015, the company generated $1,960 million in net cash provided by operating activities, representing 11.7% of revenue, as compared to $1,861 million for the same period in 2014.
A total of $935 million was spent for capital expenditures, net of disposals. Free cash flow was $1,025 million as compared to $941 million in 2014, a strong increase of roughly 9% on a year on year basis.
A total of $66 million in cash was spent for acquisitions and investments, net of divestitures. Free cash flow after investing activities was $959 million as compared to ($829) million for the twelve months of 2014.
Employees
As of December 31, 2015, Fresenius Medical Care had 104,033 employees (full-time equivalents) worldwide, compared to 99,895 employees at the end of 2014. This increase of 4% was mainly attributable to our continued organic growth and acquisitions.
Balance sheet structure
The company´s total assets were slightly above last years level and amounted to $25,533 million (Dec. 31, 2014: $25,381 million). Current assets increased by 4% to $6,984 million (Dec. 31, 2014: $6,718 million). Goodwill and intangible assets as well as non-current assets remained stable with $13,863 million (Dec. 31, 2014: 13,951 million) and $4,686 million (Dec. 31, 2014: 4,712 million) respectively. Total equity increased by 5% to $10,496 million (Dec. 31, 2014: $10,028 million). The equity ratio was 41% as compared to 40% at the end of 2014. Total debt was $8,646 million (Dec. 31, 2014: $9,466 million).
Please refer to the attachments for a complete overview of the results for the fourth quarter and full year 2015.
Dividend
At the Annual General Meeting to be held on May 12, 2016, shareholders will be asked to approve a dividend of €0.80 per share, an increase of 3% compared to 2014 (€0.78). This would mean the 19th consecutive dividend increase, shareholders can expect.
Outlook 2016
Based on the projection Fresenius Medical Care provided for 2016, the company is guiding for revenue to grow 7-10% at constant currency excluding acquisitions in 2015 and 2016. Net income attributable to shareholders of Fresenius Medical Care AG & Co. KGaA is expected to increase by 15-20% in 2016 excluding acquisitions in 2015 and 2016, based on net income for 2015 of US$ 1,057 million (net income excluding settlement costs for an agreement in principle for the GranuFlo®/NaturaLyte® case of -$37 million and +$9 million acquisitions).
The company expects to spend capital expenditures of $1.0 - $1.1 billion and around $750 million on acquisitions. The debt/EBITDA ratio is expected to be below 3.0 by the end of 2016.
Conference call
Fresenius Medical Care will hold a press conference at its headquarters in Bad Homburg, Germany to discuss the results of the fourth quarter and full year 2015 on Wednesday, February 24, 2016, at 10 am CET. The company cordially invites journalists to view the live video webcast at the company's website www.freseniusmedicalcare.com in the section "Investors/Events & Presentations". A replay will be available shortly after the meeting.
Fresenius Medical Care is the world's largest provider of products and services for individuals with renal diseases of which about 2.8 million patients worldwide regularly undergo dialysis treatment. Through its network of 3,418 dialysis clinics, Fresenius Medical Care provides dialysis treatments for 294,381 patients around the globe. Fresenius Medical Care is also the leading provider of dialysis products such as dialysis machines or dialyzers. Along with the core business, the company focuses on expanding the range of additional medical services in the field of care coordination.
For more information about Fresenius Medical Care, visit the company’s website at www.freseniusmedicalcare.com.
Disclaimer
This release contains forward-looking statements that are subject to various risks and uncertainties. Actual results could differ materially from those described in these forward-looking statements due to certain factors, including changes in business, economic and competitive conditions, regulatory reforms, foreign exchange rate fluctuations, uncertainties in litigation or investigative proceedings, and the availability of financing. These and other risks and uncertainties are detailed in Fresenius Medical Care AG & Co. KGaA's reports filed with the U.S. Securities and Exchange Commission. Fresenius Medical Care AG & Co. KGaA does not undertake any responsibility to update the forward-looking statements in this release.
If no timeframe is specified, information refers to fiscal year 2015.
Fiscal year 2015:
- Sales: €27.6 billion (+19%, +9% in constant currency)
- EBIT1: €3,958 million (+25%, +13% in constant currency)
- Net income1,2: €1,423 million (+31%, +21% in constant currency)
- Dividend proposal: +25% to €0.55 per share
Q4/2015:
- Sales: €7.3 billion (+11%, +5% in constant currency)
- EBIT1: €1,109 million (+19%, +10% in constant currency)
- Net income1,2: €414 million (+30%, +24% in constant currency)
Group guidance 2016:
- Sales growth of 6% to 8% in constant currency
- Net income1,2 growth of 8% to 12% in constant currency
Targets 20193:
- Group sales: between €36 billion and €40 billion
- Group net income2: between €2.0 billion and €2.25 billion
Ulf Mark Schneider, CEO of Fresenius, said: "2015 was a remarkable year for Fresenius with double-digit sales and earnings growth. Patient focus and an uncompromising commitment to product and service quality are key to our success. Our growth story continues. We see significant opportunities around the globe for the company’s strong and balanced healthcare portfolio, and this confidence is reflected in our new 2019 Group targets."
1 2015 before special items but including GranuFlo®/NaturaLyte® settlement costs ( €54 million before tax; €10 million after tax)2 Net income attributable to shareholders of Fresenius SE & Co. KGaA3 At comparable exchange rates; includes small and mid-size acquisitions
Positive Group guidance for 2016
For 2016, Fresenius projects sales growth of 6% to 8% in constant currency. Net income1 is expected to grow by 8% to 12% in constant currency.
The net debt/EBITDA2 ratio is expected to be approximately 2.5 at the end of 2016.
New stretch targets for 20193
For 2019, Group sales are expected to reach €36 billion to €40 billion. Group net income4 is expected to increase to €2.0 billion to €2.25 billion.
1 Net income attributable to shareholders of Fresenius SE & Co. KGaA; 2015 before special items but including GranuFlo®/NaturaLyte® settlement costs2 Calculated at expected annual average exchange rates, for both net debt and EBITDA; without large unannounced acquisitions3 At comparable exchange rates; including small and mid-size acquisitions4 Net income attributable to shareholders of Fresenius SE & Co. KGaA
23rd consecutive dividend increase proposed
Based on the strong financial results, the Management Board will propose to the Supervisory Board a dividend increase of 25% to €0.55 per share (2014: €0.44). The total dividend distribution is expected to be €300 million.
9% sales growth in constant currency – fully in line with guidance
Group sales increased by 19% (9% in constant currency) to €27,626 million (2014: €23,231 million). Organic sales growth was 6%. Acquisitions contributed 4% and divestitures reduced sales by 1%. Positive currency translation effects (10%) were mainly driven by the Euro’s depreciation against the U.S. dollar. In Q4/2015, Group sales increased by 11% (5% in constant currency) to €7,257 million (Q4/2014: €6,520 million). Organic sales growth was 5%. Acquisitions contributed 1%, while divestitures reduced sales by 1%.
Group sales by region:

21% net income1,2 growth in constant currency – fully in line with guidance
Group EBITDA2 increased by 24% (12% in constant currency) to €5,073 million (2014: €4,095 million). Group EBIT2 increased by 25% (13% in constant currency) to €3,958 million (2014: €3,158 million). The EBIT margin2 increased to 14.3% (2014: 13.6%).
In Q4/2015, Group EBIT2 increased by 19% (10% in constant currency) to €1,109 million (Q4/2014: €935 million), the EBIT margin2 improved to 15.3% (Q4/2014: 14.3%).
Group net interest increased slightly to -€613 million (2014: -€602 million). More favourable financing terms and interest rate savings on lower debt were more than offset by currency translation effects. In Q4/2015, Group net interest of -€137 million was below the prior-year level (Q4/2014: -€171 million). Lower negative currency translation effects in Q4/2015 were more than offset by interest savings on lower debt.
The Group tax rate2 increased to 29.4% (2014: 28.4%), mainly due to the higher U.S. share of earnings before tax.
Noncontrolling interest was €939 million (2014: €745 million), of which 95% was attributable to the noncontrolling interest in Fresenius Medical Care.
Group net income1,2 increased by 31% (21% in constant currency) to €1,423 million (2014: €1,086 million). Earnings per share1,2 increased by 30% (20% in constant currency) to €2.61 (2014: €2.01). In Q4/2015, Group net income1,2 increased by 30% (24% in constant currency) to €414 million (Q4/2014: €318 million). Earnings per share1,2 increased by 27% (22% in constant currency) to €0.75 (Q4/2014: €0.59).
Group net income1 including special items increased by 27% (17% in constant currency) to €1,358 million (2014: €1,067 million). Earnings per share1 including special items increased by 27% (16% in constant currency) to €2.50 (2014: € 1.97). In Q4/2015, Group net income1 including special items increased by 40% (32% in constant currency) to €359 million (Q4/2014: €257 million). Earnings per share1 including special items increased by 40% (32% in constant currency) to €0.66 (Q4/2014: €0.47).
1 Net income attributable to shareholders of Fresenius SE & Co. KGaA2 Before special items but including GranuFlo®/NaturaLyte® settlement costs ( €54 million before tax; €10 million after tax)
Continued investment in growth
Spending on property, plant and equipment was €1,512 million (2014: €1,345 million), primarily for the modernization and expansion of dialysis clinics, production facilities and hospitals. This corresponds to 5.5% of sales.
Total acquisition spending was €517 million (2014: €2,450 million).
Excellent cash flow development
Operating cash flow increased by 29% to €3,327 million (2014: €2,585 million) with a margin of 12.0% (2014: 11.1%). The Euro’s depreciation against the U.S. dollar positively influenced 2015 operating cash flow, while 2014 operating cash flow was reduced by the US$1151 million payment for the W.R. Grace bankruptcy settlement. The excellent cash flow margin demonstrates the underlying strength of cash flow generation across all business segments. Operating cash flow in Q4/2015 increased by 32% to €1,176 million (Q4/2014: €890 million) with a margin of 16.2% (Q4/2014: 13.7%).
Free cash flow before acquisitions and dividends increased by 48% to €1,865 million (2014: €1,262 million), with a margin of 6.8% (2014: 5.4%). Free cash flow after acquisitions and dividends improved to €1,194 million (2014: €1,348 million).
1 See Annual Report 2014, page 152 f.
Solid balance sheet structure1
The Group’s total assets increased by 9% (3% in constant currency) to €43,170 million (Dec. 31, 2014: €39,788 million). This increase is mainly attributable to currency translation effects. Current assets grew by 9% (6% in constant currency) to €10,917 million (Dec. 31, 2014: €10,012 million). Non-current assets increased by 8% (2% in constant currency) to €32,253 million (Dec. 31, 2014: € 29,776 million).
Total shareholders’ equity increased by 16% (11% in constant currency) to €18,003 million (Dec. 31, 2014: €15,483 million). The equity ratio increased to 41.7% (Dec. 31, 2014: 38.9%).
Group debt decreased by 4% (-9% in constant currency) to €14,769 million (Dec. 31, 2014: € 15,345 million). As of December 31, 2015, the net debt/EBITDA ratio was 2.682. As of December 31, 2014, the ratio was 3.243. EBITDA growth as well as the net debt reduction by application of meaningful free cash flow have equally contributed to this substantial decrease of the ratio.
1 2014 adjusted due to debt issuance cost restatement (U.S. GAAP standard ASU 2015-03)2 Before special items; at LTM average exchange rates for both net debt and EBITDA3 Pro forma acquisitions; before special items; at LTM average exchange rates for both net debt and EBITDA
Business Segments
Fresenius Medical Care
Fresenius Medical Care is the world's largest provider of products and services for individuals with renal diseases. As of December 31, 2015, Fresenius Medical Care was treating 294,381 patients in 3,418 dialysis clinics. Along with its core business, the company seeks to expand the range of medical services in the field of care coordination.

- 6% sales growth, 2% net income growth2 before GranuFlo®/NaturaLyte® settlement costs – fully in line with 2015 outlook
- Adverse currency developments weigh on business outside North America
- 2016 outlook confirmed: 7% to 10% sales growth in constant currency and 15 to 20% net income growth3 expected
Sales increased by 6% (11% in constant currency) to US$16,738 million (2014: US$15,832 million). Organic sales growth was 6%. Acquisitions contributed 6%, while divestitures reduced sales by 1%. Currency translation effects reduced sales by 5%. In Q4/2015, sales increased by 1% (5% in constant currency) to US$4,348 million (Q4/2014: US$4,320 million).
Health Care services sales (dialysis services and care coordination) increased by 9% (13% in constant currency) to US$13,392 million (2014: US$12,250 million). Dialysis product sales decreased by 7% (increased by 4% in constant currency) to US$3,346 million (2014: US$3,582 million).
In North America, sales increased by 13% to US$11,813 million (2014: US$10,500 million). Health Care services sales grew by 13% to US$10,932 million (2014: US$9,655 million). Dialysis product sales increased by 4% to US$881 million (2014: US$845 million).
Sales outside North America decreased by 7% (increased by 9% in constant currency) to US$4,897 million (2014: US$5,265 million). Health Care services sales decreased by 5% (increased by 12% in constant currency) to US$2,459 million (2014: US$2,595 million).
Dialysis product sales decreased by 9% (increased by 6% in constant currency) to US$2,437 million (2014: US$2,670 million).
EBIT increased by 3% (8% in constant currency) to US$2,327 million (2014: US$2,255 million). The EBIT margin was 13.9% (2014: 14.2%). Based on the agreement in principle to resolve the GranuFlo®/NaturaLyte® product liability litigation, Fresenius Medical Care expects a pre-tax financial impact of US$60 million from the settlement. Adjusted for one-time items4, EBIT increased by 5% to US$2,388 million. In Q4/2015, EBIT remained roughly flat at US$662 million (Q4/2014: US$663 million). In constant currency, EBIT increased by 3%. The EBIT margin was 15.2% (Q4/2014: 15.4%). EBIT excluding one-time items5 increased by 5% to US$704 million.
Net income attributable to shareholders of Fresenius Medical Care AG & Co. KGaA excluding one-time items4 increased by 2% to US$1,082 million. Net income including one-time items decreased by 2% (increased by 3% in constant currency) to US$1,029 million (2014: US$1,045 million). Net income attributable to non-controlling interest increased by 32% to US$284 million, mainly due to the strong earnings development in North America. In Q4/2015, net income excluding one-time items5 increased by 2% to US$347 million. Net income including one-time items decreased by 6% (-3% in constant currency) to US$317 million (Q4/2014: US$335 million).
Operating cash flow increased by 5% to US$1,960 million (2014: US$1,861 million). Operating cash flow in the prior-year period was reduced by the US$115 million6 payment for the W.R. Grace bankruptcy settlement. The cash flow margin was 11.7% (2014: 11.8%). In Q4/2015, operating cash flow reached an excellent US$548 million (Q4/2014: US$588 million) at a margin of 12.6% (Q4/2014: 13.6%).
Fresenius Medical Care confirms its outlook for 2016. The company expects sales to grow by 7% to 10% in constant currency and net income attributable to shareholders of Fresenius Medical Care AG & Co. KGaA is expected to increase by 15% to 20%3 in 2016.
The outlook is based on current exchange rates. Savings from the global efficiency program are included, while earnings contributions from acquisitions 2015/2016 are not.
For further information, please see Fresenius Medical Care’s Press Release at
www.freseniusmedicalcare.com.
1 Net income attributable to shareholders of Fresenius Medical Care AG & Co. KGaA2 2015 before GranuFlo®/NaturaLyte® settlement costs (-US$37 million after tax), before divestiture of dialysis business in Venezuela (-US$27 million after tax) and European pharmaceutical business (US$11 million after tax); 2014 before closing of manufacturing plant (-US$13 million after tax)3 2015 before GranuFlo®/NaturaLyte® settlement costs (-US$37 million after tax) and before acquisitions (US$9 million after tax); hence the basis for expected net income growth are US$1,057 million.4 2015 before GranuFlo®/NaturaLyte® settlement costs (-US$60 million before tax; -US$37 million after tax), before divestiture of dialysis business in Venezuela (-US$26 million before tax; -US$27 million after tax) and European pharmaceutical business (US$25 million before tax; US$11 million after tax); 2014 before closing of manufacturing plant (-US$16 million before tax; -US$13 million after tax)5 Q4/2015 before GranuFlo®/NaturaLyte® settlement costs (-US$60 million before tax; -US$37 million after tax), before divestiture of European pharmaceutical business (US$18 million before tax; US$7 million after tax); 2014 before closing of manufacturing plant (-US$6 million before tax; -US$6 million after tax)6 See Annual Report 2014, page 152 f.
Fresenius Kabi
Fresenius Kabi offers intravenously administered generic drugs, clinical nutrition and infusion therapies for seriously and chronically ill patients in the hospital and outpatient environments. The company is also a leading supplier of medical devices and transfusion technology products.

- 8% organic sales growth, 21% EBIT1 growth in constant currency – fully in line with 2015 outlook
- Strong operating cash flow margin of 15.3% in 2015
- 2016 outlook: low single-digit organic sales growth and roughly flat EBIT in constant currency expected
Sales increased by 16% (7% in constant currency) to €5,950 million (2014: €5,146 million). Organic sales growth was 8%. Acquisitions contributed 1% while divestitures reduced sales by 2%. Positive currency translation effects (9%) were mainly driven by the Euro’s depreciation against the U.S. dollar and the Chinese yuan. In Q4/2015, sales increased by 10% (5% in constant currency) to €1,519 million (Q4/2014: €1,386 million). Organic sales growth was 8%.
Sales in Europe grew by 1% (organic growth: 4%) to €2,123 million (2014: €2,102 million). Sales in North America increased by 37% (organic growth: 16%) to €2,093 million (2014: €1,531 million). North American sales growth was driven by persisting IV drug shortages and new product launches. Asia-Pacific sales increased by 16% (organic growth: 5%) to €1,141 million (2014: €987 million). Sales in Latin America/Africa grew by 13% (organic growth: 13%) to €593 million (2014: €526 million).
EBIT1 increased by 36% (21% in constant currency) to €1,189 million (2014: €873 million). The EBIT margin1 improved to 20.0% (2014: 17.0%). In Q4/2015, EBIT1 increased by 33% (26% in constant currency) to €317 million (Q4/2014: €239 million). The EBIT margin1 increased to 20.9% (Q4/2014: 17.2%). The EBIT margin was positively influenced by the Euro’s depreciation against the U.S. dollar.
Net income2 increased by 43% (27% in constant currency) to €669 million (2014: €468 million). In Q4/2015, net income2 increased by 45% (38% in constant currency) to €190 million (Q4/2014: €131 million).
Operating cash flow increased by 42% to €913 million (2014: €641 million) with a margin of 15.3% (2014: 12.5%). In Q4/2015, operating cash flow increased by 55% to €324 million (Q4/2014: €209 million) with a margin of 21.3% (Q4/2014: 15.1%).
Fresenius Kabi’s initiatives to increase production efficiency and streamline administrative structures are well on track. Costs of €105 million before tax were incurred in 2015. These costs are reported in the Group segment Corporate/Other. The program led to initial cost savings of approximately €10 million in 2015. The targeted savings run-rate of approximately €40 million p.a. is expected by 2018.
For 2016, Fresenius Kabi expects to achieve low single-digit organic sales growth. EBIT3 in constant currency is expected to be roughly flat.
1 Before special items2 Net income attributable to shareholders of Fresenius Kabi AG; before special items3 2015 before special items
Fresenius Helios
Fresenius Helios is Germany’s largest hospital operator. HELIOS operates 111 hospitals, thereof 87 acute care clinics (including seven maximum care hospitals in Berlin-Buch, Duisburg, Erfurt, Krefeld, Schwerin, Wiesbaden and Wuppertal) and 24 post-acute care clinics. HELIOS treats more than 4.7 million patients per year, thereof approximately 1.3 million inpatients, and operates more than 34,000 beds.

- 3% organic sales growth, €640 million EBIT1 – fully in line with 2015 outlook
- 100 bps EBIT margin1 increase to 11.5% in 2015
- 2016 outlook: 3% to 5% organic sales growth and EBIT of €670 to €700 million expected
Sales increased by 6% to €5,578 million (2014: €5,244 million). Organic sales growth was 3%. Acquisitions contributed 4%, while divestitures reduced sales by 1%. In Q4/2015, sales increased by 4% to €1,411 million (Q4/2014: €1,361 million), organic sales growth was 4%.
EBIT1 grew by 16% to €640 million (2014: €553 million). The EBIT margin1 increased to 11.5% (2014: 10.5%). The increase is attributable both to the successful integration of the acquired hospitals from Rhön-Klinikum AG and to continuous improvements of the established business. In Q4/2015, EBIT1 increased by 8% to €168 million (Q4/2014: €156 million) with a margin1 of 11.9% (Q4/2014: 11.5%).
Net income2 increased by 21% to €483 million (2014: €400 million). In Q4/2015, net income2 increased by 15% to €131 million (Q4/2014: €114 million).
Sales of the established hospitals grew by 3% to €5,379 million (2014: €5,222 million). EBIT1 increased by 15% to €631 million (2014: €551 million). The EBIT margin1 increased to 11.7% (2014: 10.6%). Sales of the newly acquired hospitals (consolidation ≤1 year) were €199 million. EBIT1 was €9 million with a margin of 4.5%.
The integration of the hospitals acquired from Rhön-Klinikum AG remains well on track. Integration costs in 2015 were €12 million (Q4/2015: €0 million) taking the total to date to €63 million. Fresenius Helios does not expect any further integration costs. Amount (€85 million p.a.) and timing (spring 2016) of targeted near-term cost synergies are confirmed.
For 2016, Fresenius Helios projects organic sales growth of 3% to 5%. EBIT is expected to increase to €670 to €700 million.
1 Before special items2 Net income attributable to shareholders of HELIOS Kliniken GmbH; before special items
Fresenius Vamed
Fresenius Vamed manages projects and provides services for hospitals and other health care facilities worldwide. The portfolio ranges along the entire value chain: from project development, planning, and turnkey construction, via maintenance and technical management, to total operational management.

- 6% organic sales growth, 8% EBIT growth – fully in line with 2015 outlook
- Order intake of €904 million at all-time high
- 2016 Outlook: 5% to 10% organic sales growth and 5% to 10% EBIT growth expected
Sales increased by 7% (6% in constant currency) to €1,118 million (2014: €1,042 million). Organic sales growth was 6%. Sales in the project business increased by 3% to €575 million (2014: €558 million). Sales in the service business grew by 12% to €543 million (2014: €484 million). In Q4/2015, sales remained unchanged at €387 million compared to the prior-year. Organic sales growth was 1%.
EBIT grew by 8% to €64 million (2014: €59 million). The EBIT margin remained unchanged at 5.7%. In Q4/2015, EBIT increased by 6% to €34 million (Q4/2014: €32 million). The EBIT margin increased by 50 bps to 8.8%.
Net income1 grew by 7% to €44 million (2014: €41 million). In Q4/2015, net income1 increased by 4% to €24 million (Q4/2014: €23 million).
Order intake increased to €904 million (2014: €840 million), reaching an all-time high. As of December 31, 2015, order backlog was €1,650 million (Dec. 31, 2014: €1,398 million).
For 2016, Fresenius Vamed expects organic sales growth in the range of 5% to 10% and EBIT growth of 5% to 10%.
1 Net income attributable to shareholders of VAMED AG
Press Conference
As part of the publication of the results for fiscal year 2015, a press conference will be held on February 24, 2016 at 10 a.m. CET. You are cordially invited to follow the press conference in a live broadcast over the Internet at www.fresenius.com/media. Following the press conference, a replay will be available on our website.
This release contains forward-looking statements that are subject to various risks and uncertainties. Future results could differ materially from those described in these forward-looking statements due to certain factors, e.g. changes in business, economic and competitive conditions, regulatory reforms, results of clinical trials, foreign exchange rate fluctuations, uncertainties in litigation or investigative proceedings, and the availability of financing. Fresenius does not undertake any responsibility to update the forward-looking statements in this release.
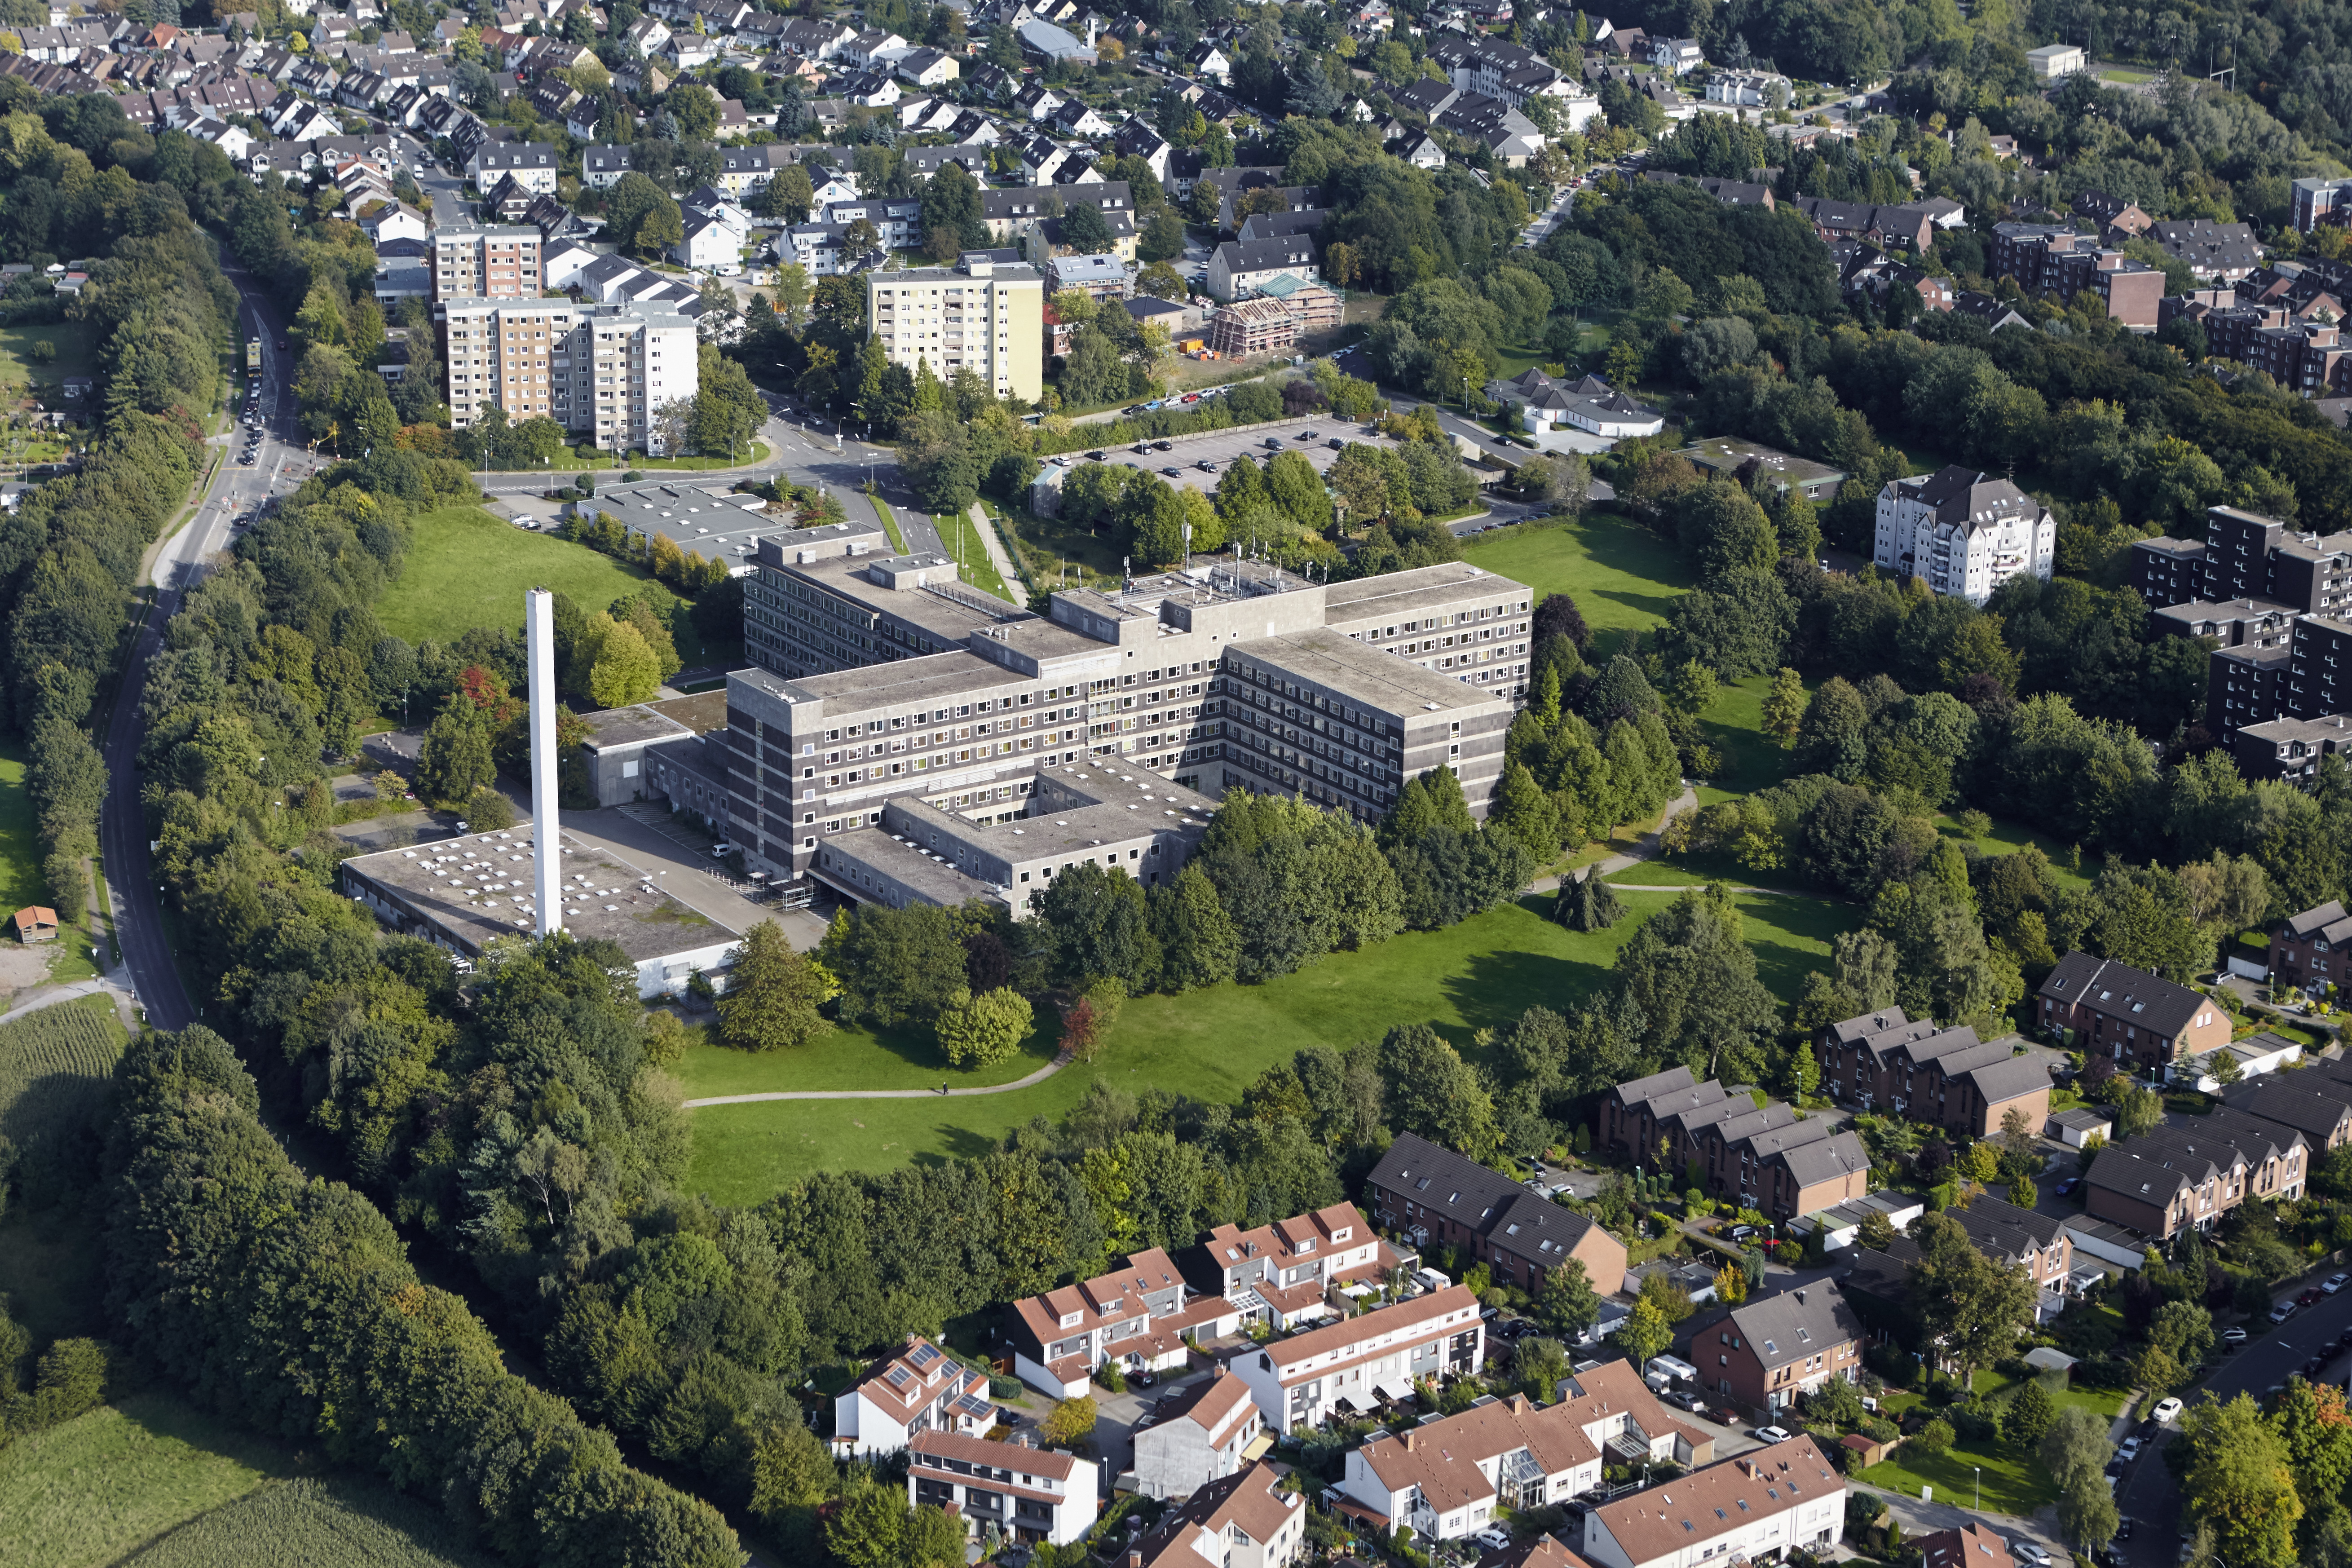
Fresenius Helios acquires the municipal hospital in Velbert located in the German state of North Rhine-Westphalia. The hospital has 519 beds and, with approximately 1,000 employees, treats 45,000 patients each year, including 20,000 inpatients. Sales were approximately €67 million in 2014.
Fresenius Helios will fully own the hospital. Following the acquisition, it plans to invest in a new, state-of-the-art hospital building. The facility is an excellent fit with the company’s existing presence and activities in North Rhine-Westphalia.
The acquisition is subject to approval by the German antitrust authorities. The parties agreed not to disclose the purchase price. The transaction is expected to close in the second quarter of 2016, and the hospital will already be accretive to Fresenius Group earnings starting this year.
This release contains forward-looking statements that are subject to various risks and uncertainties. Future results could differ materially from those described in these forward-looking statements due to certain factors, e.g. changes in business, economic and competitive conditions, regulatory reforms, results of clinical trials, foreign exchange rate fluctuations, uncertainties in litigation or investigative proceedings, and the availability of financing. Fresenius does not undertake any responsibility to update the forward-looking statements in this release.
Fresenius Medical Care AG & Co. KGaA (“the company” or “Fresenius Medical Care”), the world’s largest provider of dialysis products and services, today announced that Fresenius Medical Care North America (FMCNA) has reached an agreement in principle with a committee designated by the plaintiffs to resolve litigation in the United States involving GranuFlo®/NaturaLyte®.
Under the agreement in principle, the settlement amount would be $250 million, provided that 97% of all plaintiffs agree to the settlement by July 2016 with the funding provided in August 2016. Insurers will fund the settlement amount with $220 million.
Therefore, the company expects a pre-tax charge of $60 million from the settlement and other costs to finalize this matter. This impact for the company will be reflected in its 2015 numbers to be published on February 24, 2016.
For 2015 the company expects to report revenues of approximately $16.7 billion. Excluding the charge net of tax, the 2015 net income attributable to shareholders should increase by approximately 2% over the prior year period. On that basis the company expects to be in line with its financial guidance for 2015.
The company’s GranuFlo®/NaturaLyte® product at issue in the litigation remains on the market and continues to be the market leader for dialysis acid concentrates in the United States. There has been no change in the composition of the product and it remains safe and effective when used and prescribed as directed.
Fresenius Medical Care is the world's largest provider of products and services for individuals with renal diseases of which more than 2.6 million patients worldwide regularly undergo dialysis treatment. Through its network of 3,402 dialysis clinics, Fresenius Medical Care provides dialysis treatments for 290,250 patients around the globe. Fresenius Medical Care is also the leading provider of dialysis products such as dialysis machines or dialyzers. Along with the core business, the company focuses on expanding the range of additional medical services in the field of care coordination.
For more information visit the Company’s website at www.freseniusmedicalcare.com.
Disclaimer
This release contains forward-looking statements that are subject to various risks and uncertainties. Actual results could differ materially from those described in these forward-looking statements due to certain factors, including changes in business, economic and competitive conditions, regulatory reforms, foreign exchange rate fluctuations, uncertainties in litigation or investigative proceedings, and the availability of financing. These and other risks and uncertainties are detailed in Fresenius Medical Care AG & Co. KGaA's reports filed with the U.S. Securities and Exchange Commission. Fresenius Medical Care AG & Co. KGaA does not undertake any responsibility to update the forward-looking statements in this release.
Fresenius Medical Care AG & Co. KGaA (“the company” or “Fresenius Medical Care”), the world’s largest provider of dialysis products and services, today announced a change in the Management Board.
After being with the company for more than 20 years Roberto Fusté (64), the Management Board member responsible for the region Asia-Pacific, has decided to resign from his operational responsibilities and Management Board position effective March 31, 2016. The company will continue to benefit from Mr. Fuste’s experience as he will continue to support the CEO Rice Powell as an Executive Advisor for regional strategy up until 2018. Effective April 1, 2016 Mr. Harry de Wit (53) will succeed Mr. Fusté as the CEO and Management Board member for the region and he will also be located in Hong Kong.
Mr. Fusté began his career with the Fresenius dialysis business segment in April 1995 and after several very successful years with increasing responsibilities in the areas of sales and marketing in the European dialysis business, he was appointed to the Management Board of Fresenius Medical Care in January 1999. Under the leadership of Mr. Fusté the Asia-Pacific region has grown from annual revenue of around 130 million US-Dollars in 1999 to over 1.4 billion US-Dollars in annualized revenue today. “It has been an honor serving at the Company’s Management Board during all these years. Every moment has been extremely rewarding and I want to thank our team in Asia for delivering such an outstanding growth and leadership position over time by focusing on our patients, quality and personal commitment” said Mr. Fusté.
Mr. de Wit has worked in various areas in the medical device industry for over 25 years. Since 2010 Mr. de Wit served as President Asia at Covidien (now Medtronic) in Singapore. Harry chose to leave Covidien after the acquisition by Medtronic. Mr. de Wit holds a Master’s degree in Medicine from the VU University of Amsterdam, the Netherlands and a Bachelor’s of Science in Physiotherapy from the School of Physiotherapy of Den Bosch, Netherlands. “I am pleased to join Fresenius Medical Care, the world's leading provider of dialysis products and services in such a dynamic region and I am looking forward to work with the existing management team and help to execute on the strategy which creates incredible opportunities” said Mr. de Wit.
"We are delighted to have Harry join our company, as he has a proven track record of successful management in varying geographies and functions. Harry has the ability to drive innovation and deliver growth, with a focus on developing talent. Harry is well prepared to further strengthen our position in the Asia-Pacific region and add to the legacy and foundation built by Roberto Fusté, whom I would like to sincerely thank for his dedication and leadership" Rice Powell, CEO Fresenius Medical Care commented.
Ulf Mark Schneider, Chairman of the Supervisory Board of Fresenius Medical Care Management AG, commented: "Roberto Fusté has made significant contributions to Fresenius Medical Care in successfully building the company`s Asia-Pacific region over a period of 18 years. Today, this region is one of the key growth drivers. On behalf of the Supervisory Board, I would like to thank Roberto for his dedication, perseverance and outstanding results. At the same time, I would like to welcome Harry de Wit to his new role at Fresenius Medical Care. I am convinced that the Asia-Pacific region will continue to thrive under his leadership".
Fresenius Medical Care is the world's largest provider of products and services for individuals with renal diseases of which more than 2.6 million patients worldwide regularly undergo dialysis treatment. Through its network of 3,402 dialysis clinics, Fresenius Medical Care provides dialysis treatments for 290,250 patients around the globe. Fresenius Medical Care is also the leading provider of dialysis products such as dialysis machines or dialyzers. Along with the core business, the company focuses on expanding the range of additional medical services in the field of care coordination.
For more information visit the Company’s website at www.freseniusmedicalcare.com.
Disclaimer
This release contains forward-looking statements that are subject to various risks and uncertainties. Actual results could differ materially from those described in these forward-looking statements due to certain factors, including changes in business, economic and competitive conditions, regulatory reforms, foreign exchange rate fluctuations, uncertainties in litigation or investigative proceedings, and the availability of financing. These and other risks and uncertainties are detailed in Fresenius Medical Care AG & Co. KGaA's reports filed with the U.S. Securities and Exchange Commission. Fresenius Medical Care AG & Co. KGaA does not undertake any responsibility to update the forward-looking statements in this release.
Fresenius Helios is celebrating the 40th anniversary of the HELIOS ENDO Hospital in Hamburg. This specialist center for bone, joint and spinal surgery treats some 7,000 patients annually. More than 140,000 joint implant and replacement procedures have been carried out at the hospital since its opening in 1976. Over €100 million has been invested in the hospital's modernization in recent years, and a new outpatient surgical department is scheduled to open in mid-2016.
Fresenius Kabi and Becton, Dickinson and Company (BD) announced today that Fresenius Kabi has acquired the BD Rx business, which includes a pharmaceutical manufacturing plant in Wilson, N.C., and the BD line of seven drugs in ready-to-administer prefilled glass syringes. Fresenius Kabi and BD have also signed a 10-year supply and distribution agreement under which Fresenius Kabi will supply BD with a portfolio of intravenous (IV) solutions.
Prefilled injectable medicines are designed to help improve patient care and safety by decreasing the number of steps in the traditional vial and syringe injection sequence, reducing the potential risk of medication error.
“Ready-to-administer, prefilled syringes are a growing segment in health care due to increased focus on medication safety and labor-saving efficiency,” said John Ducker, President and CEO of Fresenius Kabi USA. “They are a natural complement to our portfolio, enabling us to offer customers more choices and a broader range of specialty injectable medicines in vials as well as ready-to-administer presentations.”
The North Carolina plant, which employs about 100 people, features advanced pharmaceutical manufacturing and packaging technologies, and was approved by the FDA in 2012. It currently produces seven drugs in ready-to-administer prefilled syringes and has capacity for future growth. Fresenius Kabi expects to invest in the facility over time, making it its global center of excellence for prefilled syringe production. The two companies will work together to assure a smooth transition for employees and customers.
“We believe Fresenius Kabi is a better owner for the BD Rx business, because it complements their existing capabilities in the injectable pharmaceutical industry,” said Tom Polen, President of BD’s Medical Segment. “In addition, we look forward to working with Fresenius Kabi to extend our medication management strategy through the addition of a portfolio of IV fluids, which will broaden our clinical and economical end-to-end solutions for our customers and their patients.”
Fresenius Kabi plans to register more IV drugs for the prefilled syringe format. As a consequence of these investments, the transaction is not expected to be accretive to earnings in the short-term.
Financial and contractual terms of the transactions were not disclosed.
This release contains forward-looking statements that are subject to various risks and uncertainties. Future results could differ materially from those described in these forward-looking statements due to certain factors, e.g. changes in business, economic and competitive conditions, regulatory reforms, results of clinical trials, foreign exchange rate fluctuations, uncertainties in litigation or investigative proceedings, and the availability of financing. Fresenius does not undertake any responsibility to update the forward-looking statements in this release.