
Fresenius was presented yesterday with the Corporate Finance Award for the company's acquisition of Quirónsalud, Spain’s largest private hospital operator. The award is given annually by the major German business daily Börsen-Zeitung for transactions judged to be outstanding in both strategical and financial terms. Fresenius won in the Large Caps category, which groups major companies. With the Quirónsalud acquisition, the Börsen-Zeitung said, “Fresenius succeeded in making a quantum leap in the hospital business."
-
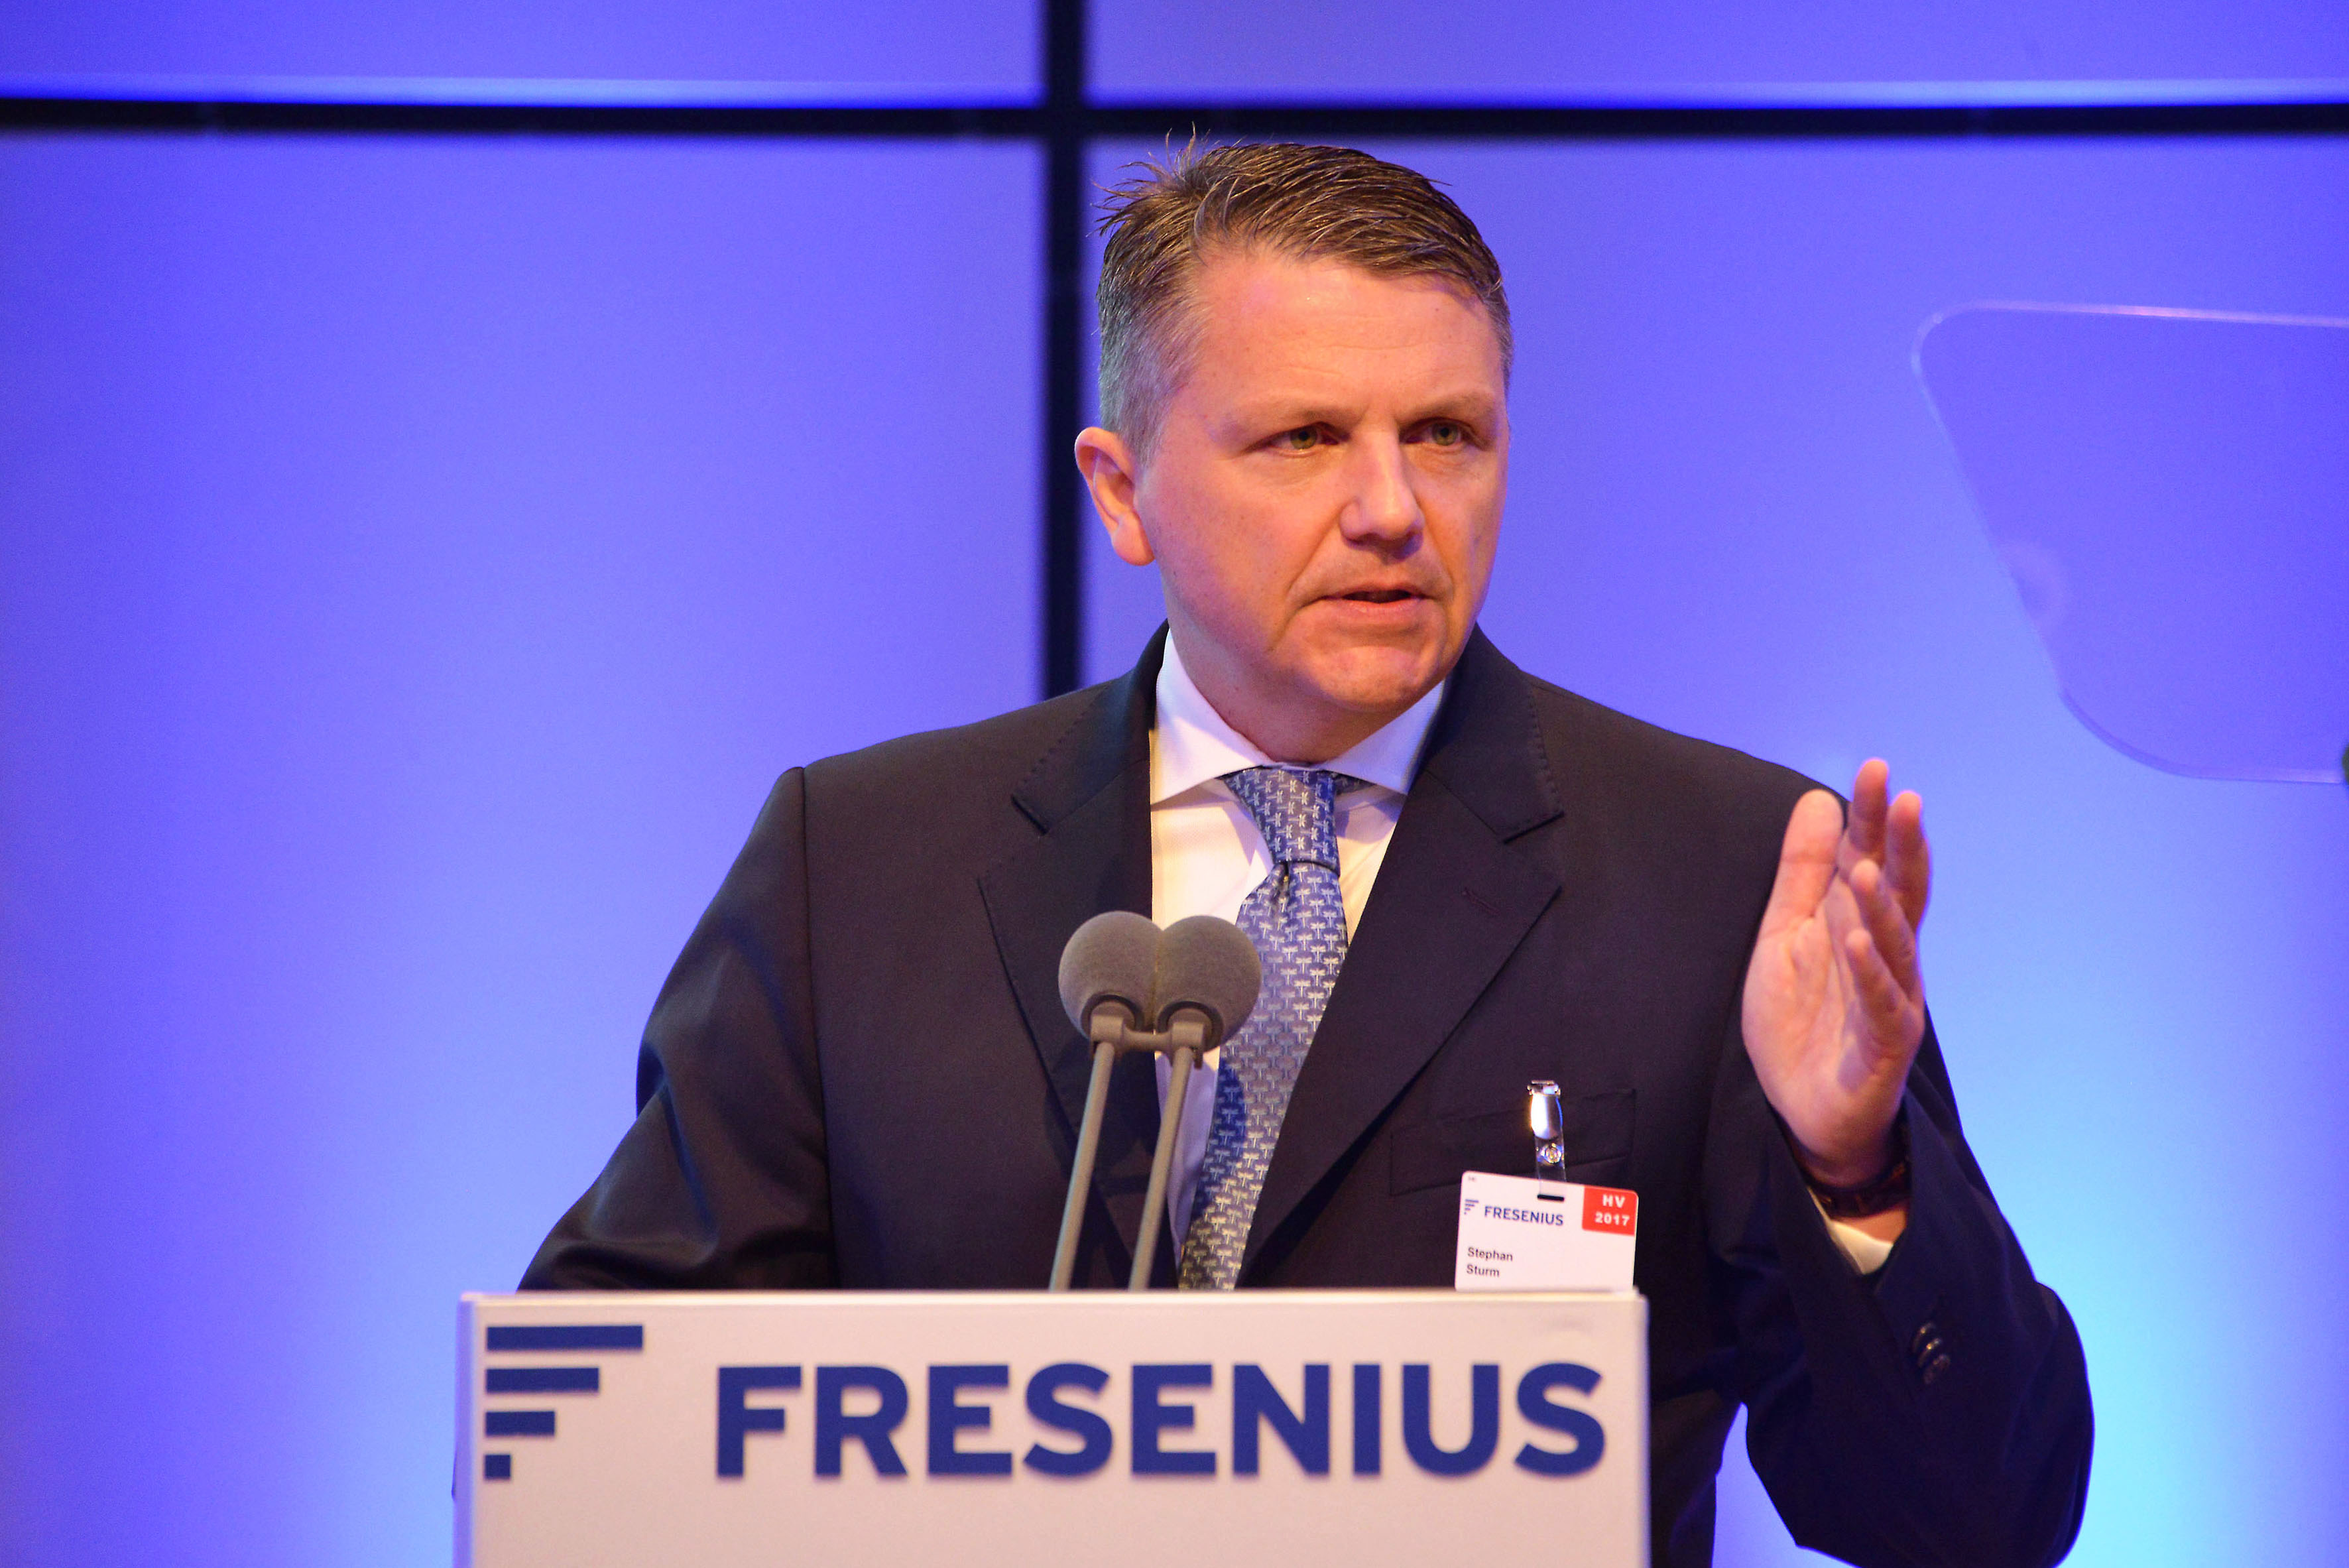
Stephan Sturm, CEO of Fresenius: "Growth is good and important: It strengthens our company. Size is good and important: It makes us better." Download Image (JPG 803 KB) -
![]()
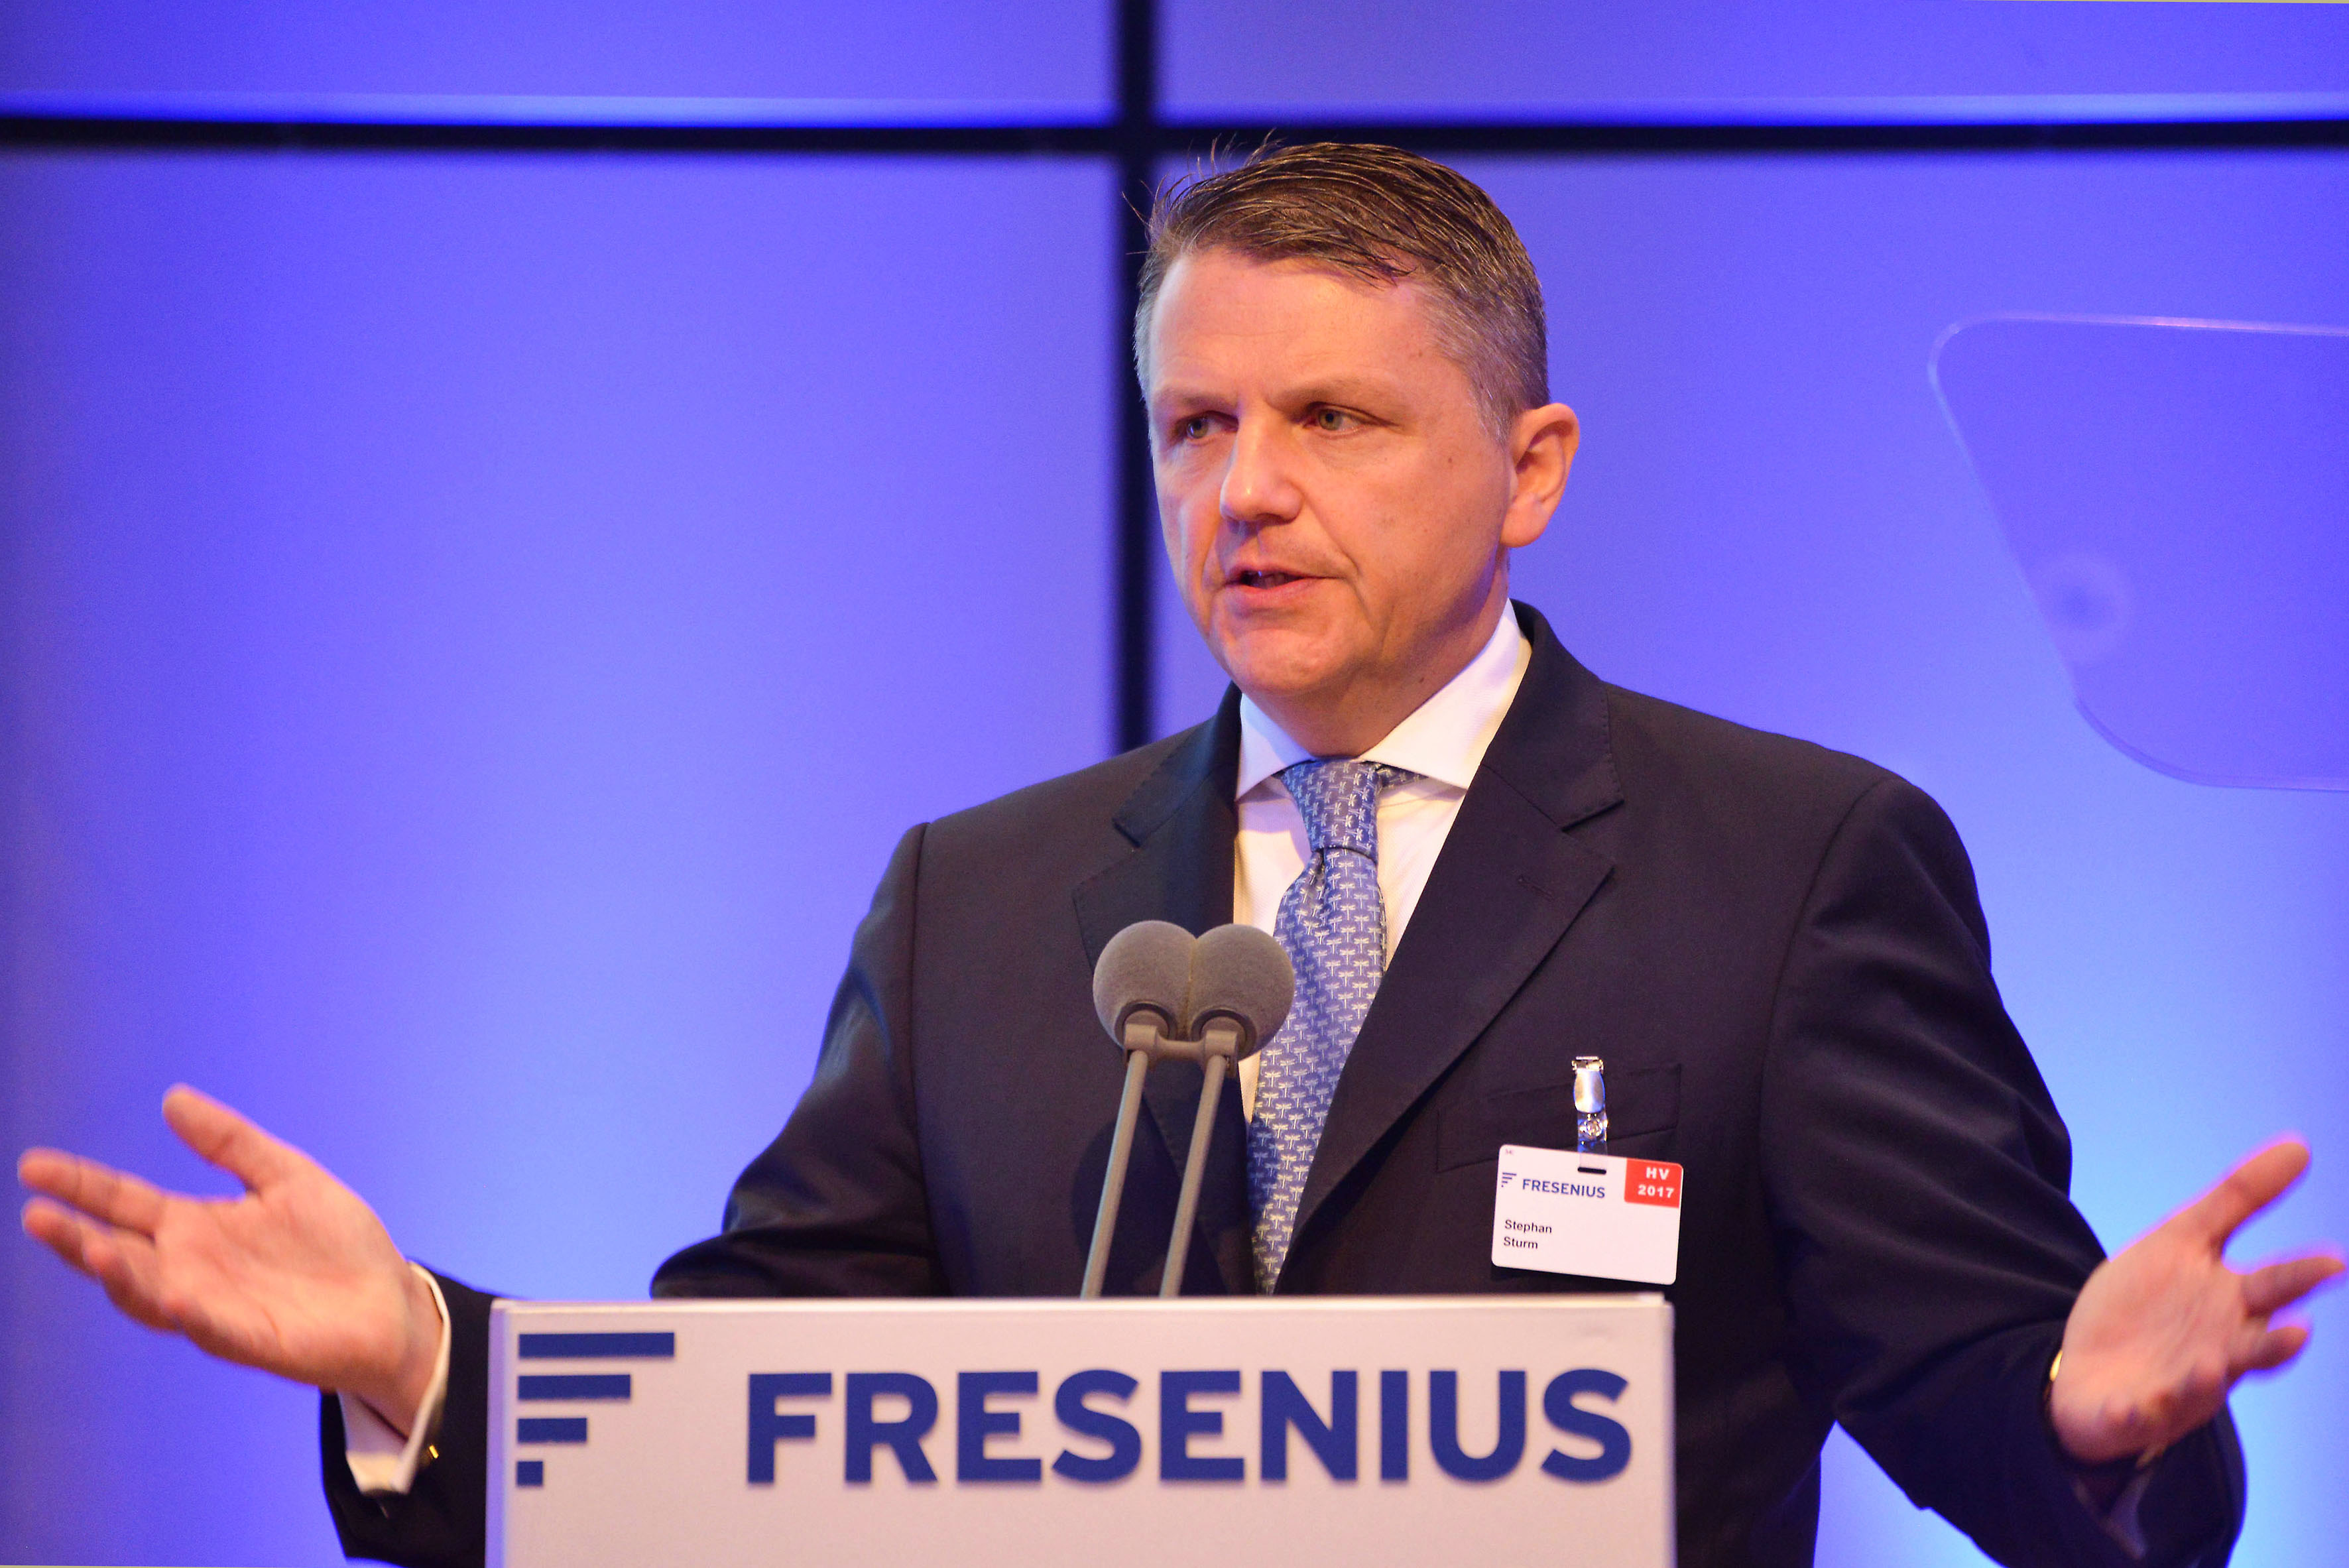
Stephan Sturm, CEO of Fresenius: "Even in politically and economically unstable times, Fresenius achieves stable – and dynamic – growth." Download Image (JPG 852 KB) -
![]()
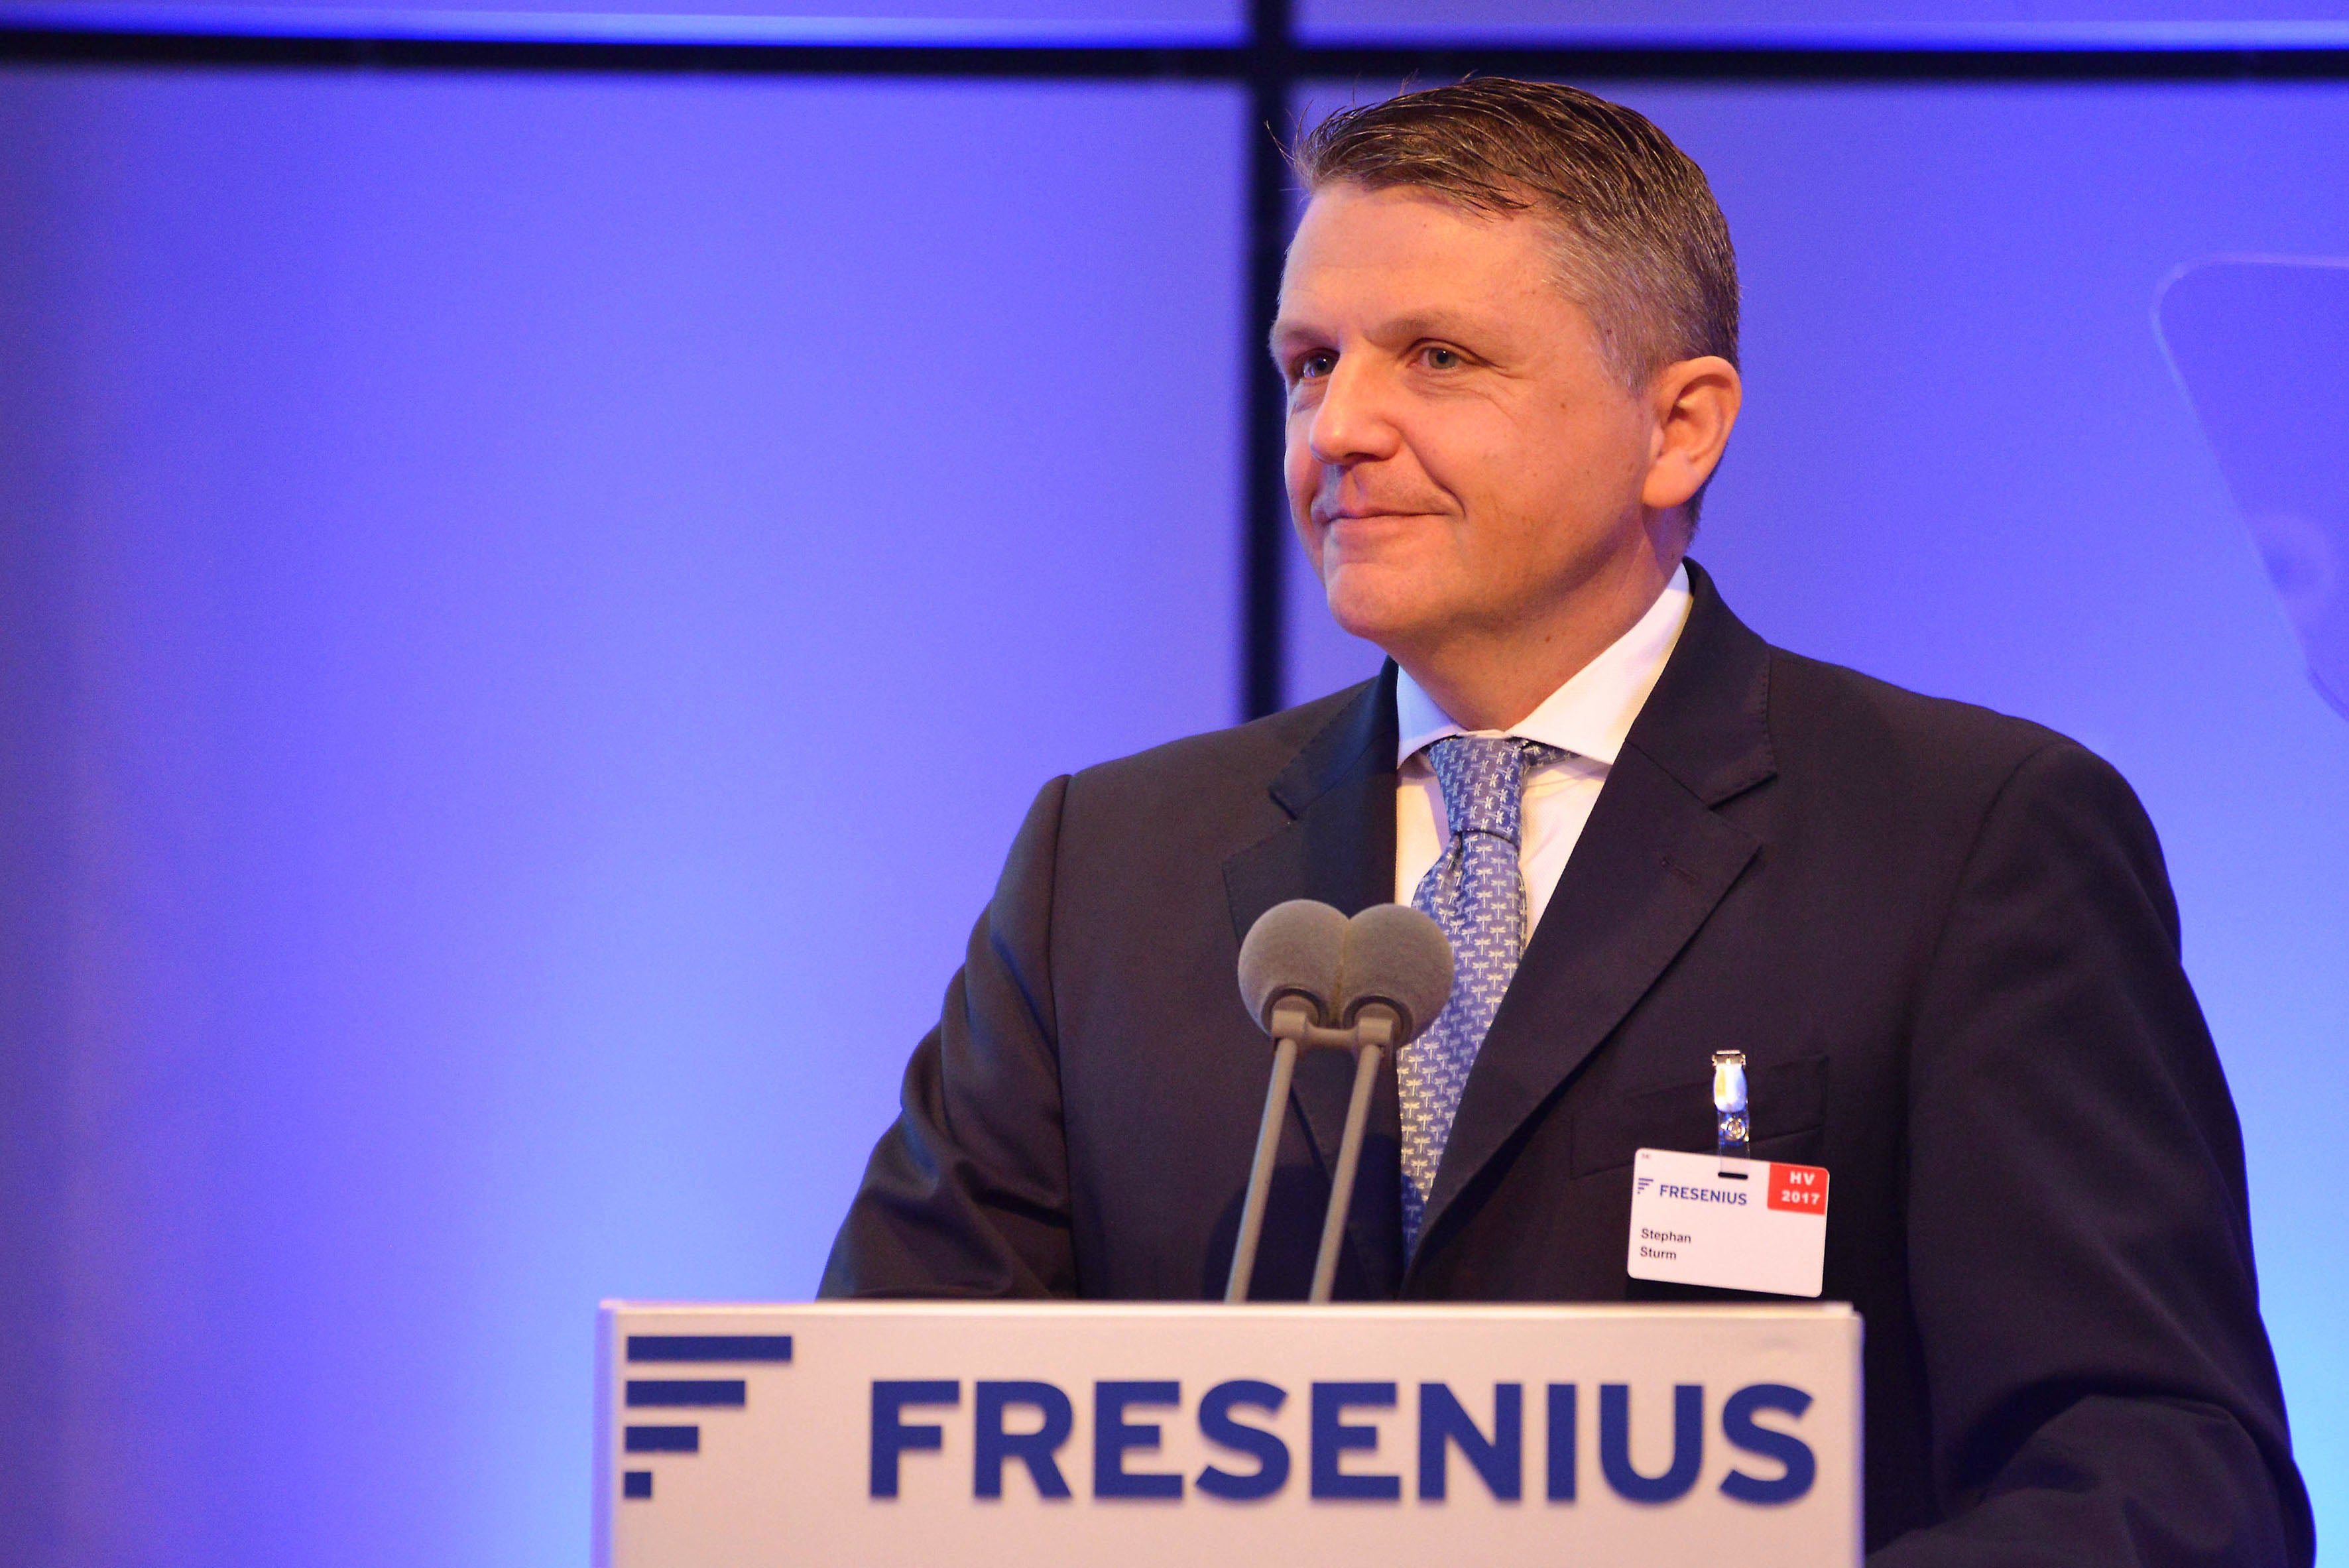
Stephan Sturm, CEO of Fresenius: "The course is also set for growth in the future. We made an excellent start in the new business year." -
![]()
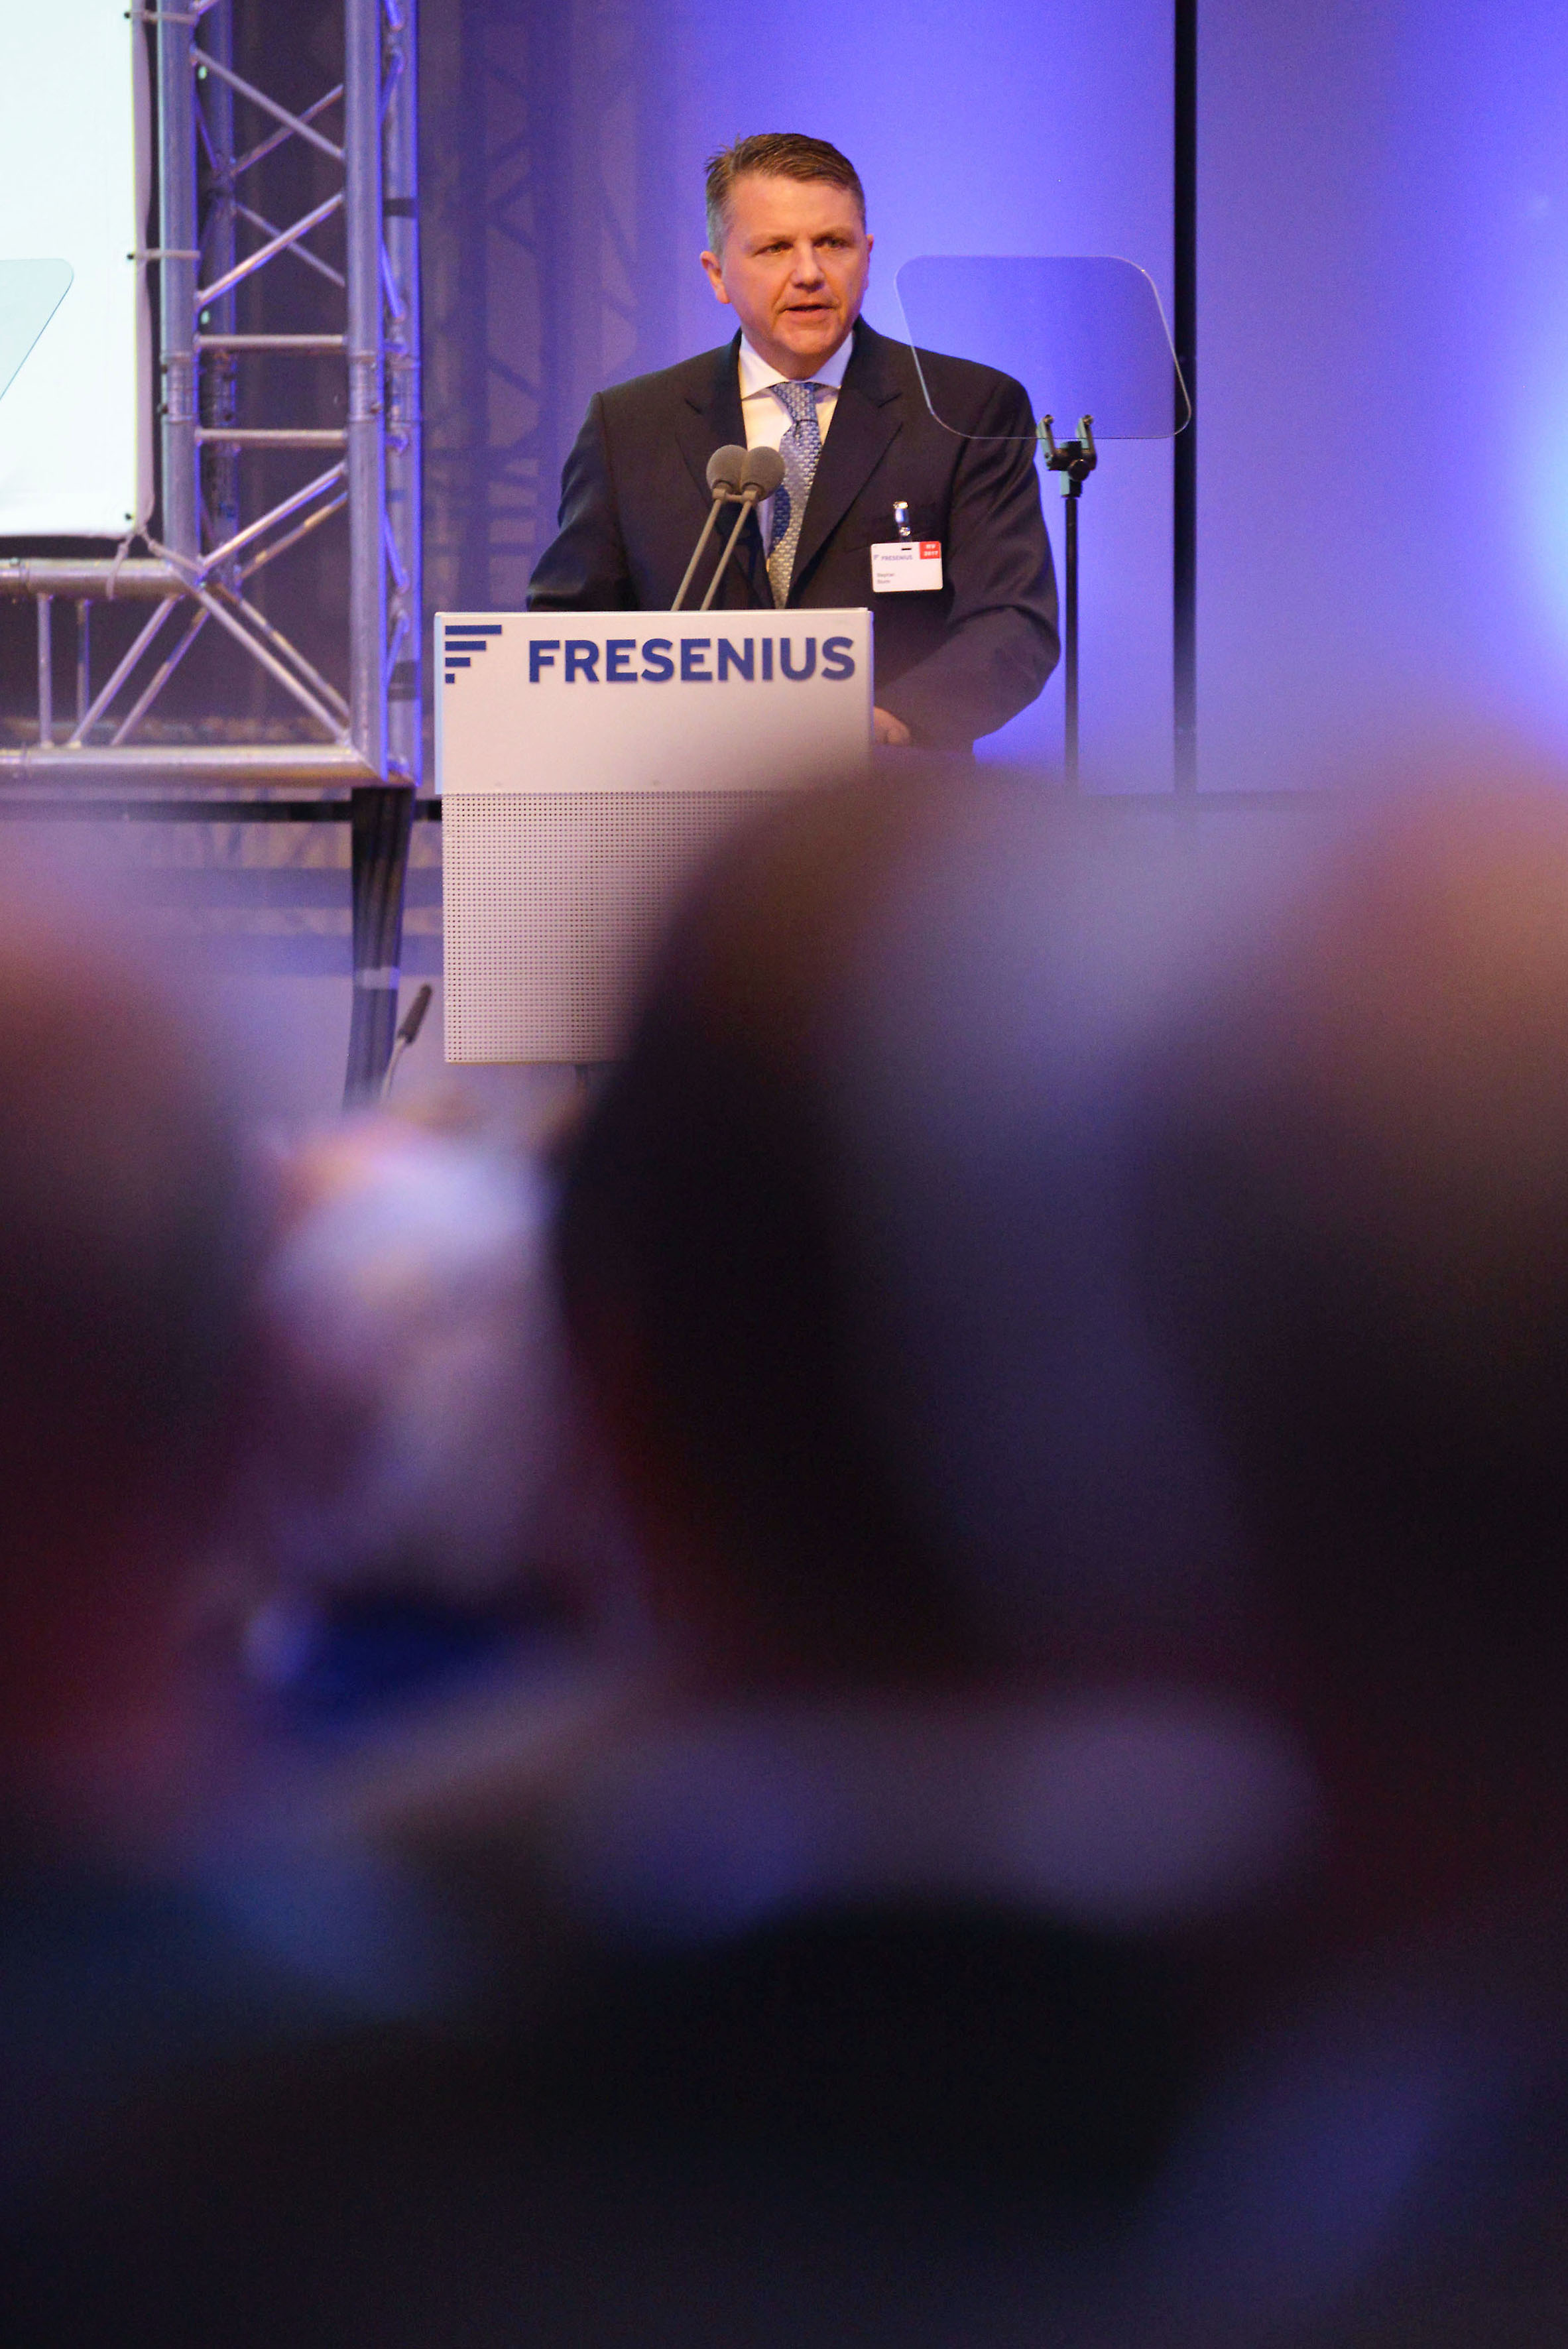
Stephan Sturm, CEO of Fresenius: "Today, more than 260,000 women and men work for Fresenius, in over 100 countries. Without them, the great success of our company would not be possible." Download Image (JPG 786 KB) -
![]()
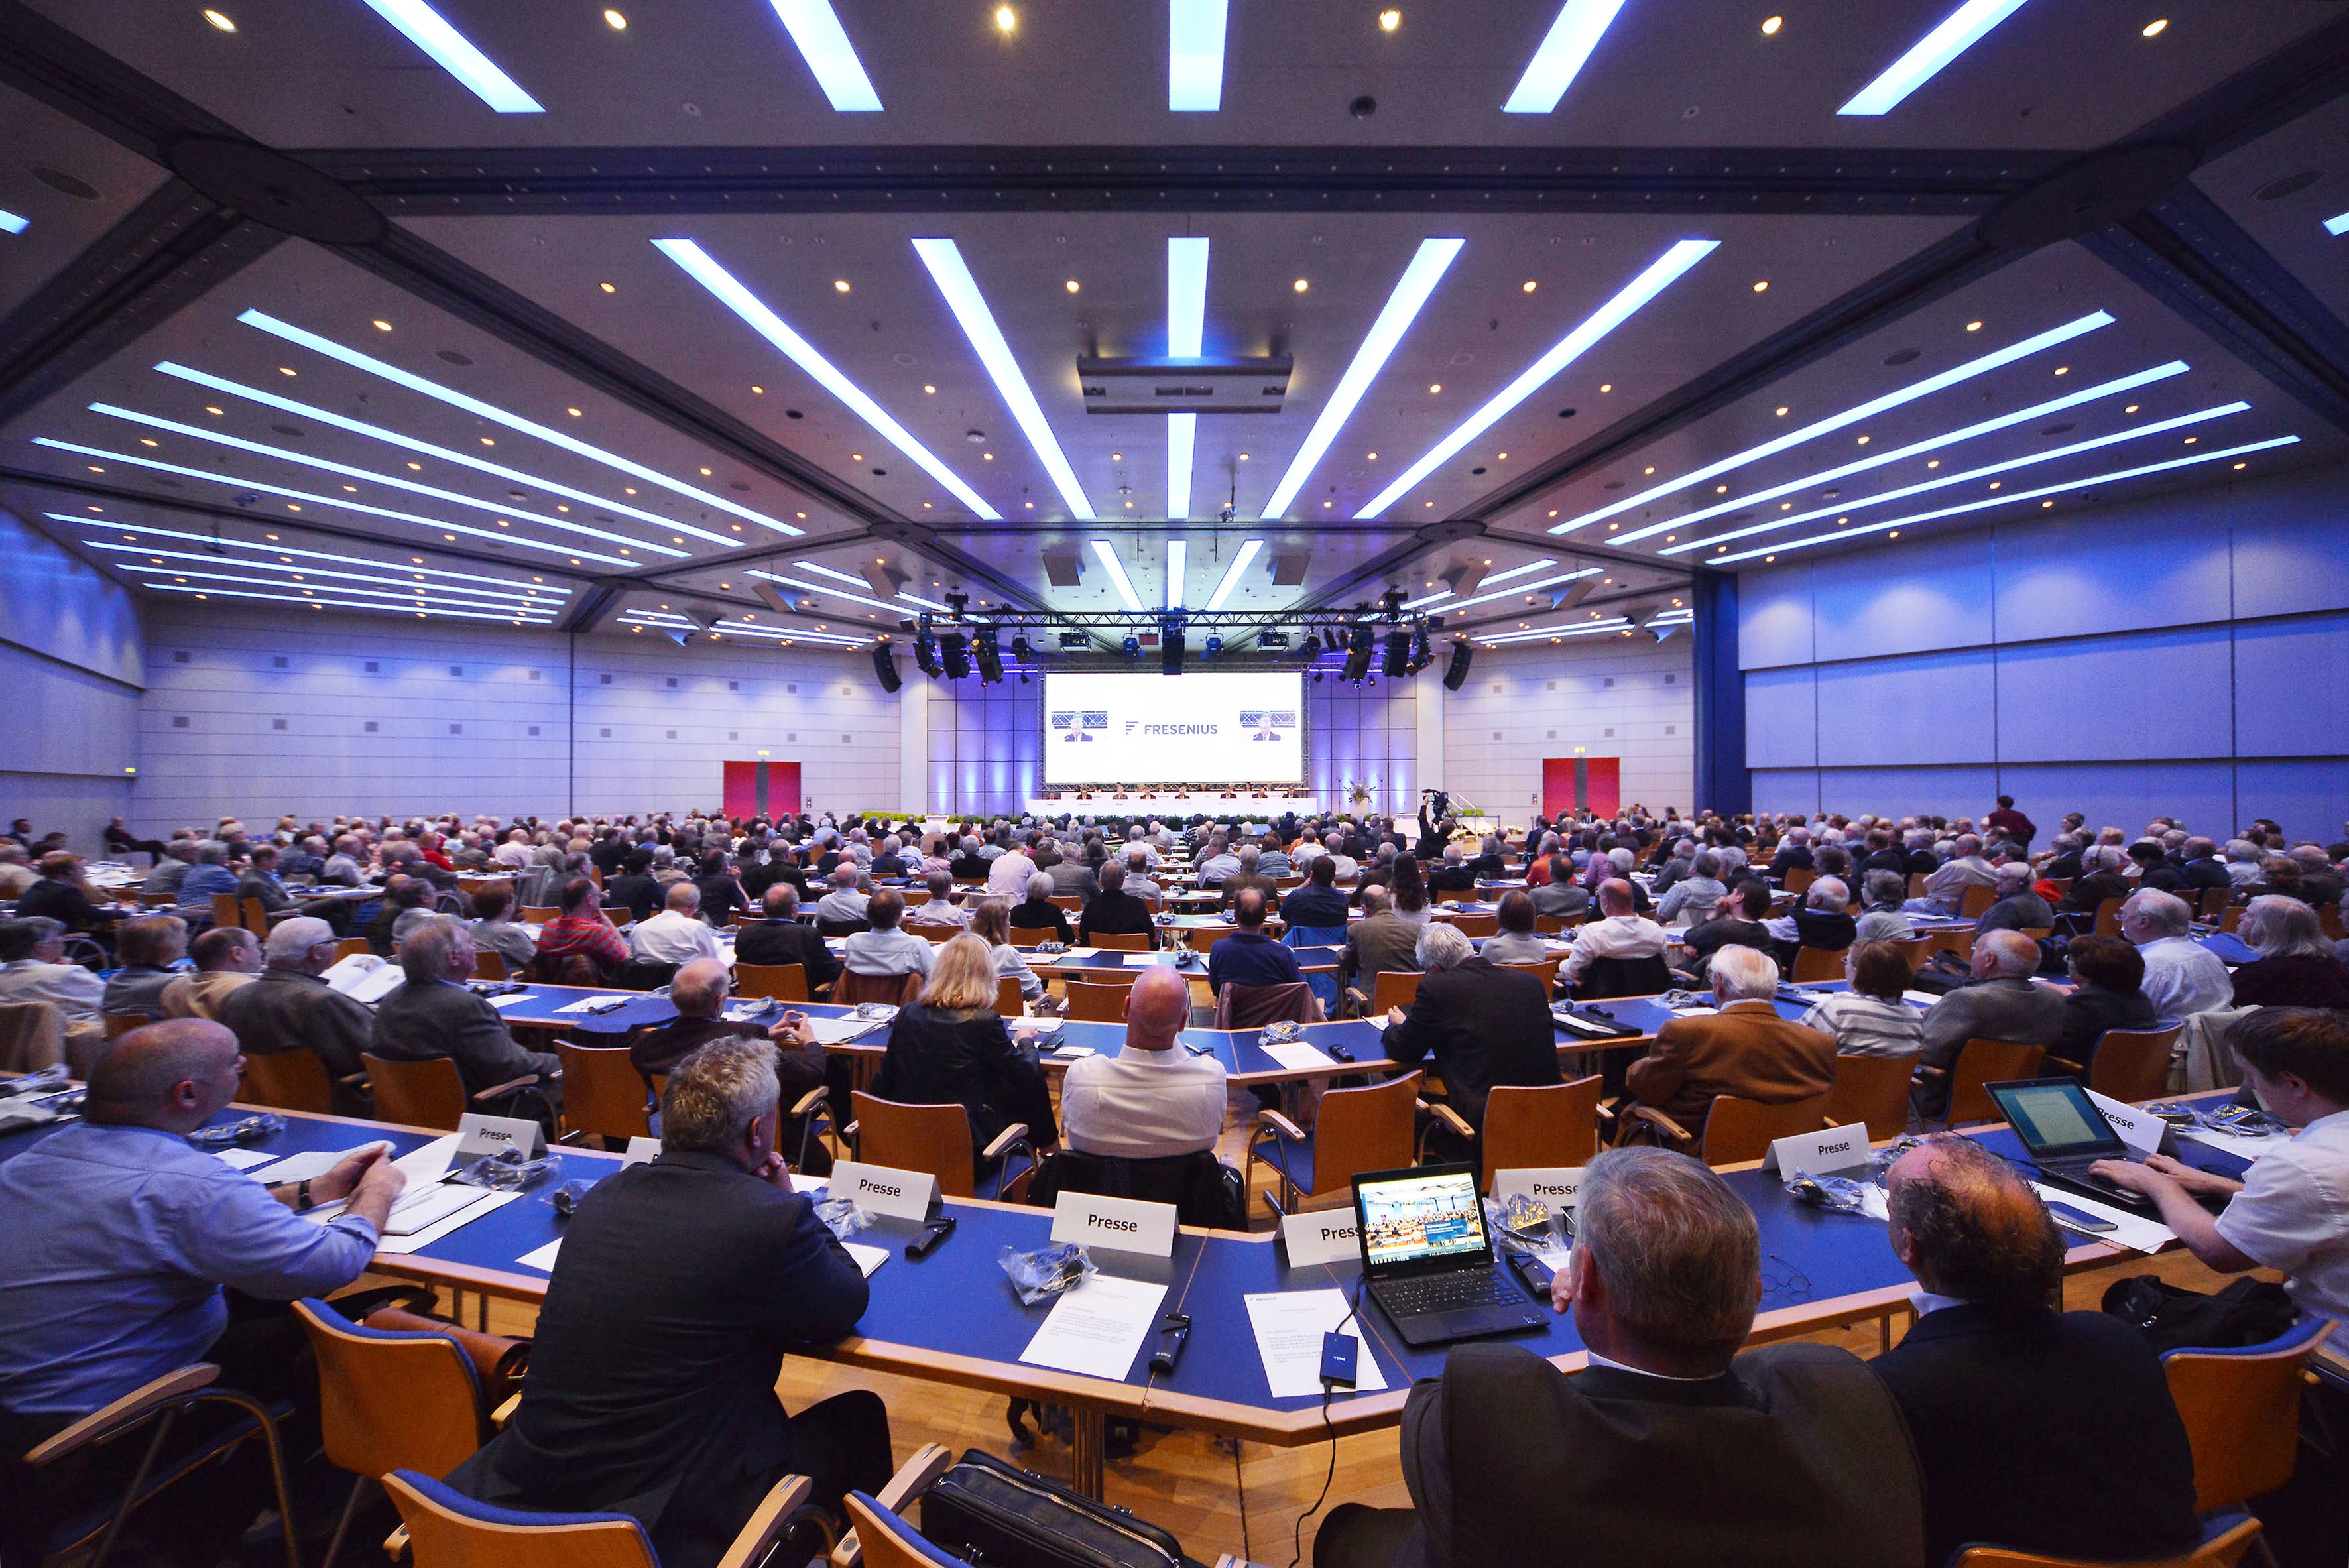
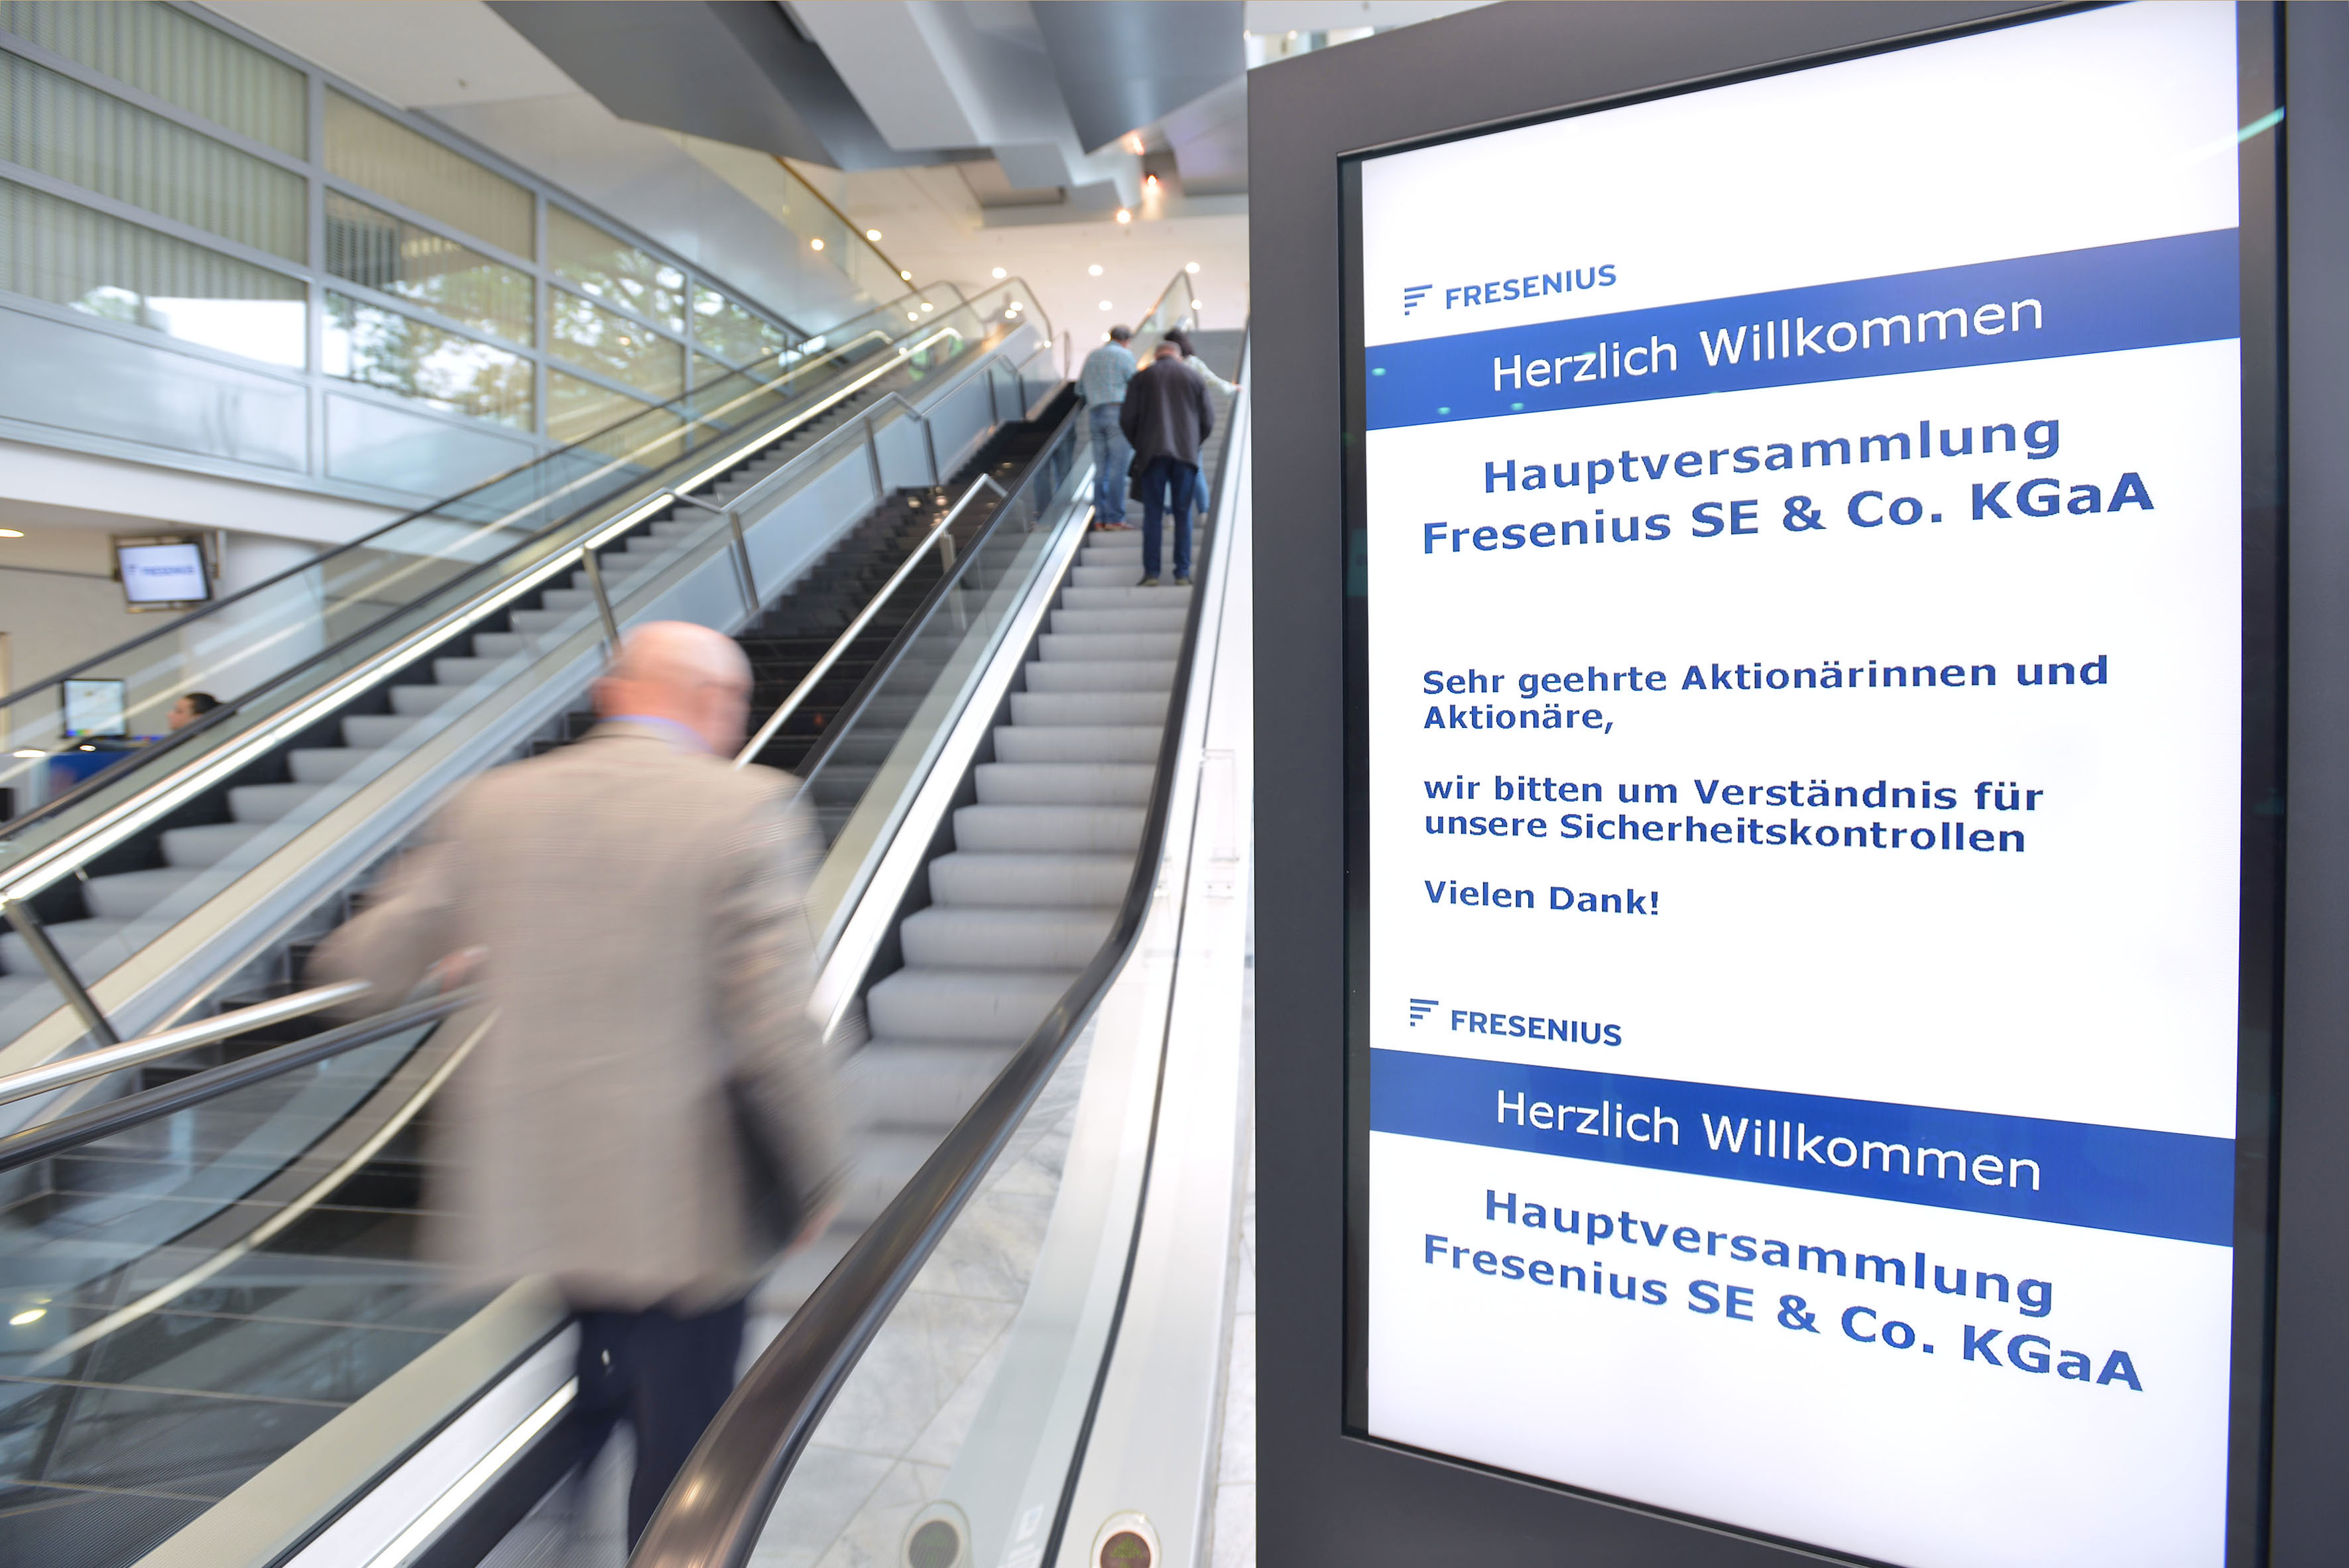
Fresenius Annual General Meeting on May 12, 2017 in Frankfurt, Germany. -
![]()
Fresenius Annual General Meeting on May 12, 2017 in Frankfurt, Germany. Download Image (JPG 750 KB) -
![]()
Fresenius Annual General Meeting on May 12, 2017 in Frankfurt, Germany. Download Image (JPG 1.06 MB)
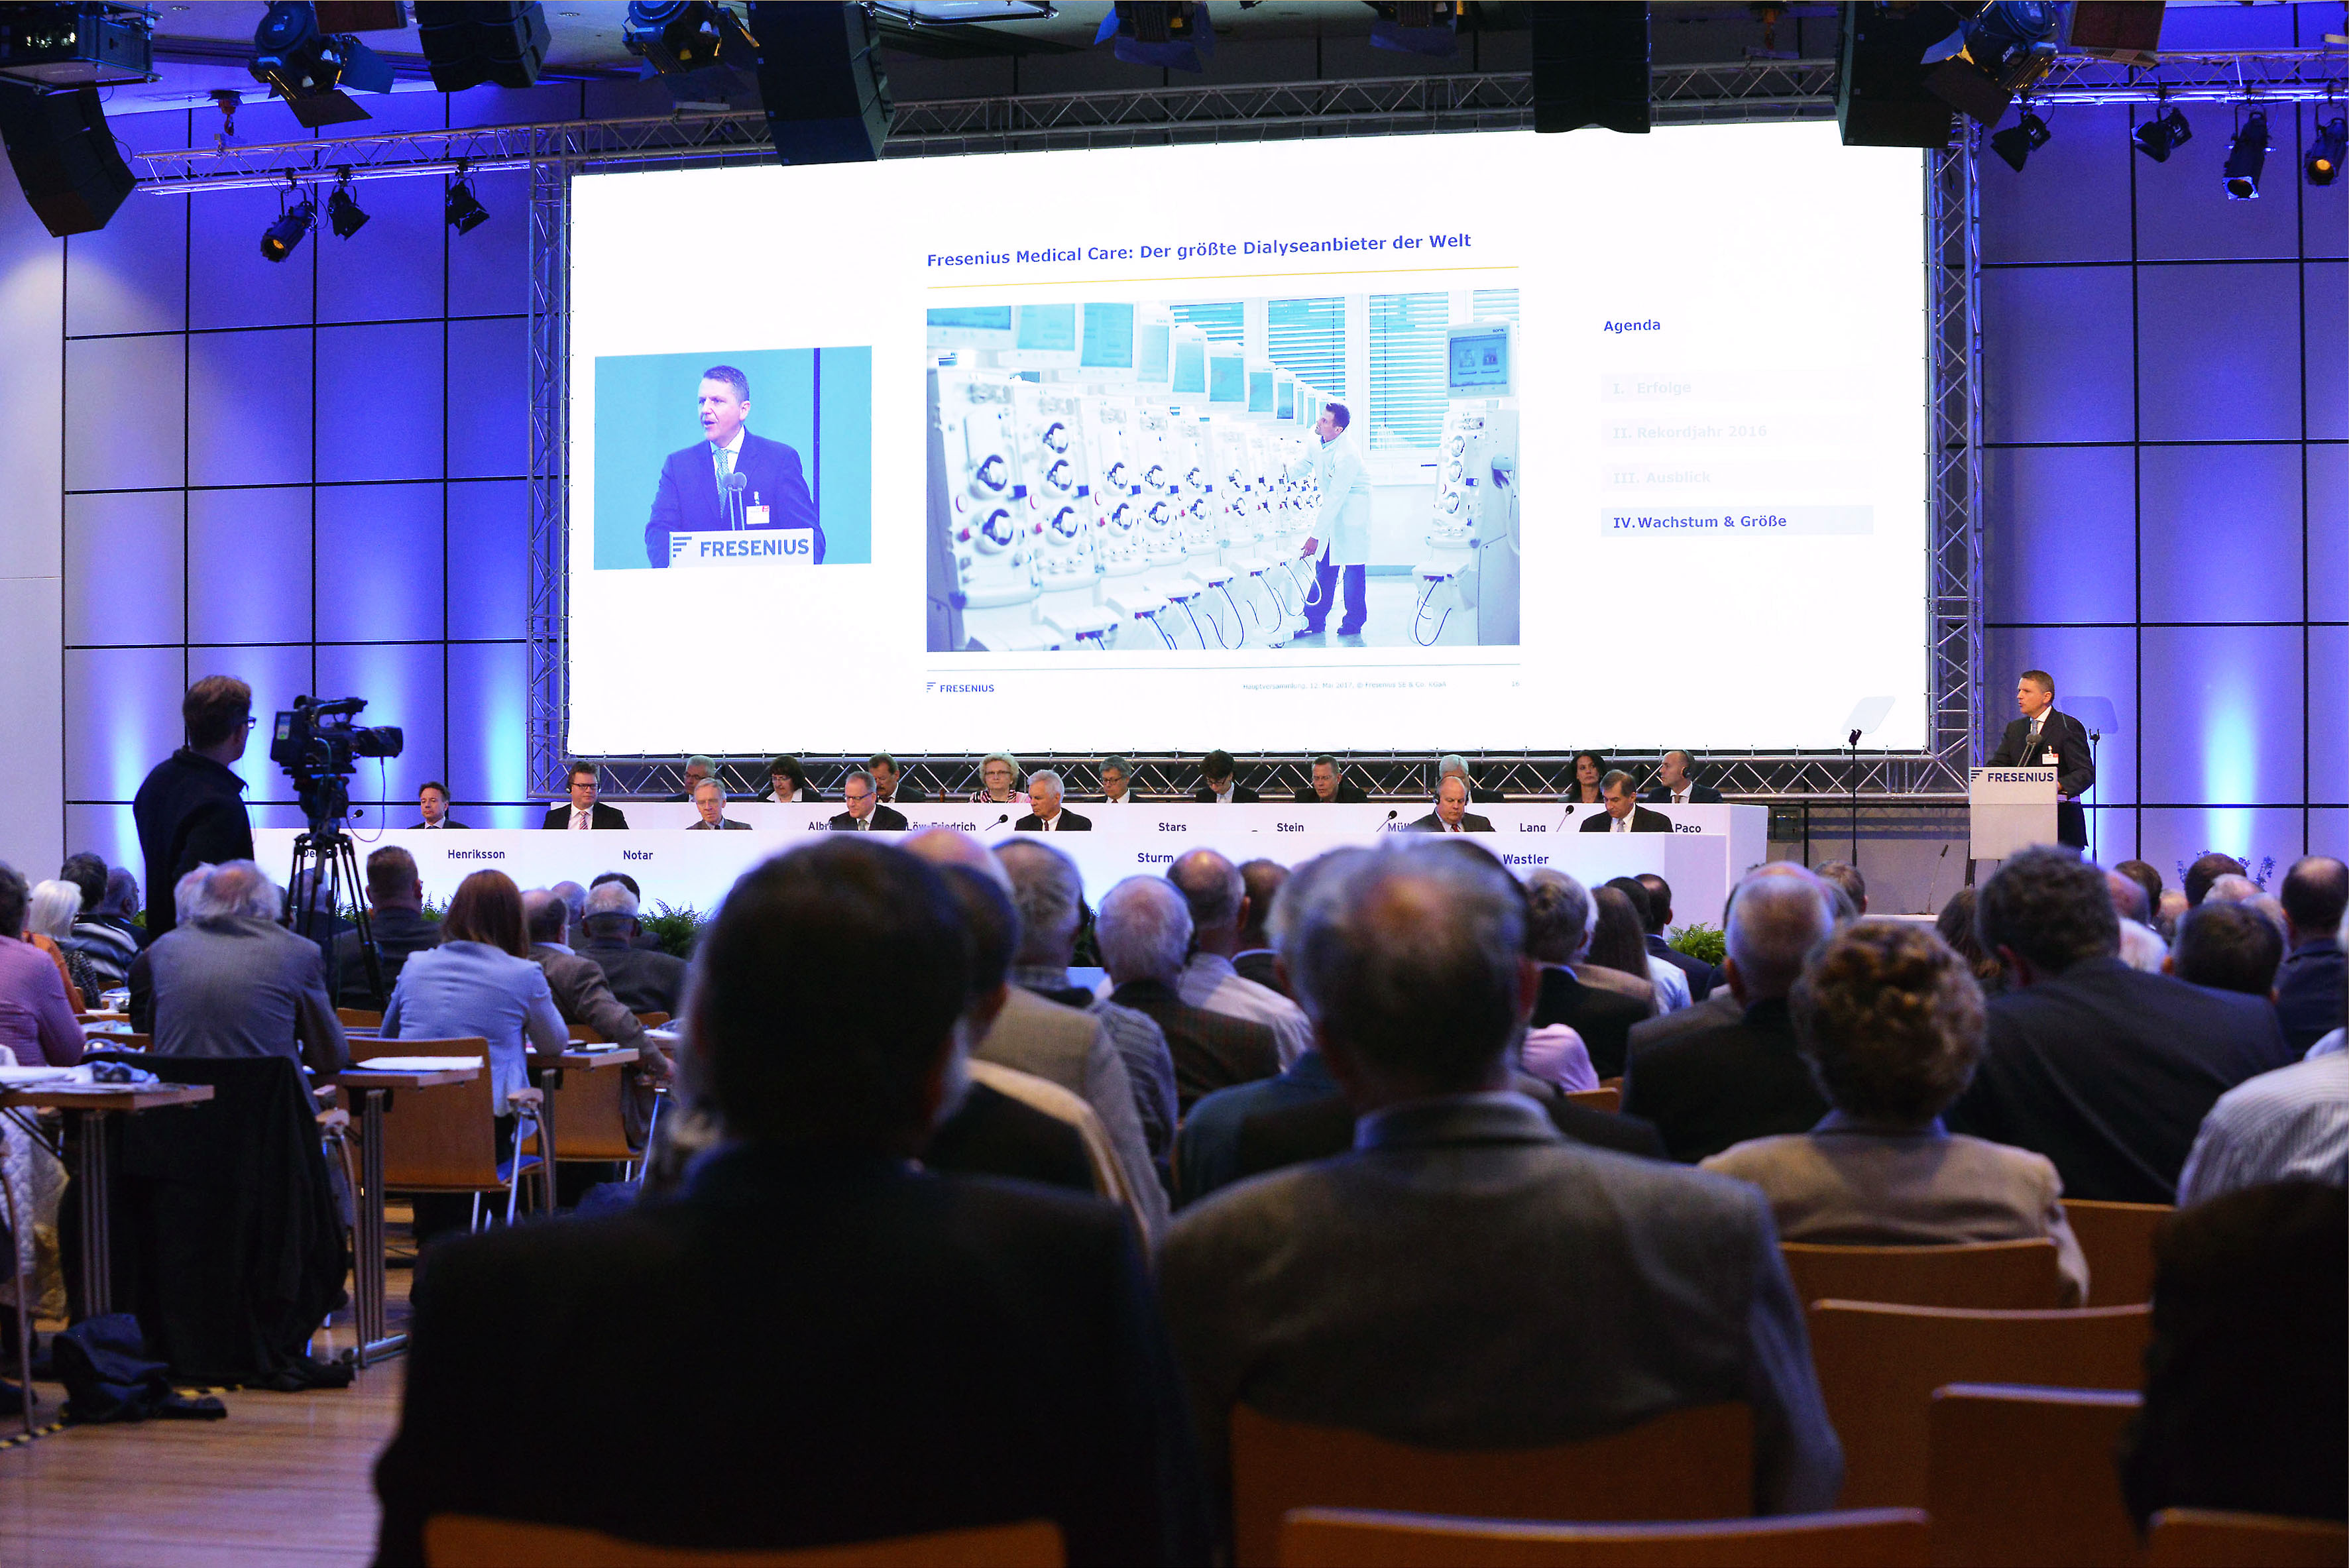
Fresenius expects new record sales and earnings in the current business year. At the Annual General Meeting in Frankfurt today, Stephan Sturm, CEO of Fresenius, confirmed the 2017 targets. The company is forecasting sales growth of 15 to 17 percent, and an increase in net income of 19 to 21 percent1, both in constant currency. After a very strong first quarter, Fresenius raised its Group earnings guidance in early May.
In his first speech as CEO to the Annual General Meeting, Sturm stressed the link between growth and the well-being of patients: “We never let ourselves become complacent, or satisfied with the tried and tested. That is true for products and services, and it’s true for the company as a whole. This is why we want to continue growing, and will. Because that is what enables us to offer even better products and therapies. And because we are contributing to high-quality medicine that remains affordable. In future, that will remain our commitment: better medicine for more people.”
Sturm also discussed the strategically important acquisitions of the U.S. generic pharmaceuticals provider Akorn and the biosimilars business of Merck KGaA, which were announced in April: “They broaden our range of high-quality yet affordable drugs, and take us into new, attractive growth areas. The acquisitions also strengthen Fresenius as a whole. With Quirónsalud, we have expanded our therapy area, and now we are expanding our product business. Both areas are decisive for our success, and we want to grow further in both of them.”
Shareholders approved with a majority of 91.04 percent the 24th consecutive dividend increase proposed by the general partner and the Supervisory Board. The dividend was raised by 13 percent to €0.62 per share.
Shareholder majorities of 99.95 percent and 91.81 percent, respectively, approved the actions of the Management and Supervisory Boards in 2016.
At the Annual General Meeting, 70.03 percent of the subscribed capital was represented.
1 Net income attributable to shareholders of Fresenius SE & Co. KGaA; before transaction costs of ~€50 million for the acquisitions of Akorn, Inc. and Merck KGaA’s biosimilars business; before expected expenditures for the further development of Merck KGaA’s biosimilars business of ~€50 million (expected closing H2/17)
Press Release
This release contains forward-looking statements that are subject to various risks and uncertainties. Future results could differ materially from those described in these forward-looking statements due to certain factors, e.g. changes in business, economic and competitive conditions, regulatory reforms, results of clinical trials, foreign exchange rate fluctuations, uncertainties in litigation or investigative proceedings, and the availability of financing. Fresenius does not undertake any responsibility to update the forward-looking statements in this release.
Q1/2017:
• Sales: €8.4 billion (+19%, +17% in constant currency)
• EBIT: €1,216 million (+27%, +25% in constant currency)
• Net income1 : €457 million (+28%, +26% in constant currency)
1 Net income attributable to shareholders of Fresenius SE & Co. KGaA
Stephan Sturm, CEO of Fresenius, said: “Fresenius made an excellent start in 2017. All four business segments developed very well in the first quarter and continue to have healthy growth prospects. That makes us all the more optimistic as we look ahead. From this position of strength, and bolstered by strategically important acquisitions, we are building an even stronger foundation for our long-term success.”
2017 Group earnings guidance raised1,2,3
Based on the Group’s strong Q1 results and ongoing bright prospects for the remainder of the year, Fresenius raises its 2017 Group earnings guidance published in February 2017. Group net income3 on a like-for-like basis, i.e. before effects of the recently announced acquisitions at Fresenius Kabi, is now expected to grow by 19% to 21% in constant currency (previously: 17% to 20%).
Including expenditures for the further development of Merck KGaA’s biosimilars business, which is expected to be acquired in the second half of 2017, Fresenius projects net income3 growth in constant currency within the previous range of 17% to 20%.
Fresenius confirms its sales guidance. Group sales are expected to increase by 15% to 17% in constant currency.
Pro forma the acquisitions of Akorn and Merck KGaA’s biosimilars business, the net debt/EBITDA4ratio is expected to be approximately 3.3 at the end of 2017.
17% sales growth in constant currency
Group sales increased by 19% (17% in constant currency) to €8,362 million (Q1/2016: €7,015 million). Organic sales growth was 7%5. Positive currency translation effects (2%) were mainly related to the appreciation of the US-Dollar against the Euro. Divestitures had no impact on sales. Acquisitions and the €100 million agreement with the United States Departments of Veterans Affairs and Justice at Fresenius Medical Care North America (“VA agreement”) contributed 10%.
1 Before transaction costs of ~€50 million for the acquisitions of Akorn, Inc. and Merck KGaA’s biosimilars business2 Before expected expenditures for the further development of Merck KGaA’s biosimilars business of ~€50 million (expected closing H2/17)3 Net income attributable to shareholders of Fresenius SE & Co. KGaA4 Calculated at expected FY average exchange rates for both net debt and EBITDA; before transaction costs of ~€50 million; excluding further potential acquisitions5 Excluding effects of VA-agreement
Group sales by region:

26% net income1 growth in constant currency
Group EBITDA increased by 26% (23% in constant currency) to €1,560 million (Q1/2016: €1,241 million). Group EBIT increased by 27% (25% in constant currency) to €1,216 million (Q1/2016: €959 million). The EBIT margin increased to 14.5% (Q1/2016: 13.7%).
Group net interest increased to -€157 million (Q1/2016: -€152 million), mainly due to the financing of the Quirónsalud acquisition.
The Group tax rate increased to 29.1% (Q1/2016: 28.4%), mainly driven by the higher proportion of U.S. pre-tax income, primarily due to the VA-agreement.
Noncontrolling interest increased to €294 million (Q1/2016: €220 million), of which 96% was attributable to the noncontrolling interest in Fresenius Medical Care.
Group net income1 increased by 28% (26% in constant currency) to €457 million (Q1/2016: €358 million). The VA-agreement increased net income1 by €18 million or 5%-points. Earnings per share1 increased by 28% (25% in constant currency) to €0.83 (Q1/2016: €0.65).
1 Net income attributable to shareholders of Fresenius SE & Co. KGaA
Continued investment in growth
Spending on property, plant and equipment was €328 million (Q1/2016: €315 million), primarily for the modernization and expansion of dialysis clinics, production facilities and hospitals. Total acquisition spending of €6,083 million (Q1/2016: €204 million) was mainly related to the acquisition of Quirónsalud.
Strong operating cash flow
Operating cash flow increased by 42% to €476 million (Q1/2016: €336 million), mainly driven by the excellent development at Fresenius Kabi and Fresenius Helios. The cash flow margin was 5.7% (Q1/2016: 4.8%).
Free cash flow before acquisitions and dividends increased to €148 million (Q1/2016: €2 million). Free cash flow after acquisitions and dividends was -€5,393 million
(Q1/2016: -€241 million).
Solid balance sheet structure
The Group’s total assets increased by 17% (17% in constant currency) to €54,418 million (Dec. 31, 2016: €46,697 million), mainly due to the acquisition of Quirónsalud. Current assets grew by 11% (12% in constant currency) to €13,077 million (Dec. 31, 2016: €11,744 million). Non-current assets increased by 18% (19% in constant currency) to €41,341 million (Dec. 31, 2016: €?34,953 million).
Total shareholders’ equity grew by 5% (6% in constant currency) to €21,921 million (Dec. 31, 2016: €20,849 million). The equity ratio was 40.3% (Dec. 31, 2016: 44.6%).
Group debt increased by 37% (37% in constant currency) to €20,210 million (Dec. 31, 2016: €?14,780 million), mainly driven by the acquisition financing of Quirónsalud. As of March 31, 2017, the net debt/EBITDA ratio was 2.981,3 (Dec. 31, 2016: 2.331,3/3.091,2,3).
1 Net debt and EBITDA at LTM average exchange rates2 Pro forma Quirónsalud3 Pro forma acquisitions
Increased number of employees
As of March 31, 2017, the number of employees increased by 13% to 263,957 (Dec. 31, 2016: 232,873).
Business segments
Fresenius Medical Care
Fresenius Medical Care is the world's largest provider of products and services for individuals with chronic kidney failure. As of March 31, 2017, Fresenius Medical Care was treating 310,473 patients in 3,654 dialysis clinics. Along with its core business, the company seeks to expand the range of medical services in the field of care coordination.

• 12% sales growth in constant currency (10% excluding the VA-agreement)
• 41% net income growth1 in constant currency (14% excluding the VA-agreement)
• 2017 outlook confirmed
1 Net income attributable to shareholders of Fresenius Medical Care AG & Co. KGaA
Sales increased by 16% (12% in constant currency) to €4,548 million (Q1/2016: €3,916 million). Organic sales growth was 8%. Acquisitions/divestitures and the VA agreement contributed 4% in total.
Health Care services sales (dialysis services and care coordination) increased by 18% (14% in constant currency) to €3,769 million (Q1/2016: €3,199 million). Product sales increased by 8% (6% in constant currency) to €779 million (Q1/2016: €718 million).
In North America, sales increased by 18% (14% excluding the VA-agreement) to €3,375 million (Q1/2016: €2,862 million). Health Care services sales grew by 19% to €3,165 million (Q1/2016: €2,670 million). Product sales increased by 9% to €210 million (Q1/2016: €192 million).
Sales outside North America increased by 11% (8% in constant currency) to €1,169 million (Q1/2016: €1,051 million). Health Care services sales increased by 14% (10% in constant currency) to €604 million (Q1/2016: €528 million). Product sales increased by 8% (6% in constant currency) to €564 million (Q1/2016: €523 million).
EBIT increased by 31% (28% in constant currency) to €651 million (Q1/2016: €497 million). The EBIT margin was 14.3% (Q1/2016: 12.7%). Excluding the VA-agreement (€99 million) EBIT increased by 11% (8% in constant currency).
Net income1 increased by 45% (41% in constant currency) to €308 million (Q1/2016: €213 million). Excluding the VA-agreement (€59 million) net income1 increased by 17% (14% in constant currency).
Operating cash flow increased by 4% to €170 million (Q1/2016: €163 million). The cash flow margin was 3.7% (Q1/2016: 4.2%). The VA-agreement partially offset the impact of seasonality in invoicing at Fresenius Medical Care in North America. Fresenius Medical Care expects that this timing effect will have no meaningful impact on the full year 2017.
Fresenius Medical Care confirms its outlook for 2017. The company expects sales to grow by 8% to 10%2 in constant currency. Net income1,2 is expected to increase by 7% to 9% in constant currency.
1 Net income attributable to shareholders of Fresenius Medical Care AG & Co. KGaA2 Excluding effects of VA-agreementFor further information, please see Fresenius Medical Care’s press release at www.freseniusmedicalcare.com.
Fresenius Kabi
Fresenius Kabi offers intravenously administered generic drugs, clinical nutrition and infusion therapies for seriously and chronically ill patients in the hospital and outpatient environments. The company is also a leading supplier of medical devices and transfusion technology products.

• 7% organic sales growth; positive contributions from all regions
• 2% constant currency EBIT growth despite very strong PY quarter
• 2017 outlook raised: 6% to 8%2,3, EBIT growth in constant currency expected
Sales increased by 9% (organic growth: 7%) to €1,604 million (Q1/2016: €1,470 million). Positive currency translation effects (2%) were mainly related to the appreciation of the US-Dollar against the Euro. Acquisitions/divestitures had no impact on sales.
Sales in Europe increased by 6% (organic growth: 7%) to €544 million (Q1/2016: €512 million). Currency translation effects reduced sales by 1%.
Sales in North America increased by 7% (organic growth: 4%) to €619 million (Q1/2016: €576 million).
Sales in Asia-Pacific increased by 10% (organic growth: 10%) to €280 million (Q1/2016: €254 million).
Sales in Latin America/Africa increased by 26% to €161 million (Q1/2016: €128 million). Organic sales growth was 14%, mainly due to inflation-driven price increases.
EBIT increased by 3% (2% in constant currency) to €313 million (Q1/2016: €303 million). The EBIT margin was 19.5% (Q1/2016: 20.6%).
Net income1 increased by 10% (9% in constant currency) to €191 million (Q1/2016: €173 million).
Operating cash flow increased by 51% to €192 million (Q1/2016: €127 million) driven by strong operating results and improved net working capital. The margin increased to 12.0% (Q1/2016: 8.6%).
Fresenius Kabi raises its outlook for 2017 and now expects EBIT growth in constant currency of 6% to 8%2,3, (previously 5% to 7%). The company confirms its guidance of 5% to 7% organic sales growth.
1 Net income attributable to shareholders of Fresenius SE & Co. KGaA2 Before transaction costs of ~€50 million for the acquisitions of Akorn, Inc. and Merck KGaA’s biosimilars business3 Before expected expenditures for the further development of Merck KGaA’s biosimilars business of ~€50 million (expected closing H2/17)
Fresenius Helios
Fresenius Helios is Europe's leading private hospital operator. The company comprises HELIOS Kliniken in Germany and Quirónsalud in Spain. HELIOS Kliniken operates 112 hospitals, thereof 88 acute care clinics and 24 post-acute care clinics, and treats more than 5.2 million patients annually. Quirónsalud operates 44 hospitals, 43 outpatient centers and around 300 occupational risk prevention centers, and treats approximately 9.7 million patiens per year.

• 5% organic sales growth
• 60% EBIT increase (14% excluding Quirónsalud)
• 2017 outlook confirmed
Sales increased by 41% (organic growth: 5%) to €2,018 million (Q1/2016: €1,435 million). Acquisitions, mainly Quirónsalud, increased sales by 36%. Quirónsalud is consolidated since February 1, 2017. Sales of Quirónsalud were €490 million in February and March 2017.
Sales of HELIOS Kliniken2 increased by 6% (organic growth: 5%) to €1,528 million.
EBIT grew by 60% to €255 million (Q1/2016: €159 million). The EBIT margin increased to 12.6% (Q1/2016: 11.1%).
EBIT of HELIOS Kliniken2 increased by 14% to €181 million with a margin of 11.8% (Q1/2016: 11.1%). EBIT of Quirónsalud was €74 million with a margin of 15.1%.
Net income1 increased by 46% to €181 million (Q1/2016: €124 million).
1 Net income attributable to shareholders of Fresenius SE & Co. KGaA2 HELIOS Kliniken Germany, excluding Quirónsalud
Operating cash flow increased by 179% to €184 million (Q1/2016: €66 million) driven by the first time consolidation of Quirónsalud and good operating results. The margin increased to 9.1% (Q1/2016: 4.6%).
Fresenius Helios confirms its outlook for 2017 and projects organic sales growth of 3% to 5%1 and sales of ~€8.6 billion (thereof Quirónsalud: ~€2.5 billion2). EBIT is expected to increase to €1,020 to €1,070 million (thereof Quirónsalud: €300 to 320 million2).
1 HELIOS Kliniken Germany, excluding Quirónsalud2 Quirónsalud consolidated for 11 months
Fresenius Vamed
Fresenius Vamed manages projects and provides services for hospitals and other health care facilities worldwide. The portfolio ranges along the entire value chain: from project development, planning, and turnkey construction, via maintenance and technical management, to total operational management.

• 2% organic sales growth driven by service business
• Project business with strong order intake of €220 million
• 2017 outlook confirmed
Sales increased by 2% (organic growth: 2%) to €223 million (Q1/2016: €218 million). Sales in the project business decreased by 9% to €77 million (Q1/2016: €85 million). Sales in the service business grew by 10% to €146 million (Q1/2016: €133 million).
EBIT decreased by 14% to €6 million (Q1/2016: €7 million). The EBIT margin decreased to 2.7% (Q1/2016: 3.2%).
Net income1 decreased by 20% to €4 million (Q1/2016: €5 million).
Order intake reached a strong €220 million, could not quite match the previous year’s excellent level (Q1/2016: €237 million). As of March 31, 2017, order backlog grew to a record €2,104 million (December 31, 2016: €1,961 million).
Fresenius Vamed confirms its outlook for 2017 and expects both organic sales growth and EBIT growth in the range of 5% to 10%.
1 Net income attributable to shareholders of VAMED AG
Conference Call
As part of the publication of the results for the first quarter of 2017, a conference call will be held on May 3, 2017 at 2 p.m. CEDT (8 a.m. EDT). All investors are cordially invited to follow the conference call in a live broadcast over the Internet at www.fresenius.com/investors. Following the call, a replay will be available on our website.
# # #
For additional information on the performance indicators used please refer to our website https://www.fresenius.com/alternative-performance-measures.
This release contains forward-looking statements that are subject to various risks and uncertainties. Future results could differ materially from those described in these forward-looking statements due to certain factors, e.g. changes in business, economic and competitive conditions, regulatory reforms, results of clinical trials, foreign exchange rate fluctuations, uncertainties in litigation or investigative proceedings, and the availability of financing. Fresenius does not undertake any responsibility to update the forward-looking statements in this release.
Q1/2017:
• Sales: €8.4 billion (+19%, +17% in constant currency)
• EBIT: €1,216 million (+27%, +25% in constant currency)
• Net income1: €457 million (+28%, +26% in constant currency)
1 Net income attributable to shareholders of Fresenius SE & Co. KGaA
Stephan Sturm, CEO of Fresenius, said: “Fresenius made an excellent start in 2017. All four business segments developed very well in the first quarter and continue to have healthy growth prospects. That makes us all the more optimistic as we look ahead. From this position of strength, and bolstered by strategically important acquisitions, we are building an even stronger foundation for our long-term success.”
2017 Group earnings guidance raised1,2,3
Based on the Group’s strong Q1 results and ongoing bright prospects for the remainder of the year, Fresenius raises its 2017 Group earnings guidance published in February 2017. Group net income3 on a like-for-like basis, i.e. before effects of the recently announced acquisitions at Fresenius Kabi, is now expected to grow by 19% to 21% in constant currency (previously: 17% to 20%).
Including expenditures for the further development of Merck KGaA’s biosimilars business, which is expected to be acquired in the second half of 2017, Fresenius projects net income3 growth in constant currency within the previous range of 17% to 20%1.
Fresenius confirms its sales guidance. Group sales are expected to increase by 15% to 17% in constant currency.
Pro forma the acquisitions of Akorn and Merck KGaA’s biosimilars business, the net debt/EBITDA4 ratio is expected to be approximately 3.3 at the end of 2017.
17% sales growth in constant currency
Group sales increased by 19% (17% in constant currency) to €8,362 million (Q1/2016: €7,015 million). Organic sales growth was 7%5 . Positive currency translation effects (2%) were mainly related to the appreciation of the US-Dollar against the Euro. Divestitures had no impact on sales. Acquisitions and the €100 million agreement with the United States Departments of Veterans Affairs and Justice at Fresenius Medical Care North America (“VA agreement”) contributed 10%.
1Before transaction costs of ~€50 million for the acquisitions of Akorn, Inc. and Merck KGaA’s biosimilars business
2Before expected expenditures for the further development of Merck KGaA’s biosimilars business of ~€50 million (expected closing H2/17)
3Net income attributable to shareholders of Fresenius SE & Co. KGaA
4Calculated at expected FY average exchange rates for both net debt and EBITDA; before transaction costs of ~€50 million; excluding further potential acquisitions
5Excluding effects of VA-agreement
Group sales by region:


1 Including effects of VA-agreement
26% net income1 growth in constant currency
Group EBITDA increased by 26% (23% in constant currency) to €1,560 million (Q1/2016: €1,241 million). Group EBIT increased by 27% (25% in constant currency) to €1,216 million (Q1/2016: €959 million). The EBIT margin increased to 14.5% (Q1/2016: 13.7%).
Group net interest increased to -€157 million (Q1/2016: -€152 million), mainly due to the financing of the Quirónsalud acquisition.
The Group tax rate increased to 29.1% (Q1/2016: 28.4%), mainly driven by the higher proportion of U.S. pre-tax income, primarily due to the VA-agreement.
Noncontrolling interest increased to €294 million (Q1/2016: €220 million), of which 96% was attributable to the noncontrolling interest in Fresenius Medical Care.
Group net income1 increased by 28% (26% in constant currency) to €457 million (Q1/2016: €358 million). The VA-agreement increased net income1 by €18 million or 5%-points. Earnings per share1 increased by 28% (25% in constant currency) to €0.83 (Q1/2016: €0.65).
1 Net income attributable to shareholders of Fresenius SE & Co. KGaA
Continued investment in growth
Spending on property, plant and equipment was €328 million (Q1/2016: €315 million), primarily for the modernization and expansion of dialysis clinics, production facilities and hospitals. Total acquisition spending of €6,083 million (Q1/2016: €204 million) was mainly related to the acquisition of Quirónsalud.
Strong operating cash flow
Operating cash flow increased by 42% to €476 million (Q1/2016: €336 million), mainly driven by the excellent development at Fresenius Kabi and Fresenius Helios. The cash flow margin was 5.7% (Q1/2016: 4.8%).
Free cash flow before acquisitions and dividends increased to €148 million (Q1/2016: €2 million). Free cash flow after acquisitions and dividends was -€5,393 million
(Q1/2016: -€241 million).
Solid balance sheet structure
The Group’s total assets increased by 17% (17% in constant currency) to €54,418 million (Dec. 31, 2016: €46,697 million), mainly due to the acquisition of Quirónsalud. Current assets grew by 11% (12% in constant currency) to €13,077 million (Dec. 31, 2016: €11,744 million). Non-current assets increased by 18% (19% in constant currency) to €41,341 million (Dec. 31, 2016: € 34,953 million).
Total shareholders’ equity grew by 5% (6% in constant currency) to €21,921 million (Dec. 31, 2016: €20,849 million). The equity ratio was 40.3% (Dec. 31, 2016: 44.6%).
Group debt increased by 37% (37% in constant currency) to €20,210 million (Dec. 31, 2016: € 14,780 million), mainly driven by the acquisition financing of Quirónsalud. As of March 31, 2017, the net debt/EBITDA ratio was 2.981,3 (Dec. 31, 2016: 2.331,3/3.091,2,3).
1Net debt and EBITDA at LTM average exchange rates
2Pro forma Quirónsalud
3Pro forma acquisitions
Increased number of employees
As of March 31, 2017, the number of employees increased by 13% to 263,957 (Dec. 31, 2016: 232,873).
Business segments
Fresenius Medical Care
Fresenius Medical Care is the world's largest provider of products and services for individuals with chronic kidney failure. As of March 31, 2017, Fresenius Medical Care was treating 310,473 patients in 3,654 dialysis clinics. Along with its core business, the company seeks to expand the range of medical services in the field of care coordination.

 • 12% sales growth in constant currency (10% excluding the VA-agreement)
• 41% net income growth1 in constant currency (14% excluding the VA-agreement)
• 2017 outlook confirmed
1 Net income attributable to shareholders of Fresenius Medical Care AG & Co. KGaA
Sales increased by 16% (12% in constant currency) to €4,548 million (Q1/2016: €3,916 million). Organic sales growth was 8%. Acquisitions/divestitures and the VA agreement contributed 4% in total.
Health Care services sales (dialysis services and care coordination) increased by 18% (14% in constant currency) to €3,769 million (Q1/2016: €3,199 million). Product sales increased by 8% (6% in constant currency) to €779 million (Q1/2016: €718 million).
In North America, sales increased by 18% (14% excluding the VA-agreement) to €3,375 million (Q1/2016: €2,862 million). Health Care services sales grew by 19% to €3,165 million (Q1/2016: €2,670 million). Product sales increased by 9% to €210 million (Q1/2016: €192 million).
Sales outside North America increased by 11% (8% in constant currency) to €1,169 million (Q1/2016: €1,051 million). Health Care services sales increased by 14% (10% in constant currency) to €604 million (Q1/2016: €528 million). Product sales increased by 8% (6% in constant currency) to €564 million (Q1/2016: €523 million).
EBIT increased by 31% (28% in constant currency) to €651 million (Q1/2016: €497 million). The EBIT margin was 14.3% (Q1/2016: 12.7%). Excluding the VA-agreement (€99 million) EBIT increased by 11% (8% in constant currency).
Net income1 increased by 45% (41% in constant currency) to €308 million (Q1/2016: €213 million). Excluding the VA-agreement (€59 million) net income1 increased by 17% (14% in constant currency).
Operating cash flow increased by 4% to €170 million (Q1/2016: €163 million). The cash flow margin was 3.7% (Q1/2016: 4.2%). The VA-agreement partially offset the impact of seasonality in invoicing at Fresenius Medical Care in North America. Fresenius Medical Care expects that this timing effect will have no meaningful impact on the full year 2017.
Fresenius Medical Care confirms its outlook for 2017. The company expects sales to grow by 8% to 10%2 in constant currency. Net income1,2 is expected to increase by 7% to 9% in constant currency.
1Net income attributable to shareholders of Fresenius Medical Care AG & Co. KGaA
2Excluding effects of VA-agreement
For further information, please see Fresenius Medical Care’s press release at www.freseniusmedicalcare.com.
Fresenius Kabi
Fresenius Kabi offers intravenously administered generic drugs, clinical nutrition and infusion therapies for seriously and chronically ill patients in the hospital and outpatient environments. The company is also a leading supplier of medical devices and transfusion technology products.

• 7% organic sales growth; positive contributions from all regions
• 2% constant currency EBIT growth despite very strong PY quarter
• 2017 outlook raised: 6% to 8%2,3, EBIT growth in constant currency expected
Sales increased by 9% (organic growth: 7%) to €1,604 million (Q1/2016: €1,470 million). Positive currency translation effects (2%) were mainly related to the appreciation of the US-Dollar against the Euro. Acquisitions/divestitures had no impact on sales.
Sales in Europe increased by 6% (organic growth: 7%) to €544 million (Q1/2016: €512 million). Currency translation effects reduced sales by 1%.
Sales in North America increased by 7% (organic growth: 4%) to €619 million (Q1/2016: €576 million).
Sales in Asia-Pacific increased by 10% (organic growth: 10%) to €280 million (Q1/2016: €254 million).
Sales in Latin America/Africa increased by 26% to €161 million (Q1/2016: €128 million). Organic sales growth was 14%, mainly due to inflation-driven price increases.
EBIT increased by 3% (2% in constant currency) to €313 million (Q1/2016: €303 million). The EBIT margin was 19.5% (Q1/2016: 20.6%).
Net income1 increased by 10% (9% in constant currency) to €191 million (Q1/2016: €173 million).
Operating cash flow increased by 51% to €192 million (Q1/2016: €127 million) driven by strong operating results and improved net working capital. The margin increased to 12.0% (Q1/2016: 8.6%).
Fresenius Kabi raises its outlook for 2017 and now expects EBIT growth in constant currency of 6% to 8%2,3, (previously 5% to 7%). The company confirms its guidance of 5% to 7% organic sales growth.
1Net income attributable to shareholders of Fresenius SE & Co. KGaA
2Before transaction costs of ~€50 million for the acquisitions of Akorn, Inc. and Merck KGaA’s biosimilars business
3Before expected expenditures for the further development of Merck KGaA’s biosimilars business of ~€50 million (expected closing H2/17)
Fresenius Helios
Fresenius Helios is Europe's leading private hospital operator. The company comprises HELIOS Kliniken in Germany and Quirónsalud in Spain. HELIOS Kliniken operates 112 hospitals, thereof 88 acute care clinics and 24 post-acute care clinics, and treats more than 5.2 million patients annually. Quirónsalud operates 44 hospitals, 43 outpatient centers and around 300 occupational risk prevention centers, and treats approximately 9.7 million patiens per year.


• 5% organic sales growth
• 60% EBIT increase (14% excluding Quirónsalud)
• 2017 outlook confirmed
Sales increased by 41% (organic growth: 5%) to €2,018 million (Q1/2016: €1,435 million). Acquisitions, mainly Quirónsalud, increased sales by 36%. Quirónsalud is consolidated since February 1, 2017. Sales of Quirónsalud were €490 million in February and March 2017.
Sales of HELIOS Kliniken2 increased by 6% (organic growth: 5%) to €1,528 million.
EBIT grew by 60% to €255 million (Q1/2016: €159 million). The EBIT margin increased to 12.6% (Q1/2016: 11.1%).
EBIT of HELIOS Kliniken2 increased by 14% to €181 million with a margin of 11.8% (Q1/2016: 11.1%). EBIT of Quirónsalud was €74 million with a margin of 15.1%.
Net income1 increased by 46% to €181 million (Q1/2016: €124 million).
1 Net income attributable to shareholders of Fresenius SE & Co. KGaA
2 HELIOS Kliniken Germany, excluding Quirónsalud
Operating cash flow increased by 179% to €184 million (Q1/2016: €66 million) driven by the first time consolidation of Quirónsalud and good operating results. The margin increased to 9.1% (Q1/2016: 4.6%).
Fresenius Helios confirms its outlook for 2017 and projects organic sales growth of 3% to 5%1 and sales of ~€8.6 billion (thereof Quirónsalud: ~€2.5 billion2). EBIT is expected to increase to €1,020 to €1,070 million (thereof Quirónsalud: €300 to 320 million2).
1 HELIOS Kliniken Germany, excluding Quirónsalud
2 Quirónsalud consolidated for 11 months
Fresenius Vamed
Fresenius Vamed manages projects and provides services for hospitals and other health care facilities worldwide. The portfolio ranges along the entire value chain: from project development, planning, and turnkey construction, via maintenance and technical management, to total operational management.


• 2% organic sales growth driven by service business
• Project business with strong order intake of €220 million
• 2017 outlook confirmed
Sales increased by 2% (organic growth: 2%) to €223 million (Q1/2016: €218 million). Sales in the project business decreased by 9% to €77 million (Q1/2016: €85 million). Sales in the service business grew by 10% to €146 million (Q1/2016: €133 million).
EBIT decreased by 14% to €6 million (Q1/2016: €7 million). The EBIT margin decreased to 2.7% (Q1/2016: 3.2%).
Net income1 decreased by 20% to €4 million (Q1/2016: €5 million).
Order intake reached a strong €220 million, could not quite match the previous year’s excellent level (Q1/2016: €237 million). As of March 31, 2017, order backlog grew to a record €2,104 million (December 31, 2016: €1,961 million).
Fresenius Vamed confirms its outlook for 2017 and expects both organic sales growth and EBIT growth in the range of 5% to 10%.
1 Net income attributable to shareholders of VAMED AG
Conference Call
As part of the publication of the results for the first quarter of 2017, a conference call for analysts and investors will be held on May 3, 2017 at 2 p.m. CEDT (8 a.m. EDT). You are cordially invited to follow the conference call in a live broadcast over the Internet at www.fresenius.com/media-calendar. Following the call, a replay will be available on our website.
For additional information on the performance indicators used please refer to our website https://www.fresenius.com/alternative-performance-measures.
This release contains forward-looking statements that are subject to various risks and uncertainties. Future results could differ materially from those described in these forward-looking statements due to certain factors, e.g. changes in business, economic and competitive conditions, regulatory reforms, results of clinical trials, foreign exchange rate fluctuations, uncertainties in litigation or investigative proceedings, and the availability of financing. Fresenius does not undertake any responsibility to update the forward-looking statements in this release.
Following Fresenius’ announcement to acquire Akorn, Inc. and Merck KGaA’s biosimilars business, the rating agencies Standard & Poor’s (BBB-, stable), Moody’s (Baa3, stable) and Fitch (BBB-, stable) confirm the corporate credit ratings of Fresenius to be unaffected.
Following Fresenius’ announcement to acquire Akorn, Inc. and Merck KGaA’s biosimilars business, the rating agencies Standard & Poor’s (BBB-, stable), Moody’s (Baa3, stable) and Fitch (BBB-, stable) confirm the corporate credit ratings of Fresenius to be unaffected.
Fitch Ratings has assigned Fresenius Finance Ireland’s €2,600 million notes issued to finance the acquisition of Quirónsalud an instrument rating of BBB-. It also affirmed Fresenius’ corporate credit rating at BBB-. The outlook is stable. The €2,600 million notes were drawn under the newly established Fresenius European Medium Term Note (EMTN) Program and issued by Fresenius Finance Ireland plc., a wholly owned subsidiary of Fresenius SE & Co. KGaA.
Fitch Ratings has assigned Fresenius Finance Ireland’s €2,600 million notes issued to finance the acquisition of Quirónsalud an instrument rating of BBB-. It also affirmed Fresenius’ corporate credit rating at BBB-. The outlook is stable. The €2,600 million notes were drawn under the newly established Fresenius European Medium Term Note (EMTN) Program and issued by Fresenius Finance Ireland plc., a wholly owned subsidiary of Fresenius SE & Co. KGaA.
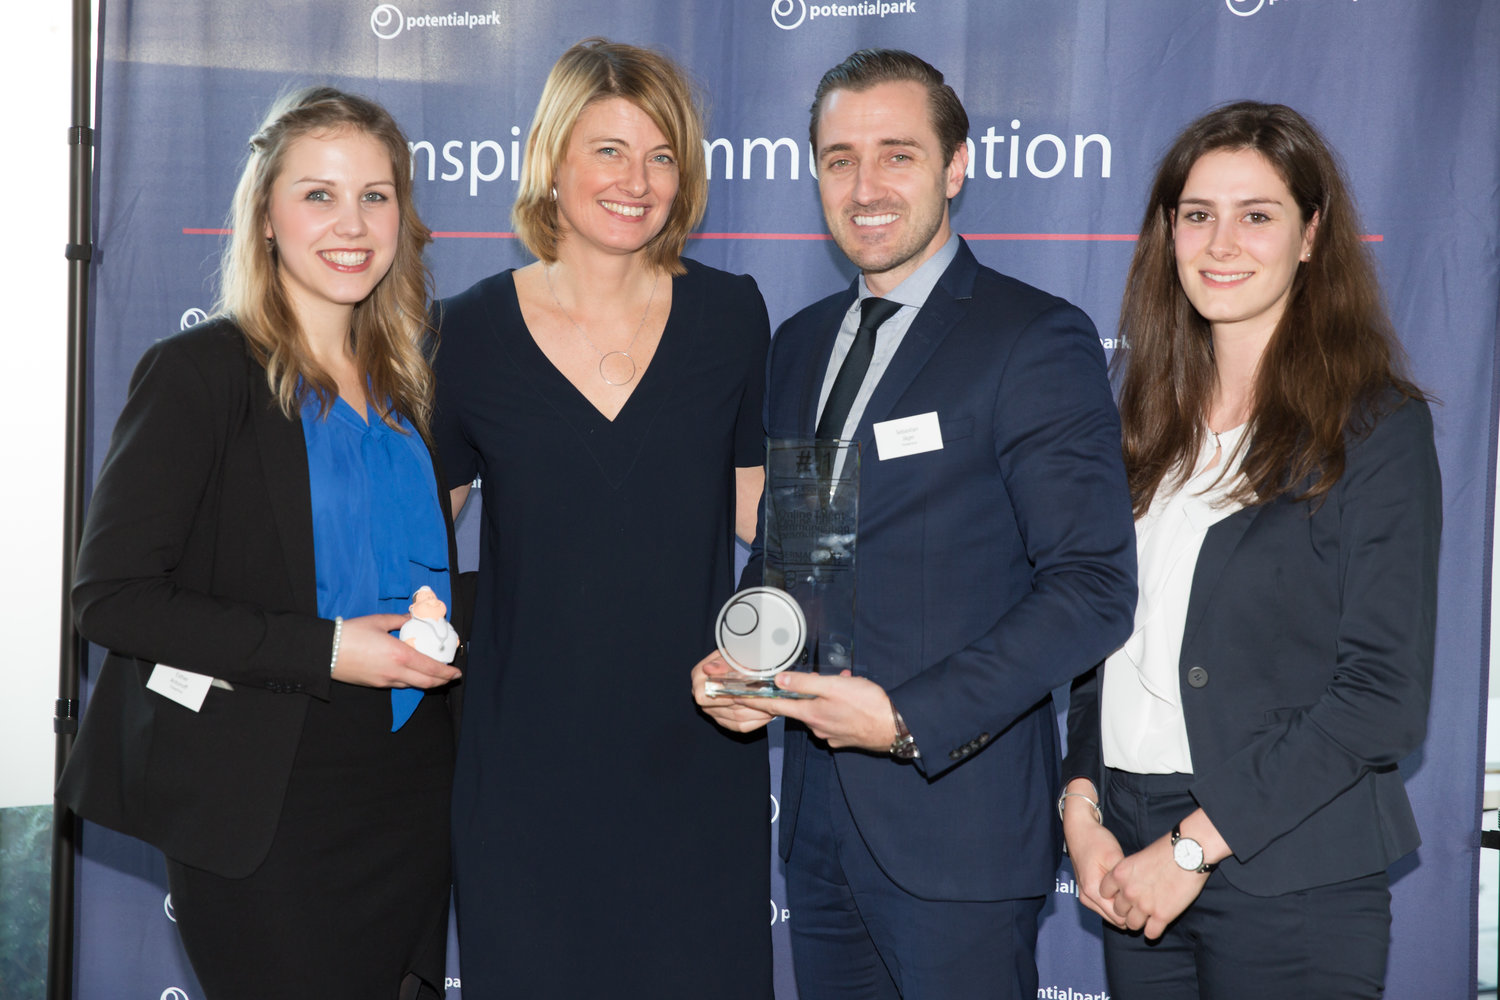
For the sixth straight time, the market research institute Potentialpark has honored the global healthcare group Fresenius as the German company with the best overall Internet offering for job applicants.
In its study for 2017, Potentialpark again put Fresenius in first place in the overall Online Talent Communication ranking. Fresenius won three of four individual categories – Career Website, Applying Online and Mobile – and finished second in the fourth category, Social Media.
Potentialpark has carried out a study of German companies’ Internet offerings for job applicants annually since 2002. For this year’s study, Potentialpark assessed the online activities of 147 German companies according to more than 300 criteria. Some 28,000 students and graduates around the world participated.
“Every honor or award motivates us to continually develop our offering for job applicants,” said Markus Olbert, Senior Vice President for Corporate Human Resources at Fresenius. “Our latest enhancement is the personalized ‘My Fresenius’ offering on the Fresenius Career website. Users receive personalized information such as the status of an application they’ve submitted, listings of job openings that fit their profile, and other relevant content. By doing this we’ve made the application process even more user friendly.”
If no timeframe is specified, information refers to fiscal year 2016.
Fiscal year 2016:
- Sales: €29.1 billion
(+5%, +6% in constant currency) - EBIT1: €4,327 million
(+9%, +10% in constant currency) - Net income1,2:€1,593 million
(+12%, +13% in constant currency) - Dividend proposal: +13% to €0.62 per share
Q4/2016:
- Sales: €7.7 billion
(+7%, +6% in constant currency) - EBIT1 €1,235 million
(+11%, +11% in constant currency) - Net income1,2 €439 million
(+6%, +7% in constant currency)
Group guidance 20173:
- Sales growth of 15% to 17% in constant currency
- Net income2 growth of 17% to 20% in constant currency
Targets 20203:
- Group sales4: between €43 billion and €47 billion
- Group net income2,4: between €2.4 billion and €2.7 billion
1 2015 before special items2 Net income attributable to shareholders of Fresenius SE & Co. KGaA3 Guidance according to IFRS; for a detailed overview of 2016 IFRS figures please see p. 14 of the pdf file4 At comparable exchange rates; includes small and mid-size acquisitions; at current IFRS-rules
Stephan Sturm, CEO of Fresenius, said: “Fresenius had another truly outstanding year in 2016, setting new sales and earnings records. All four business segments again developed very successfully. The company’s prospects are excellent, and in the coming years Fresenius is targeting continued, dynamic growth. We never forget that patients are at the center of everything we do. Providing them with high-quality yet affordable healthcare around the world is the key to our business success."
Positive Group guidance for 20171
For 2017, Fresenius projects sales growth of 15% to 17% in constant currency. Net income2 is expected to grow by 17% to 20% in constant currency.
The net debt/EBITDA3 ratio is expected to be within the bottom half of Fresenius’ self-imposed target range of 2.5 to 3.0 at the end of 2017.
New ambitious targets for 20201,4
For 2020, Group sales are expected to reach €43 billion to €47 billion. Calculated on the basis of reported 2016 IFRS sales (€29,471 million) and the mid-point of the target range (€45 billion), this corresponds to a compounded annual growth rate (CAGR) of 11.2%. Based on the very strong guidance for 2017, this would result in a 2018-2020 CAGR of 8.7%.5
Group net income2 is expected to increase to €2.4 billion to €2.7 billion. Calculated on the basis of reported 2016 IFRS net income (€1,560 million) and the mid-point of the target range (€2,550 million) this corresponds to a CAGR of 13.1%. Based on the very strong guidance for 2017, this would result in a 2018-2020 CAGR of 10.5%.6
24th consecutive dividend increase proposed
Based on the strong financial results, the Management Board will propose to the Supervisory Board a dividend increase of 13% to €0.62 per share (2015: €0.55). The expected total dividend distribution is €343 million.
1 Guidance according to IFRS; for a detailed overview of 2016 IFRS figures please see p. 14of the pdf file2 Net income attributable to shareholders of Fresenius SE & Co. KGaA3 Calculated at expected annual average exchange rates, for both net debt and EBITDA; without large unannounced acquisitions4 At comparable exchange rates; including small and mid-size acquisitions; at current IFRS rules5 Based on the mid-point of the 2017 sales guidance, adjusted for current exchange rates (~€35 bn), and the mid-point of the 2020 sales target range (€45 bn)6 Based on the mid-point of the 2017 net income guidance, adjusted for current exchange rates (~€1,890 m), and the mid-point of the 2020 net income target range (€2,550 m)
6% sales growth in constant currency
Group sales increased by 5% (6% in constant currency) to €29,083 million (2015: €27,626 million). Organic sales growth was 6%. Acquisitions contributed 1% and divestitures reduced sales by 1%. Slightly negative currency translation effects (1%) were mainly driven by the devaluation of Latin American currencies and the Chinese yuan against the Euro. In Q4/2016, Group sales increased by 7% (6% in constant currency) to €7,738 million (Q4/2015: €7,257 million). Organic sales growth was 5%. Acquisitions contributed 1%, while divestitures had no major impact on sales.
Group sales by region:

13% net income1,2 growth in constant currency
Group EBITDA2 increased by 8% (9% in constant currency) to €5,500 million (2015: €5,073 million). Group EBIT2 increased by 9% (10% in constant currency) to €4,327 million (2015: €3,958 million). The EBIT margin2 increased to 14.9% (2015: 14.3%).
In Q4/2016, Group EBIT2 increased by 11% (11% in constant currency) to €1,235 million (Q4/2015: €1,109 million), the EBIT margin2 improved to 16.0% (Q4/2015: 15.3%).
Group net interest decreased to -€582 million (2015: -€613 million), mainly due to favourable financing terms and interest savings on lower average debt. In Q4/2016, Group net interest increased to -€149 million (Q4/2015: -€137 million) mainly due to the bridge financing for the Quirónsalud acquisition.
The Group tax rate2 decreased to 28.1% (2015: 29.4%). The decrease is mainly due to released tax liabililities at Fresenius Medical Care in Q3/2016. In Q4/2016, the Group tax rate also decreased to 28.1% (Q4/2015: 28.8%).
Noncontrolling interest was €1,101 million (2015: €939 million), of which 96% was attributable to the noncontrolling interest in Fresenius Medical Care.
Group net income1,2 increased by 12% (13% in constant currency) to €1,593 million (2015: €1,423 million). Earnings per share1,2 increased by 12% (13% in constant currency) to €2.92 (2015: €2.61). In Q4/2016, Group net income1,2 increased by 6% (7% in constant currency) to €439 million (Q4/2015: €414 million). Earnings per share1,2 increased by 7% (8% in constant currency) to €0.81 (Q4/2015: €0.75).
Continued investment in growth
Spending on property, plant and equipment was €1,621 million (2015: €1,512 million), primarily for the modernization and expansion of dialysis clinics, production facilities and hospitals. This corresponds to 5.6% of sales.
Total acquisition spending increased to €926 million (2015: €517 million), mainly related to acquisitions at Fresenius Medical Care.
1 Net income attributable to shareholders of Fresenius SE & Co. KGaA2 2015 before special items
For a detailed overview of special items please see the reconciliation tables on pages 17-18 of the pdf file.
Excellent cash flow development
Operating cash flow increased by 7% to €3,574 million (2015: €3,327 million) with a margin of 12.3% (2015: 12.0%). The excellent cash flow was driven by a strong cash flow generation at Fresenius Medical Care and especially the record cash flow at Fresenius Kabi. Operating cash flow in Q4/2016 increased by 12% to €1,315 million (Q4/2015: €1,176 million) with a margin of 17.0% (Q4/2015: 16.2%).
Free cash flow before acquisitions and dividends increased by 6% to €1,971 million (2015: €1,865 million), with a margin of 6.8% (2015: 6.8%). Free cash flow after acquisitions and dividends was €748 million (2015: €1,194 million).
Solid balance sheet structure
The Group’s total assets increased by 8% (6% in constant currency) to €46,447 million (Dec. 31, 2015: €42,959 million), driven by its growing scale of operations. Current assets grew by 13% (11% in constant currency) to €11,799 million (Dec. 31, 2015: €10,479 million). Non-current assets increased by 7% (5% in constant currency) to €34,648 million (Dec. 31, 2015: € 32,480 million).
Total shareholders’ equity increased by 13% (11% in constant currency) to €20,420 million (Dec. 31, 2015: €18,003 million). The equity ratio increased to 44.0% (Dec. 31, 2015: 41.9%).
Group debt remained nearly unchanged (-2% in constant currency) at €14,780 million (Dec. 31, 2015: € 14,769 million). Group net debt decreased by 4% (-5% in constant currency) to € 13,201 million (Dec. 31, 2015: € 13,725 million). As of December 31, 2016, the net debt/EBITDA ratio was 2.341 (December 31, 2015: 2.682). EBITDA growth and net debt reduction made an about equal contribution to this substantial improvement of the ratio.
Increased number of employees
As of December 31, 2016, the number of employees increased by 5% to 232,873 (Dec. 31, 2015: 222,305).
1 At LTM average exchange rates for both net debt and EBITDA; pro forma acquisitions2 Before special items; at LTM average exchange rates for both net debt and EBITDA
For a detailed overview of special items please see the reconciliation tables on pages 17-18 of the pdf file.
Business Segments
Fresenius Medical Care
Fresenius Medical Care is the world's largest provider of products and services for individuals with renal diseases. As of December 31, 2016, Fresenius Medical Care was treating 308,471 patients in 3,624 dialysis clinics. Along with its core business, the company seeks to expand the range of medical services in the field of care coordination.

- 7% sales growth, 16% net income growth1,2
- Health Care services with positive growth momentum (sales +8%)
- 2017 outlook3: 8% to 10% sales growth in constant currency and 7 to 9% net income growth1,5 in constant currency expected
Sales increased by 7% (8% in constant currency) to US$17,911 million (2015: US$16,738 million). Organic sales growth was 7%. Acquisitions and divestitures increased sales by 1%. Currency translation effects reduced sales by 1%. In Q4/2016, sales increased by 8% (9% in constant currency) to US$4,687 million (Q4/2015: US$4,348 million).
Health Care services sales (dialysis services and care coordination) increased by 8% (9% in constant currency) to US$14,519 million (2015: US$13,392 million). Dialysis product sales increased by 1% (4% in constant currency) to US$3,392 million (2015: US$3,346 million).
In North America, sales increased by 9% to US$12,886 million (2015: US$11,813 million). Health Care services sales grew by 10% to US$11,982 million (2015: US$10,932 million). Dialysis product sales increased by 3% to US$904 million (2015: US$881 million).
1 Net income attributable to shareholders of Fresenius Medical Care AG & Co. KGaA2 2016 before acquisitions (US$ 15 million after tax), 2015 before settlement costs for an agreement in principle for GranuFlo® / NaturaLyte® case (- US$ 37 million after tax), and acquisitions (US$ 9 million after tax)3 Guidance according to IFRS and in Euro currency; for a detailed overview of 2016 IFRS figures please see p. 15 of the pdf file4 Based on 2016 sales of €16,570 million. The effects of the agreement with the U.S. Departments of Veterans Affairs and Justice are excluded.5 Based on 2016 net income of €1,144 million. The effects of the agreement with the U.S. Departments of Veterans Affairs and Justice are excluded.
Sales outside North America increased by 2% (7% in constant currency) to US$5,011 million (2015: US$4,897 million). Health Care services sales increased by 3% (9% in constant currency) to US$2,537 million (2015: US$2,459 million). Dialysis product sales increased by 2% (5% in constant currency) to US$2,474 million (2015: US$2,437 million).
EBIT increased by 13% (14% in constant currency) to US$2,638 million (2015: US$2,327 million). The EBIT margin was 14.7% (2015: 13.9%). Adjusted for one-time items1, EBIT increased by 10%. In Q4/2016, EBIT increased by 19% (19% in constant currency) to US$786 million (Q4/2015: US$662 million). The EBIT margin was 16.8% (Q4/2015: 15.2%).
Net income attributable to shareholders of Fresenius Medical Care AG & Co. KGaA excluding one-time items2 increased by 16% to US$1,228 million (2015: US$1,057 million). Net income5 including one-time items increased by 21% (21% in constant currency). Net income attributable to non-controlling interest increased by 8% to US$306 million. In Q4/2016, net income5 increased by 23% to US$388 million (2015: US$317 million).
Operating cash flow increased by 9% to US$2,140 million (2015: US$1,960 million), despite a discretionary cash contribution of US$100 million to Fresenius Medical Care’s pension plan assets in the United States in Q3/2016. The cash flow margin was 11.9% (2015: 11.7%). In Q4/2016, operating cash flow reached an excellent US$844 million (Q4/2015: US$548 million) with a margin of 18.0% (Q4/2015: 12.6%).
For 2017, Fresenius Medical Care expects sales to grow by 8% to 10%3,4 in constant currency. Net income attributable to shareholders of Fresenius Medical Care AG & Co. KGaA is expected to increase by 7% to 9%3,5,6 in constant currency in 2017. The effects of the agreement with the U.S. Departments of Veterans Affairs and Justice are excluded.
For further information, please see Fresenius Medical Care’s Investor News at www.freseniusmedicalcare.com.
1 2016 before acquisitions (US$39 million before tax), 2015 before settlement costs for an agreement in principle for GranuFlo® / NaturaLyte® case (- US$ 60 million before tax), and acquisitions (US$ 16 million before tax)2 2016 before acquisitions (US$ 15 million after tax), 2015 before settlement costs for an agreement in principle for GranuFlo® / NaturaLyte® case (- US$ 37 million after tax), and acquisitions (US$ 9 million after tax)3 Guidance according to IFRS and in Euro currency; for a detailed overview of 2016 IFRS figures please see p. 15 of the pdf file4 Based on 2016 sales of €16,570 million.5 Net income attributable to shareholders of Fresenius Medical Care AG & Co. KGaA6 Based on 2016 net income of €1,144 million.
Fresenius Kabi
Fresenius Kabi offers intravenously administered generic drugs, clinical nutrition and infusion therapies for seriously and chronically ill patients in the hospital and outpatient environments. The company is also a leading supplier of medical devices and transfusion technology products.

- 5% organic sales growth, 5% EBIT1 growth in constant currency
- Operating cash flow and cash flow margin at all-time high
- 2017 outlook3: 5% to 7% organic sales growth and 5% to 7% EBIT growth in constant currency expected
Sales increased by 1% (4% in constant currency) to €6,007 million (2015: €5,950 million). Organic sales growth was 5%. Divestitures reduced sales by 1%. Negative currency translation effects (-3%) were mainly related to the devaluation of Latin American currencies and the Chinese yuan against the Euro. In Q4/2016, sales increased by 2% (3% in constant currency) to €1,550 million (Q4/2015: €1,519 million). Organic sales growth was 3%.
Sales in Europe grew by 1% (organic growth: 3%) to €2,135 million (2015: €2,123 million). Divestments, including the sale of the German oncology compounding business in February 2015, reduced sales by 1%.
Sales in North America increased by 4% (organic growth: 3%) to €2,170 million (2015: €2,093 million), mainly driven by new product launches. Asia-Pacific sales decreased by 3% (organic growth: 8%) to €1,108 million (2015: €1,141 million) due to currency translation effects. With €594 million (2015: €593 million), sales in Latin America/Africa was on prior year level (organic growth: 14%).
EBIT1 increased by 3% (5% in constant currency) to €1,224 million (2015: €1,189 million). The EBIT margin1 improved to 20.4% (2015: 20.0%). In Q4/2016, EBIT1 decreased by 3% ( 1% in constant currency) to €308 million (Q4/2015: €317 million). The EBIT margin1 was 19.9% (Q4/2015: 20.9%).
Net income2 increased by 7% (9% in constant currency) to €716 million (2015: €669 million). In Q4/2016, net income2 decreased by 3% (-2% in constant currency) to €184 million (Q4/2015: €190 million).
Operating cash flow reached an all-time high of €991 million (2015: €913 million). The cash flow margin increased to 16.5% (2015: 15.3%). In Q4/2016, operating cash flow increased by 6% to €345 million (Q4/2015: €324 million) driven by excellent operating results, lower sequential inventory and a reduction of the Days Sales Outstanding (DSO). The margin reached an outstanding 22.3% (Q4/2015: 21.3%).
For 2017, Fresenius Kabi expects organic sales growth of 5% to 7%3 and EBIT growth in constant currency of 5% to 7%3.
1 2015 before special items2 Net income attributable to shareholders of Fresenius Kabi AG; 2015 before special items3 Guidance according to IFRS; for a detailed overview of 2016 IFRS figures please see p. 15 of the pdf fileFor a detailed overview of special items please see the reconciliation tables on pages 17-18 of the pdf file
Fresenius Helios
Fresenius Helios is Europe’s largest private hospital operator. In Germany, HELIOS operates 112 hospitals, thereof 88 acute care clinics (including seven maximum care hospitals in Berlin-Buch, Duisburg, Erfurt, Krefeld, Schwerin, Wiesbaden and Wuppertal) and 24 post-acute care clinics. Through Quirónsalud, Fresenius Helios operates 43 hospitals, 39 outpatient centers and around 300 Occupational Risk Prevention (ORP) centers in Spain.

- 4% organic sales growth, €682 million EBIT1
- Acquisition of Quirónsalud closed as of January 31, 2017
- 2017 outlook3: 3% to 5%4 organic sales growth, sales of ~€8.6 bn (thereof Quirónsalud €2.5 bn5) and EBIT of €1,020 to €1,070 million (thereof Quirónsalud €300 to €320 million5,6) expected
Sales increased by 5% to €5,843 million (2015: €5,578 million). Organic sales growth was 4%. Acquisitions contributed 1%. In Q4/2016, sales increased by 4% to €1,461 million (Q4/2015: €1,411 million), organic sales growth was 2%.
EBIT1 grew by 7% to €682 million (2015: €640 million). The EBIT margin1 increased to 11.7% (2015: 11.5%). In Q4/2016, EBIT1 increased by 4% to €175 million (Q4/2015: €168 million) with a margin1 of 12.0% (Q4/2015: 11.9%).
Net income2 increased by 12% to €543 million (2015: €483 million). In Q4/2016, net income2 increased by 8% to €141 million (Q4/2015: €131 million).
Operating cash flow increased by 1% to €622 million (2015: €618 million) with a margin of 10.6% (2015: 11.1%). In Q4/2016, operating cash flow reached a strong €185 million, but could not match the exceptional prior-year quarter (Q4/2015: €232 million). The same applies to the cash flow margin of 12.7% (Q4/2015: 16.4%).
For 2017, Fresenius Helios expects organic sales growth of 3% to 5%3,4 and sales of ~€8.6 bn3 (thereof Quirónsalud ~€2.5 bn5). EBIT is expected to increase to €1,020 to €1,070 million3 (thereof Quirónsalud €300 to €320 million5,6).
1 2015 before special items2 Net income attributable to shareholders of HELIOS Kliniken GmbH; before special items3 Guidance according to IFRS; for a detailed overview of 2016 IFRS figures please see p. 15 of the pdf file4 Helios Kliniken Germany, excluding Quirónsalud5 Quirónsalud consolidated for 11 months6 EBITDA of €480 to €500 million, Amortization of €80 million and depreciation of €100 million
For a detailed overview of special items please see the reconciliation tables on pages 17-18 of the pdf file.
Fresenius Vamed
Fresenius Vamed manages projects and provides services for hospitals and other health care facilities worldwide. The portfolio ranges along the entire value chain: from project development, planning, and turnkey construction, via maintenance and technical management, to total operational management.

- 5% organic sales growth, 8% EBIT growth
- Order intake of €1,017 million at all-time high
- 2017 outlook1: 5% to 10% organic sales growth and 5% to 10% EBIT growth expected
Sales increased by 4% (4% in constant currency) to €1,160 million (2015: €1,118 million). Organic sales growth was 5%. Sales in the project business increased by 3% to €594 million (2015: €575 million). Sales in the service business grew by 4% to €566 million (2015: €543 million). In Q4/2016, sales increased to €420 million (Q4/2015: €387 million). Organic sales growth was 10%.
EBIT grew by 8% to €69 million (2015: €64 million). The EBIT margin increased to 5.9% (2015: 5.7%). In Q4/2016, EBIT increased by 12% to €38 million (Q4/2015: €34 million). The EBIT margin increased to 9.0%.
Net income2 grew by 2% to €45 million (2015: €44 million). In Q4/2016, net income2 remained unchanged at €24 million (Q4/2015: €24 million).
Order intake increased to €1,017 million (2015: €904 million), reaching an all-time high. As of December 31, 2016, order backlog was €1,961 million (Dec. 31, 2015: €1,650 million).
For 2017, Fresenius Vamed expects organic sales growth in the range of 5% to 10%1 and EBIT growth of 5% to 10%1.
1 Guidance according to IFRS; for a detailed overview of 2016 IFRS figures please see p. 15 of the pdf file2 Net income attributable to shareholders of VAMED AG
Conference Call
As part of the publication of the results for fiscal year 2016, a conference call will be held on February 22, 2017 at 2 p.m. CET (8 a.m. EST). All investors are cordially invited to follow the conference call in a live broadcast over the Internet at www.fresenius.com/investors. Following the call, a replay will be available on our website.
This release contains forward-looking statements that are subject to various risks and uncertainties. Future results could differ materially from those described in these forward-looking statements due to certain factors, e.g. changes in business, economic and competitive conditions, regulatory reforms, results of clinical trials, foreign exchange rate fluctuations, uncertainties in litigation or investigative proceedings, and the availability of financing. Fresenius does not undertake any responsibility to update the forward-looking statements in this release.