
February 21, 2024
Fresenius closes 2023 with a strong fourth quarter and expects accelerated earnings growth in 2024 through increasing momentum from #FutureFresenius


- Fresenius achieves the raised outlook for FY/23. Strong final quarter with continued good development of the Operating Companies Fresenius Kabi and Fresenius Helios and progress in the turnaround of the Investment Company Fresenius Vamed.
- Group 2024 outlook: Organic revenue growth expected between 3% and 6%; EBIT expected to grow between 4% and 8%.
- Leverage ratio declines: expected to be within the self-defined target corridor of 3.0x to 3.5x by the end of 2024.
- Revenue of €22.3 billion in FY/23: Strong organic Group revenue growth of 6%; Group EBIT increased 2% in constant currency to €2.3 billion; excellent Group operating cash flow totaled €2.1 billion.
- Group cost savings target for 2023 with ~40 % significantly exceeded – FY/25 structural productivity savings target raised to ~€400 million at EBIT level (before: ~€350 million).
- Group revenue increased organically by 5% in Q4; Group EBIT increased by 8% in constant currency.
- Fresenius Kabi with excellent organic revenue growth of 7% in Q4 at top-end of structural growth band and EBIT margin of 14.1% within structural band.
- Fresenius Helios with strong organic revenue growth of 5% in Q4 at top-end of structural growth band and excellent EBIT margin of 11.6 % well above structural margin band.
- Fresenius Vamed’s transformation progressing well; ongoing operational improvement with positive EBIT second consecutive quarter.
- Deconsolidation of Fresenius Medical Care together with many structural improvements in the context of #FutureFresenius implemented in 2023; one-off, non-cash special effects reported in 2023.
If no timeframe is specified, information refers to Q4/2023.
Michael Sen, CEO of Fresenius: “We took decisive actions in fiscal year 2023 and put Fresenius back on track. #FutureFresenius is driving improvements throughout the company and creating value. We added focus, simplified the structure, and delivered better financial performance. We will build on that momentum to further grow our businesses and accelerate earnings growth driven by the Operating Companies Fresenius Kabi and Fresenius Helios. Fresenius is uniquely positioned to address the rising demand for healthcare leveraging innovations also in digitalization and AI. We are deepening our purpose of Advancing Patient Care.”
An overview of the results for Q4/2023 and the 2023 financial year – before and after special items – is available on our website.
Following the deconsolidation of Fresenius Medical Care Group financial figures have been presented in accordance with IAS 28 (at equity method) since December 1, 2023. Prior-year figures have been adjusted due to the application of IFRS 5 to the deconsolidated operations of Fresenius Medical Care.
Information on the performance indicators are available on our website at https://www.fresenius.com/alternative-performance-measures.
Conference call and video webcast
As part of the publication of the results for FY/23, a press conference will be held on February 21, 2024 at 10:00 a.m. CET. You are cordially invited to follow the press conference in a live online broadcast at https://www.fresenius.com/calendar. Following the conference, a recording will be available on our website.
Consolidated results for FY/23 as well as for FY/22 in-clude special items. These concern: revaluations of biosimilars contingent purchase price liabilities, expenses associated with the Fresenius cost and efficiency program, impacts related to the war in Ukraine, transaction costs for mAbxience and Ivenix, hyperinflation in Turkey, retroactive duties, costs in relation to the change of legal form of Fresenius Medical Care, the transformation of Fresenius Vamed, legacy portfolio adjustment, effects from the valuation of the investment in Fresenius Medical Care in ac-cordance with IFRS 5, and expenses PPA equity method Fresenius Medical Care. The special items shown within the reconciliation tables are reported in the Corporate/Other segment.
2024 Strategic priorities
After a year of significant structural progression in the Group and improved operating performance, Fresenius’ priorities in 2024 will focus on financial progression. This includes driving down leverage, execute on raised cost savings target and a rigorous focus on capital efficiency and returns. This bundle of measures is expected to translate into accelerated earnings growth in 2024 and beyond.
Fresenius is uniquely positioned to benefit from the mega trends of the healthcare sector, including growing and ageing populations, and digitalization. With its leading position in the European private hospital market and at a vast number of ambulatory clinics, the company has direct access to about 26 million patients. In addition, innovative MedTech devices and an integrated end-to-end Biopharma platform enable crucial therapies for the future. These strong platforms form a highly robust, earnings-enhancing business model in attractive growth areas.
Group business development
Group revenue remained nearly unchanged (4% increase in constant currency) at €5,678 million (Q4/22: €5,670 million). Organic growth was 5% driven by an ongoing strong performance of our Operating Companies. Divestitures reduced revenue growth by 1%. Currency translation had a negative effect of 4% on revenue growth. In FY/23, Group revenue increased by 4% (6% in constant currency) to €22,299 million (FY/22: €21,532 million). Organic growth was 6%. Currency translation decreased revenue growth by 2%.
In Q4/23, the revenue of the Operating Companies increased by 2% (7% in constant currency) to €5,165 million (Q4/22: €5,047 million). In FY/23, revenue of the Operating Companies increased by 4% (7% in constant currency) to €20,255 million (FY/22: €19,494 million).
Group EBITDA before special items increased by 6% (4% in constant currency) to €942 million (Q4/221: €890 million). In FY/23, Group EBITDA before special items increased by 3% (3% in constant currency) to €3,422 million (FY/221: €3,315 million).
Group EBIT before special items increased by 13% (8% in constant currency) to €634 million (Q4/221: €559 million) mainly driven by the good earnings development at the Operating Companies and the progress of the operational turnaround at Fresenius Vamed. The EBIT margin before special items was 11.2% (Q4/221: 9.9%). Reported Group EBIT was €85 million (Q4/22: €337 million). In FY/23 Group EBIT before special items increased by 3% (2% in constant currency) at €2,262 million (20221: €2,190 million). The EBIT margin before special items was 10.1% (20221: 10.2%). Reported Group EBIT was €1,143 million (2022: €1,812 million).
The Operating Companies showed an 8% increase of EBIT before special items (2% in constant currency) to €613 million (Q4/221: € 568 million) with an EBIT margin of 11.9% (Q4/221: 11.3%). In FY/23, the EBIT before special items of the Operating Companies increased by 5% (4% in constant currency) to €2,278 million (FY/221: €2,170 million) with an EBIT margin of 11.2% (FY/221: 11.1%).
Group net interest before special items increased to -€118 million (Q4/221: -€80 million) mainly due to financing activities in a higher interest rate environment. In FY/23, Group net interest before special items increased to -€418 million (20221: -€241 million).
Group tax rate before special items was 36.4% (Q4/221: 23.2%). The higher tax rate in Q4/23 is mainly due to the closing of tax audit procedures as well as a valuation adjustment of a deferred tax asset in Germany. In FY/23, the Group tax rate before special items was 28.3% (20221: 22.4%).
1 Before special items
For a detailed overview of special items please see the reconciliation tables at Financial Results | FSE (fresenius.com)
Net income1 from deconsolidated Fresenius Medical Care operations before special items remained unchanged (4% increase in constant currency) at €83 million (Q4/222: €83 million). In FY/23 net income1 from deconsolidated Fresenius Medical Care operations before special items decreased by 18% (-16% in constant currency) to €243 million (20222: €295 million).
Group net income1 before special items decreased by 11% (-17% in constant currency) to €397 million (Q4/222: €445 million). The decrease was mainly driven by rising interest expenses and a higher tax rate. Reported Group net income1 decreased to -€614 million (Q4/22: €255 million) and mainly results from the valuation effect of Fresenius Medical Care in accordance with IFRS 5 in the amount of €521 million (see “Deconsolidation of Fresenius Medical Care”). The effect has no cash impact. Furthermore, legacy portfolio adjustments and expenses for the cost and efficiency program, and the Vamed transformation had a negative impact on the Group net income income1. Group net income1 before special items excluding Medical Care decreased by 13% (-22% in constant currency) to €314 million (Q4/222: €362 million).
In FY/23, Group net income1 before special items decreased by 13% (-14% in constant currency) to €1,505 million (20222: €1,729 million). The decrease was driven by rising interest costs and a higher tax rate. Reported Group net income1 decreased to -€594 million (2022: €1,372 million) and was negative mainly due to the Fresenius Medical Care’s valuation effects according to IFRS 5 of €1,115 million (see chapter “Deconsolidation of Fresenius Medical Care” on page 11). These effects have no cash impact. Furthermore, expenses in connection with the Vamed transformation, legacy portfolio adjustments as well as expenses for the cost and efficiency program had a negative impact on the Group net income1. Group net income1 before special items excluding Medical Care decreased by 12% (-14% in constant currency) to €1,262 million (20222: €1,434 million).
1 Net income attributable to shareholders of Fresenius SE & Co. KGaA
2 Before special items
Earnings per share1 before special items decreased by 11% (-17% in constant currency) to €0.70 (Q4/222: €0.79). Reported earnings per share1 were -€1.09 (Q4/22: €0.45). In FY/23, earnings per share1 before special items decreased by 13% (-15% in constant currency) to €2.67 (FY/222: €3.08). Reported earnings per share1 were -€1.05 (FY/22: €2.44).
Group operating cash flow increased by 4% to €1,272 million (Q4/22: €1,225 million) mainly driven by the strong cash flow development across the Group. Group operating cash flow margin was 22.4% (Q4/22: 21.6%). Free cash flow before acquisitions, dividends and lease liabilities increased to €888 million (Q4/22: €822 million). Free cash flow after acquisitions, dividends and lease liabilities increased to €814 million (Q4/22: €742 million).
In FY/23, Group operating cash flow increased by 5% to €2,131 million (FY/22: €2,031 million) with a margin of 9.6% (2022: 9.4%). Free cash flow before acquisitions, dividends and lease liabilities increased to €1,024 million
(FY/22: €942 million). Free cash flow after acquisitions, dividends and lease liabilities improved to €115 million (FY/22: -€317 million).
Fresenius Kabi’s operating cash flow increased by 46% to €434 million (Q4/22: €298 million) with a margin of 21.7% (Q4/22: 14.6%) mainly driven mainly driven by an improved working capital management. In FY/23, operating cash flow increased by 21% to €1,015 million (2022: €841 million) with a margin of 12.7% (FY/22: 10.7%).
Fresenius Helios’ operating cash flow decreased by 9% to €867 million (Q4/22: €956 million) mainly due to phasing effects of receivables in Spain and the very strong cash flow in the prior year. The operating cash flow margin was 27.2% (Q4/22: 31.5%). In FY/23, operating cash flow decreased by 9% to €1.244 million (FY/22: €1.367 million) with a margin of 10.1% (FY/22: 11.7%).
Fresenius Vamed’s operating cash flow increased to €36 million (Q4/22: €12 million) with a margin of 6.1% (Q4/22: 1.7%) due to positive phasing effects. In FY/23, operating cash flow improved to €20 million (2022: -€44 million) with a margin of 0.8% (2022: -1.9%).
1 Net income attributable to shareholders of Fresenius SE & Co. KGaA
2 Before special items
The cash conversion rate (CCR), which is defined as the ratio of adjusted free cash flow1 to EBIT before special items was 1.0 in FY/23 (2022: 0.9). This positive development is due to the increased cash flow focus across the Group including inventory management, working capital management and cash collection.
Group debt increased by 8% (8% in constant currency) to €15,830 million
(Dec. 31, 20222: € 14,708 million). Group net debt remained broadly flat at € 13,268 million (Dec. 31, 20222: € 13,307 million). In constant currency, Group net debt decreased by 1%.
As of December 31, 2023, the net debt/EBITDA ratio was 3.76x3,4 (Dec. 31, 2022: 3.80x2,3,4). This is a strong 27 bps reduction compared to Q3/23 (4,03x3,4) and is mainly driven by the good cash flow development in Q4/23.
Fresenius expects the net debt/EBITDA5 ratio to be within the self-imposed corridor of 3.0 to 3.5x by the end of 2024. This is expected to be driven by reducing net debt and by the operational performance at the Operating Companies.
This assumption does not include further potential divestment activities, however, includes the fact that due to legal restrictions as a result of the use of government compensation and reimbursement payments for increased energy costs provided for in the Hospital Financing Act, however, Fresenius will not propose to the 2024 Annual General Meeting to distribute a dividend for the 2023 fiscal year. Irrespective of the legally required suspension of dividend payments for the 2023 fiscal year, Fresenius will maintain its progressive dividend policy in the future and continues to aim to increase the dividend in line with growth in earnings per share (in constant currency, before special items), or at least maintain the dividend at the previous year's level.
1 Cash flow before acquisitions and dividends; before interest, tax, and special items
2 Proforma deconsolidation Fresenius Medical Care
3 At average exchange rates for both net debt and EBITDA; pro forma closed acquisitions/divestitures, including lease liabilities, including Fresenius Medical Care dividend
4 Before special items
5 At average exchange rates for both net debt and EBITDA; pro forma closed acquisitions/divestitures; excluding further potential acquisitions/divestitures; before special items; including lease liabilities, including Fresenius Medical Care dividend
ROIC was 5.2% in FY/23 (FY/22: 5.6%) mainly due to the higher tax rate. The Operating Companies showed a ROIC of 5.6%.
Structural productivity targets significantly exceeded – 2025 target raised
The groupwide cost savings program progressed well ahead of plan. Within the program, Fresenius realized ~€280 million of structural cost savings at EBIT level in FY/23. With that, the originally anticipated saving of ~€200 million for FY/23 was significantly exceeded. In the same period, one-time costs of ~€220 million were incurred to achieve these savings.
Due to the excellent progress of the measures implemented across the entire Group, Fresenius raises its target for the second time. Fresenius now expects to achieve annual sustainable cost savings of ~€400 million at EBIT level by 2025 (before: ~€350 million). To reach this new target, one-time costs between ~€80 and €100 million are anticipated between 2024 and 2025. For 2024, total cost savings of ~€330 to €350 million are expected. This corresponds to incremental cost savings of ~€50 to €70 million compared to 2023.
The targeted programs involve all business segments and the Corporate Center. Key elements include measures to optimize procurement, processes, sales and administrative costs, as well as fostering digitalization.
Operating Company Fresenius Kabi
Revenue decreased by 2% (increased 9 % in constant currency) to €1,996 million (Q4/22: €2,036 million) mainly driven by negative currency translation effects relating to the US dollar and the hyperinflation in Argentina. Organic growth was 7% . This strong performance was mainly driven by the strong business development of all Growth Vectors. In FY/23, revenue increased by 2% (9% in constant currency) to €8,009 million (2022: €7,850 million). Organic growth was 7%1.
1 To show the underlying business development, the organic growth definition was adjusted to fully exclude the significant inflation accounting effects in Argentina. According to the previous methodology, organic growth for Fresenius Kabi would have been Q1: 7%, Q2: 8%, Q3:7%, Q4: 14% and FY/23: 9%
Revenue of the Growth Vectors (MedTech, Nutrition and Biopharma) decreased by 3% to €997 million (Q4/22: €1,026 million) driven by negative currency exchange effects (increased 14% in constant currency). Organic growth was outstanding at 11%. In Nutrition, organic growth of 6% was driven by the good development in the US and Latin America whereas China was impacted by indirect effects of the government’s countrywide anti-corruption campaign. Biopharma showed very strong organic growth of 66% driven by successful product launches in Europe and the US, as well as licensing agreements. MedTech had excellent organic growth of 8% driven by a broad-based positive development across most regions and many product groups. In FY/23, the revenue of the Growth Vectors increased by 4% (14% in constant currency; organic growth: 10%) to €4,177 million (FY/22: €4,005 million).
Revenue in the Pharma (IV Drugs & Fluids) business decreased by 1% (increased 3% in constant currency; organic growth: 3%) and amounted to €1,000 million (Q4/22: €1,010 million). The solid organic growth was mainly driven by a positive development across many regions. In FY/23, revenue in the Pharma business remained broadly stable (increased 3% in constant currency; organic growth: 3%) and amounted to €3,832 million (2022: €3,845 million).
EBIT1 of Fresenius Kabi increased by 19% (6% in constant currency) to €282 million (Q4/22: €236 million) due to the good revenue development and the well-progressing cost saving initiatives. EBIT margin1 was 14.1% (Q4/22: 11.6%) and thus within the structural EBIT margin band. In FY/23, EBIT1 increased by 6% (constant currency: 3%) to €1,145 million (FY/22: €1,080 million). EBIT margin1 was 14.3% (FY/22: 13.8%).
EBIT1 of the Growth Vectors increased by 69% (constant currency: 12%) to €102 million (Q4/22: €60 million) due to the excellent revenue development and the very well-progressing cost saving initiatives. EBIT1 margin was 10.2% (Q4/22: 5.9%). In FY/23, EBIT1 of the Growth Vectors increased by 15% (constant currency: 6%) to €390 million (FY/22: €339 million) with a margin1 of 9.3% (FY/22: 8.5%).
EBIT1 in the Pharma business remained nearly stable (increased 2% in constant currency) to €189 million (Q4/22: €190 million) due to the very well-progressing cost saving initiatives. EBIT1 margin was 18.9% (Q4/22: 18.8%). In FY/23, EBIT1 in the Pharma business increased by 3% (constant currency: 6%) to €792 million (FY/22: €769 million) with a margin of 20.7% (FY/22: 20.0%).
1 Before special items
Operating Company Fresenius Helios
Revenue increased by 5% (5% in constant currency) to €3,188 million (Q4/23: €3,031 million) Organic growth was 5%. In FY/23, revenue increased by 5% (5% in constant currency) to €12,320 million (FY/22: €11,716 million). Organic growth was 5%.
Revenue of Helios Germany increased by 5% (organic growth: 5%) to €1,828 million (Q4/22: €1,749 million), mainly driven by solid admissions numbers. In FY/23, revenue of Helios Germany increased by 4% (organic growth: 4%) to €7,279 million (FY/22: €7,021 million).
Revenue of Helios Spain increased despite the already strong prior year quarter by 6% (5% in constant currency) to €1,289 million (Q4/22: €1,214 million) driven by ongoing strong activity levels. The clinics in Latin America also showed a good performance. Organic growth was 5%. In FY/23, revenue of Helios Spain increased by 7% (8% in constant currency, organic growth: 8%) to €4,770 million (FY/22: €4,441 million).
Revenue of Helios Fertility increased by 8% (17% in constant currency) to €71 million (Q4/22: €66 million) driven by favorable price and mix effects as well as the positive development of activity levels, especially in the US. Organic growth was 22%. In FY/23, revenue of Helios Fertility increased by 8% (14% in constant currency) to €269 million (FY/22: €250 million).
EBIT1 of Fresenius Helios increased by 5% (5% in constant currency) to €371 million (Q4/22: €354 million) with an EBIT margin1 of 11.6% (Q4/22: 11.7%). In FY/23, EBIT1 increased by 4% (increased 4% in constant currency) to €1,232 million (2022: €1,185 million) with an EBIT margin1 of 10.0% (2022: 10.1%).
EBIT1 of Helios Germany decreased by 6% to €164 million (Q4/22: €174 million) with an EBIT margin1 of 9.0% (Q4/22: 9.9%) in particular due to the high prior-year basis. The prior-year quarter was not affected by any major negative inflation effects, which, however, had a significant negative impact on Q4/23. This could not be fully compensated despite the good revenue development as well as the progressing cost savings program and the Government compensation for higher energy costs. In FY/23, EBIT1 of Helios Germany increased by 1% to €630 million (2022: €623 million) with an EBIT margin1 at 8.7% (2022: 8.9%).
EBIT1 of Helios Spain increased by 9% due to the strong revenue development as well as the progressing cost savings program (8% in constant currency) to €188 million (Q4/22: €172 million). The EBIT margin1 was 14.6% (Q4/22: 14.2%). In FY/23, EBIT1 of Helios Spain increased by 4% (5% in constant currency) to €580 million (2022: €556 million). The EBIT margin1 was 12.2% (2022: 12.5%).
EBIT1 of Helios Fertility was €10 million (Q4/22: €6 million) with an EBIT margin1 of 14.1% (Q4/22: 9.1%). In FY/23, EBIT1 of Helios Fertility was €26 million (2FY/22: €21 million) with an EBIT margin1 of 9.7% (FY/22: 8.4%).
1 Before special items
Deconsolidation of Fresenius Medical Care successfully completed
Fresenius successfully completed the deconsolidation of Fresenius Medical Care. This was a historic step and a landmark on the way forward to #FutureFresenius. The complexity of the Group structure was significantly reduced, and the governance structure were simplified, enabling more targeted, faster, and agile decisions at both, Fresenius and Fresenius Medical Care. Fresenius remains the largest shareholder of Fresenius Medical Care with an unchanged 32% stake.
The change in legal form took effect on November 30, 2023. Fresenius Medical Care now operates as Fresenius Medical Care AG. As a result of the deconsolidation, the investment in Fresenius Medical Care is now classified in accordance with IAS 28 (at equity method).
As part of the subsequent IFRS 5 remeasurements as of September 30, 2023 and November 30, 2023, a non-cash special item of €1,115 million attributable to the shareholders of Fresenius SE & Co. KGaA was recognized in the consolidated financial statements of Fresenius as of December 31, 2023.
Going forward, the proportionate share of 32% of Fresenius Medical Care will be presented as a separate line in Fresenius Group’s P&L and balance sheet. Dividends received from Fresenius Medical Care will also be reported as a separate line as part of the cash flow statement.
IAS 28 requires a full purchase price allocation (PPA) from the date on which the investment in Fresenius Medical Care was recognized as an associated company. The accounting for the PPA will be treated as special item.
For reasons of simplification and comparability, Fresenius will present net income with and without the equity result in the future.
Transformation Fresenius Vamed progressing well
Further good progress was made in Q4/23 with the far-reaching restructuring program toincrease Fresenius Vamed’s profitability which was initiated during 2023. After €10 million in Q3/23, Fresenius Vamed has for the second consecutive quarter shown a positive EBIT1 with €21 million in Q4/23 (FY/23: -€16 million). The EBIT margin1 in Q4/23 was 3.5% and -0.7% in 2023 (20221: 0.8%).
Revenue from continued business was €589 million in Q4/23. Organic growth of the continued business declined by 5 % mainly due to some contract timing issues as well as more rigorous vetting in the Project Business. In 2023, revenue from continued businesses was €2,201 million.
1 Before special items
Total revenue of Fresenius Vamed amounted to €595 million (Q4 2022: €712 million) and declined by 16% (-17% in constant currency). The decline is primarily related to discontinued businesses as part of the transformation and the associated adjustments and postponements in the Project business. In 2023, total revenue of Fresenius Vamed remained flat at €2,356 million (2022: €2,359 million).
The ongoing transformation resulted in negative special items of €113 million in Q4/23 mainly related to cessation of activities, asset re-evaluations and restructuring costs resulting in write-downs and provisions. The negative special items were predominantly booked as non-cash items. In 2023, a total of negative special items of €554 million were incurred.
The positive development is expected to continue in 2024. Fresenius Vamed reiterates its targets and expects to reach the structural EBIT margin band of 4% to 6% by 2025 as set out in the #FutureFresenius Financial Framework.
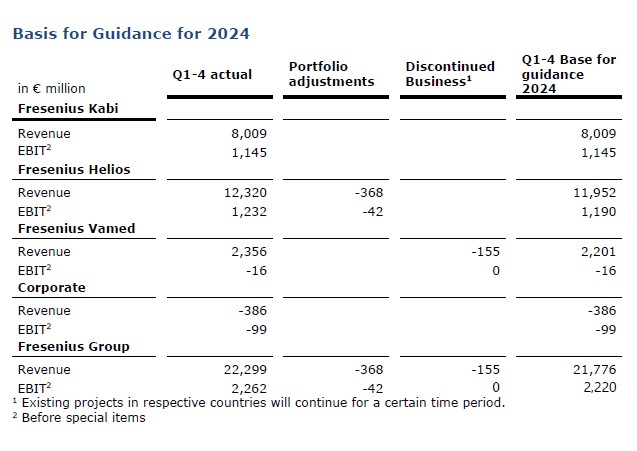
Group and segment outlook for 20241
Fresenius expects general cost inflation to continue at a slightly lower level in the 2024 financial year and the current geopolitical tensions to persist. Fresenius also expects interest rates to remain at a similar level to 2023. Irrespective of this, the Management Board considers the business outlook for the Group to be positive and expects a successful financial year 2024.
For 2024, Group organic revenue is expected to grow between 3% to 6%. Group constant currency EBIT2 is expected to grow in the rage of 4% to 8%.
Fresenius Kabi expects organic revenue growth in a mid-single-digit percentage range in 2024. The EBIT margin2 is expected to be around 15% (structural margin band: 14% to 17%). Fresenius Helios expects organic revenue to grow in a low to mid-single digit percentage range in 2024. The EBIT margin2 is expected to be within the structural margin band of 9% to 11%. Fresenius Vamed expects organic revenue to grow (Continued Business) in a mid-single-digit percentage range in 2024. The EBIT margin2 is expected to be 1 to 2 below the structural margin band of 4% to 6%.
1 For the prior-year basis please see table “Basis for Guidance for 2024”
2 Before special items
This release contains forward-looking statements that are subject to various risks and uncertainties. Future results could differ materially from those described in these forward-looking statements due to certain factors, e.g. changes in business, economic and competitive conditions, regulatory reforms, results of clinical trials, foreign exchange rate fluctuations, uncertainties in litigation or investigative proceedings, the availability of financing and unforeseen impacts of international conflicts. Fresenius does not undertake any responsibility to update the forward-looking statements in this release.