
May 4, 2022
Fresenius with solid start to 2022 despite macroeconomic challenges
• Fresenius Medical Care in line with its expectations countering significant headwinds
• Fresenius Kabi’s solid financial performance based on strong Emerging Markets growth
• Fresenius Helios’ strong performance driven by growing admissions in Germany and Spain
• Fresenius Vamed with continued progress towards normal operations, very good performance in the service business
• Ongoing headwinds from cost inflation and supply chain challenges, with uncertainty and volatility fueled by the Ukraine war
• Guidance for 2022 confirmed
• Fresenius appoints Sara Hennicken as Chief Financial Officer – Rachel Empey to leave company at own request1
• Dr. Carla Kriwet to succeed Rice Powell on January 1, 2023, as Chief Executive Officer of Fresenius Medical Care and member of the Fresenius Management Board1
1 Please see separate Fresenius and Fresenius Medical Care press releases
2 Before special items
3 Net income attributable to shareholders of Fresenius SE & Co. KGaA
For a detailed overview of special items please see the reconciliation tables on pages 18-19 in the PDF.
Stephan Sturm, CEO of Fresenius, said: “We have made a solid start into 2022 – somewhat better, even, than expected at Fresenius Helios and Fresenius Kabi. The first quarter was burdened by the ongoing coronavirus pandemic, the war in Ukraine, supply chain bottlenecks and, above all, cost increases that are in some cases significant. We will have to watch all these factors very closely. Still, our businesses developed well. With the announced transactions at Fresenius Kabi and Fresenius Medical Care we’ve taken important steps in the realization of our growth strategy, thereby improving the foundations for our future business success. We therefore continue to expect overall healthy sales and earnings growth, and to look ahead with confidence to the rest of our business year and beyond.”
FY/22 Group guidance confirmed
For FY/22, Fresenius confirms its guidance and projects sales growth1 in a mid-single-digit percentage range in constant currency. Net income2,3 is expected to grow in a low-single-digit percentage range in constant currency. Implicitly, net income2 for the Group excluding Fresenius Medical Care is also expected to grow in a low-single-digit percentage range in constant currency.
Without further acquisitions4, Fresenius projects an improvement of the net debt/EBITDA5 ratio (December 31, 2021: 3.51x6) into the self-imposed target corridor of 3.0x to 3.5x by the end of 2022. Fresenius expects the net debt/EBITDA ratio to slightly increase once the acquisitions of Ivenix and the majority stake in mAbxience are closed.
The Group’s cost and efficiency program is evolving according to plan and Fresenius confirms its increased savings targets provided in February 2022 of at least €150 million p.a. after tax and minority interest in 2023. For the years thereafter, a further significant increase in sustainable cost savings is expected.
1 FY/21 base: €37,520 million
2 Net income attributable to shareholders of Fresenius SE & Co. KGaA
3 FY/21 base: €1,867 million; before special items; FY/22: before special items
4 Cut-off date 22 February 2022
5 At LTM average exchange rates for both net debt and EBITDA; pro forma closed acquisitions/divestitures;
excluding further potential acquisitions; before special items; including lease liabilities
6 At LTM average exchange rates for both net debt and EBITDA; pro forma closed acquisitions/divestitures;
before special items; including lease liabilities
For a detailed overview of special items please see the reconciliation tables on pages 18-19 in the PDF.
Assumptions for guidance FY/22
COVID-19 will continue to impact Fresenius’ operations in 2022. Fresenius expects COVID-19 case numbers to decline going forward and consequently the number of elective treatments and staff availability to improve. An unlikely but possible significant deterioration of the situation triggering containment measures that could have a significant and direct impact on the health care sector without any appropriate compensation is not reflected in the Group’s FY/22 guidance.
The war in Ukraine is affecting Fresenius Group’s operations. The adverse effect of the war amounted to €14 million at net income level of Fresenius Group in the first quarter and is treated as a special item. Fresenius will continue to monitor closely the potential effects of the war.
With the increased uncertainty and volatility related to the Ukraine war, Fresenius now expects more pronounced cost inflationary effects and supply chain disruptions in 2022.
The Management Board assumes an unchanged corporate tax rate in the United States.
Furthermore, the assumptions for Fresenius Medical Care's FY/22 guidance are also fully applicable to Fresenius Group's FY/22 guidance.
All of these assumptions are subject to considerable uncertainty.
The recently announced acquisitions of Ivenix and the majority stake in mAbxience as well as any further potential acquisitions are excluded from guidance.
5% sales increase in constant currency
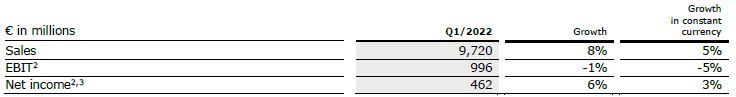
Group sales increased by 8% (5% in constant currency) to €9,720 million (Q1/21: €8,984 million). Organic growth was 3%. Acquisitions/divestitures contributed net 2% to growth. Currency translation increased sales growth by 3%. Excluding estimated COVID-19 effects1, Group sales growth would have been 5% to 6% in constant currency (Q1/21: 4% to 5%).
3% net income2,3 growth in constant currency
Group EBITDA before special items increased by 2% (-2% in constant currency) to €1,658 million (Q1/212: €1,631 million). Reported Group EBITDA was €1,595 million (Q1/21: €1,628 million).
Group EBIT before special items decreased by 1% (-5% in constant currency) to €996 million (Q1/212: €1,009 million) driven by the COVID-19-related excess mortality among Fresenius Medical Care’s patients as well as elevated labor, material and logistic costs. The EBIT margin before special items was 10.2% (Q1/212: 11.2%). Reported Group EBIT was €902 million (Q1/21: €1,006 million).
Group net interest before special items improved to -€119 million (Q1/212: -€137 million) mainly due to successful refinancing activities. Reported Group net interest also improved to -€118 million (Q1/21: -€137 million).
Group tax rate before special items was 22.7% (Q1/212: 22.8%) while the reported Group tax rate was 23.6% (Q1/21: 22.8%).
Noncontrolling interests before special items were -€216 million (Q1/212: -€237 million) of which 88% were attributable to the noncontrolling interests in Fresenius Medical Care. Reported noncontrolling interests were -€186 million (Q1/21: -€236 million).
1 For estimated COVID-19 effects in Q1/22 and Q1/21 please see table on page 16 in the PDF.
2 Before special items
3 Net income attributable to shareholders of Fresenius SE & Co. KGaA
For a detailed overview of special items please see the reconciliation tables on pages 18-19 in the PDF.
Group net income1 before special items increased by 6% (3% in constant currency) to €462 million (Q1/212: €436 million). Excluding estimated COVID-19 effects3, Group net income1 before special items would have been broadly stable (-2% to 2% in constant currency (Q1/21: 0% to 4%)). Reported Group net income1 decreased to €413 million (Q1/21: €435 million).
Earnings per share1 before special items increased by 6% (3% in constant currency) to €0.83 (Q1/212: €0.78). Reported earnings per share1 were €0.74 (Q1/21: €0.78).
Continued investment in growth
Spending on property, plant and equipment was €338 million corresponding to 3% of sales (Q1/21: €384 million; 4% of sales). These investments served primarily for the modernization and expansion of dialysis clinics, production facilities as well as hospitals and day clinics.
Total acquisition spending was €162 million (Q1/21: €149 million), mainly for the acquisition of dialysis clinics by Fresenius Medical Care and hospitals by Helios Spain.
Cash flow development
Group operating cash flow decreased to €101 million (Q1/21: €652 million) with a margin of 1.0% (Q1/21: 7.3%), mainly driven by working capital build-up from higher raw material inventories and receivables, among others, as well as phasing effects. Free cash flow before acquisitions and dividends decreased to -€255 million (Q1/21: €241 million). Free cash flow after acquisitions and dividends decreased to -€403 million (Q1/21: €117 million).
1 Net income attributable to shareholders of Fresenius SE & Co. KGaA
2 Before special items
3 For estimated COVID-19 effects in Q1/22 and Q1/21 please see table on page 16 in the PDF.
For a detailed overview of special items please see the reconciliation tables on pages 18-19 in the PDF.
Solid balance sheet structure
Group total assets increased by 2% (0% in constant currency) to €73,114 million (Dec. 31, 2021: €71,962 million) given currency translation effects and the expansion of business activities. Current assets increased by 3% (2% in constant currency) to €18,002 million (Dec. 31, 2021: €17,461 million), mainly driven by the increase of trade accounts receivables. Non-current assets increased by 1% (0% in constant currency) to €55,112 million (Dec. 31, 2021: €54,501 million).
Total shareholders’ equity increased by 4% (3% in constant currency) to €30,584 million (Dec. 31, 2021: €29,288 million). The equity ratio was 41.8% (Dec. 31, 2021: 40.7%).
Group debt remained stable (0% in constant currency) at €27,211 million (Dec. 31, 2021: € 27,155 million). Group net debt increased by 3% (2% in constant currency) to € 25,134 million (Dec. 31, 2021: € 24,391 million).
As of March 31, 2022, the net debt/EBITDA ratio increased to 3.60x1,2 (Dec. 31, 2021: 3.51x1,2) mainly driven by COVID-19 effects weighing on operating cash flow.
1 At LTM average exchange rates for both net debt and EBITDA; pro forma closed acquisitions/divestitures
2 Before special items
For a detailed overview of special items please see the reconciliation tables on pages 18-19 in the PDF.
Business Segments
Fresenius Medical Care (Financial data according to Fresenius Medical Care press release)
Fresenius Medical Care is the world's largest provider of products and services for individuals with renal diseases. As of March 31, 2022, Fresenius Medical Care was treating 343,493 patients in 4,153 dialysis clinics. Along with its core business, the Renal Care Continuum, the company focuses on expanding in complementary areas and in the field of critical care.
• Higher than anticipated COVID-19-related excess mortality, but declining throughout the quarter
• Earnings development affected by ongoing significantly elevated labor costs compounded by effects from Omicron in Health Care Services and by increased material and logistic costs in Health Care Products
• Earnings development in EMEA additionally impacted by the war in Ukraine
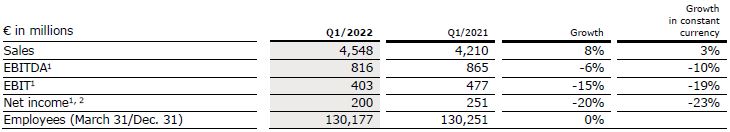
Sales increased by 8% (3% in constant currency) to €4,548 million (Q1/21: €4,210 million). Organic growth was 2%. Currency translation increased sales growth by 5%.
EBIT decreased by 27% (-30% in constant currency) to €348 million (Q1/21: €474 million) resulting in a margin of 7.6% (Q1/21: 11.3%). EBIT before special items, i.e. costs incurred for FME25 and the impact related to the war in Ukraine, decreased by 15% (-19% in constant currency) to €403 million (Q1/21: €477 million), resulting in a margin1 of 8.9% (Q1/21: 11.3%). At constant currency, the decline was mainly due to higher labor costs, adverse COVID-19-related effects, as well as inflationary and supply chain cost increases. These effects were only partially mitigated by the partial reversal of an accrual related to a revenue recognition adjustment for accounts receivable in legal dispute.
1 Before special items
2 Net income attributable to shareholders of Fresenius Medical Care AG & Co. KGaA
For a detailed overview of special items please see the reconciliation tables on pages 18-19 in the PDF.
Net income1 decreased by 37% (-39% in constant currency) to €157 million (Q1/21: €249 million). Net income1 before special items decreased by 20% (-23% in constant currency) to €200 million (Q1/21: €251 million) mainly due to the mentioned negative effects on operating income.
Operating cash flow was €159 million (Q1/21: €208 million) with a margin of 3.5% (Q1/21: 4.9%). The decrease was mainly due to continued recoupment of the U.S. government’s payments received in 2020 under the CARES Act and a decrease in net income, partially offset by a favorable impact from trade accounts and other receivables.
For FY/22, Fresenius Medical Care confirms its outlook and expects revenue2 and net income1,3 to grow at low- to mid-single-digit percentage rates in constant currency4.
For further information, please see Fresenius Medical Care’s press release at www.freseniusmedicalcare.com.
1 Net income attributable to shareholders of Fresenius Medical Care AG & Co. KGaA
2 FY/21 base: €17,619 million
3 FY/21 base: €1,018 million, before special items; FY/22 before special items
4 These targets are based on the 2021 results excluding the costs related to FME25 of €49 million (for net income). They are based on the assumptions outlined in the press release on the Q4 and FY 2021 results (Feb.22, 2022), in constant currency and exclude special items. Special items include further costs related to FME25, the impacts related to the war in Ukraine, and other effects that are unusual in nature and have not been foreseeable or not foreseeable in size or impact at the time of giving guidance.
For a detailed overview of special items please see the reconciliation tables on pages 18-19 in the PDF.
Fresenius Kabi
Fresenius Kabi offers intravenously administered generic drugs, clinical nutrition and infusion therapies for seriously and chronically ill patients in the hospital and outpatient environments. The company is also a leading supplier of medical devices and transfusion technology products. In the biosimilars business, Fresenius Kabi develops products with a focus on oncology and autoimmune diseases.
• North America performance impacted by persistent headwinds
• Emerging Markets showed strong earnings growth
• Acquisition of Ivenix and majority stake in mAbxience expected to accelerate growth
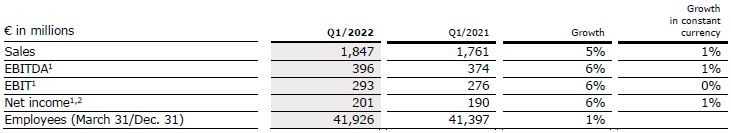
Sales increased by 5% (1% in constant currency) to €1,847 million (Q1/21: €1,761 million). Organic growth was 1%. Positive currency translation effects of 4% were mainly related to the U.S. dollar and Chinese yuan.
Sales in North America increased by 4% (organic growth: -3%) to €579 million (Q1/21: €558 million). The organic revenue decrease was mainly due to high level of COVID-related absenteeism of production staff and ongoing competitive pressure.
Sales in Europe increased by 2% (organic growth: 2%) to €640 million (Q1/21: €626 million) mainly driven by increasingly normalizing volume demand given progressing recovery of elective treatments.
Sales in Asia-Pacific increased by 10% (organic growth: 3%) to €433 million (Q1/21: €392 million), due to solid growth across the region. In China, higher sales of products not affected by the NVBP (National Volume-Based Procurement) tenders contributed positively.
Sales in Latin America/Africa increased by 5% (organic growth: 2%) to €195 million (Q1/21: €185 million), over a high prior-year COVID-19-related base.
Sales in the Biosimilars business was €23 million, consistent with Fresenius Kabi’s expectations.
1 Before special items
2 Net income attributable to shareholders of Fresenius SE & Co. KGaA
For a detailed overview of special items please see the reconciliation tables on pages 18-19 in the PDF.
EBIT1 increased by 6% (0% in constant currency) to €293 million (Q1/21: €276 million) with an EBIT margin1 of 15.9% (Q1/21: 15.7%). The high level of absenteeism of production staff primarily due to COVID-19, ongoing competitive pressure, supply chain challenges as well as input cost inflation weighed on the financial performance.
Net income1,2 increased by 6% (increased by 1% in constant currency) to €201 million (Q1/21: €190 million).
Operating cash flow decreased to €133 million (Q1/21: €278 million) with a margin of 7.2% (Q1/21: 15.8%) mainly driven by a working capital build-up from e.g. higher raw material inventories.
For FY/22, Fresenius Kabi confirms its outlook and expects organic sales3 growth in a low single- digit percentage range. Constant currency EBIT4 is expected to decline in a high single- to low-double-digit percentage range. Both sales and EBIT outlook include expected COVID-19 effects.
In March, the acquisitions of Ivenix and a majority stake in mAbxience were announced. mAbxience significantly enhances Fresenius Kabi’s presence in the high-growth biopharmaceuticals market. The acquisition of Ivenix, closed at the beginning of May, strengthens the company’s MedTech business. The financial effects from both acquisitions are excluded from guidance.
1 Before special items
2 Net income attributable to shareholders of Fresenius SE & Co. KGaA
3 FY/21 base: €7,193 million
4 FY/21 base: €1,153 million, before special items, FY/22 before special items
For a detailed overview of special items please see the reconciliation tables on pages 18-19 in the PDF.
Fresenius Helios
Fresenius Helios is Europe's leading private hospital operator. The company comprises Helios Germany, Helios Spain and Helios Fertility. Helios Germany operates 88 hospitals, ~130 outpatient centers and 6 prevention centers. Helios Spain operates 50 hospitals, 97 outpatient centers and around 300 occupational risk prevention centers. In addition, the company is active in Latin America with 8 hospitals and as a provider of medical diagnostics. Helios Fertility offers a wide spectrum of state-of the-art services in the field of fertility treatments.
• Helios Germany with solid organic growth based on increased number of admissions
• Helios Spain delivered excellent organic sales and earnings growth given continued strong activity levels
• Helios Fertility with solid financial performance
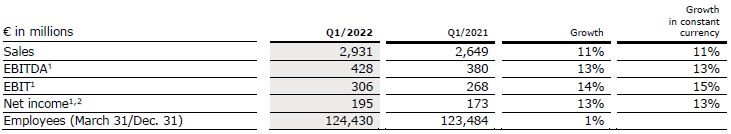
Sales increased by 11% (11% in constant currency) to €2,931 million (Q1/21: €2,649 million). Organic growth was 8%. Acquisitions, mainly at Helios Fertility, contributed 3% to sales growth.
Sales of Helios Germany increased by 7% (organic growth: 5%) to €1,783 million (Q1/21: €1,673 million), mainly driven by increasing admissions, which are however still below prepandemic levels. Hence growth was supported by COVID-19-related reimbursement schemes. Acquisitions contributed 1% to sales growth.
Sales of Helios Spain increased by 12% (12% in constant currency) to €1,089 million (Q1/21: €976 million). Organic growth of 11% was driven by consistently high activity levels. The hospitals in Latin America also contributed to sales growth. Acquisitions contributed 1% to sales growth.
Sales of the Helios Fertility were €57 million.
1 Before special items
2 Net income attributable to shareholders of Fresenius SE & Co. KGaA
For a detailed overview of special items please see the reconciliation tables on pages 18-19 in the PDF.
EBIT1 increased by 14% (15% in constant currency) to €306 million (Q1/21: €268 million) with an EBIT margin1 of 10.4% (Q1/21: 10.1%).
EBIT1 of Helios Germany increased by 3% to €154 million (Q1/21: €150 million) with an EBIT margin1 of 8.6% (Q1/21: 9.0%). COVID-related elevated staff absenteeism at the beginning of the quarter weighed on profitability. Inflationary effects had only a small negative impact.
EBIT1 of Helios Spain increased by 21% (22% in constant currency) to €153 million (Q1/21: €126 million) due to the consistently high level of treatments. The Latin American business also showed a good performance. The EBIT margin1 was 14.0% (Q1/21: 12.9%).
EBIT1 of Helios Fertility was €4 million with an EBIT1 margin of 7.0%.
Net income1,2 increased by 13% (13% in constant currency) to €195 million (Q1/21: €173 million).
Operating cash flow decreased to -€136 million (Q1/21: €215 million) with a margin of -4.6% (Q1/21: 8.1%) following a strong Q4/21 and COVID-19-related delays in budget negotiations in Germany.
For FY/22, Fresenius Helios confirms its outlook and expects organic sales3 growth in a low to mid-single-digit percentage range and constant currency EBIT4 growth in a mid-single digit percentage range. Both sales and EBIT outlook include expected COVID-19 effects.
1 Before special items
2 Net income attributable to shareholders of Fresenius SE & Co. KGaA
3 FY/21 base: €10,891 million
4 FY/21 base: €1,127 million, before special items, FY/22 before special items
For a detailed overview of special items please see the reconciliation tables on pages 18-19 in the PDF.
Fresenius Vamed
Fresenius Vamed manages projects and provides services for hospitals and other health care facilities worldwide and is a leading post-acute care provider in Central Europe. The portfolio ranges along the entire value chain: from project development, planning, and turnkey construction, via maintenance and technical management to total operational management.
• Project business still marked by COVID-19-related headwinds as well as global supply chain challenges and cost inflation
• Service business supported by increasing elective treatment activity
• Excellent order intake
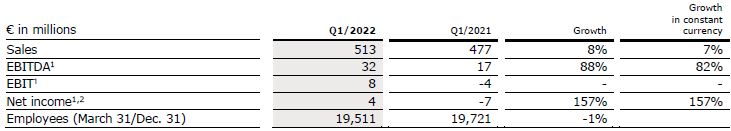
Sales increased by 8% (7% in constant currency) to €513 million (Q1/21: €477 million). Organic growth was 7%.
Sales in the service business increased by 12% (11% in constant currency) to €405 million (Q1/21: €363 million) due to recovering elective treatments. Sales in the project business decreased by 5% (-5% in constant currency) to €108 million (Q1/21: €114 million), driven by COVID-19-related headwinds as well as global supply chain challenges.
EBIT1 increased to €8 million (Q1/21: -€4 million) mainly driven by the service business with an EBIT margin1 of 1.6% (Q1/21: -0.8%).
1 Before special items
2 Net income attributable to shareholders of VAMED AG
For a detailed overview of special items please see the reconciliation tables on pages 18-19 in the PDF.
Net income1,2 increased to €4 million (Q1/21: -€7 million).
Order intake was €263 million (Q1/21: €138 million). As of March 31, 2022, order backlog was at €3,626 million (December 31, 2021: €3,473 million).
Operating cash flow decreased to -€45 million (Q1/21: -€44 million) with a margin of -8.8% (Q1/21: -9.2%), due to phasing effects and COVID-19-related delays in the project business as well as some working capital build-ups.
For FY/22, Fresenius Vamed confirms its outlook and expects organic sales3 growth in a high single to low-double-digit percentage range and constant currency EBIT4 to return to absolute pre-COVID-19 levels (FY/19: €134 million). Both sales and EBIT outlook include expected COVID-19 effects.
1 Before special items
2 Net income attributable to shareholders of VAMED AG
3 FY/21 base: €2,297 million
4 FY/21 base: €101 million, before special items; FY/22 before special items
For a detailed overview of special items please see the reconciliation tables on pages 18-19 in the PDF.
Conference Call
As part of the publication of the results for Q1/2022, a conference call will be held on May 4, 2022 at 1:30 p.m. CEDT (7:30 a.m. EDT). All investors are cordially invited to follow the conference call in a live broadcast over the Internet at www.fresenius.com/investors. Following the call, a replay will be available on our website.
For additional information on the performance indicators used please refer to our website www.fresenius.com/alternative-performance-measures.
This release contains forward-looking statements that are subject to various risks and uncertainties. Future results could differ materially from those described in these forward-looking statements due to certain factors, e.g. changes in business, economic and competitive conditions, regulatory reforms, results of clinical trials, foreign exchange rate fluctuations, uncertainties in litigation or investigative proceedings, and the availability of financing. Fresenius does not undertake any responsibility to update the forward-looking statements in this release.