
Fresenius, via its operating company Fresenius Kabi, announced today the immediate availability of its biosimilar Tyenne® (tocilizumab-aazg) in a subcutaneous formulation in the U.S, continuing its (Bio)Pharma momentum.
With this launch Fresenius is increasing access to affordable and cost-effective treatment options for use in the treatment of chronic autoimmune diseases. This is another important milestone in accelerating the company’s strong (Bio)Pharma momentum, a substantial cornerstone of #FutureFresenius. Tyenne®, the company’s third biosimilar in the U.S., was launched in an intravenous (IV) formulation in April this year.
Fresenius published its first Sustainability Highlights Report today. In the online report, the company presents its sustainability strategy, ambitions and highlights. In addition, the company reports on Scope 3 emissions for the first time, thereby creating full transparency across the entire value chain.
Fresenius published its first Sustainability Highlights Report today. In the online report, the company presents its sustainability strategy, ambitions and highlights. In addition, the company reports on Scope 3 emissions for the first time, thereby creating full transparency across the entire value chain.
The rating agency S&P Global Ratings today revised the credit outlook for Fresenius SE from negative to stable. The rating was affirmed at BBB. In particular, S&P acknowledged Fresenius's improved operating performance, its simplified structure and capacity to deliver on its profitable growth plans.
"The revised outlook is further proof that #FutureFresenius is paying off. It confirms our focus on profitable growth, liquidity, and capital efficiency. Based on the operational strength of our operating companies Fresenius Kabi and Fresenius Helios, we expect to be within our self-imposed leverage target corridor by year end," said Fresenius CFO Sara Hennicken.
Fresenius is rated investment grade by the three leading rating agencies S&P Global Ratings (BBB/stable), Moody's (Baa3/stable) and Fitch (BBB-/stable). The company expects that it will be within its self-imposed leverage corridor of 3.0 to 3.5x net debt/EBITDA by the end of 2024.
1 At expected average exchange rates for both net debt and EBITDA; pro forma closed acquisitions/divestitures; excluding further potential acquisitions/divestitures; before special items; including lease liabilities and Fresenius Medical Care dividend
The rating agency S&P Global Ratings today revised the credit outlook for Fresenius SE from negative to stable. The rating was affirmed at BBB. In particular, S&P acknowledged Fresenius's improved operating performance, its simplified structure and capacity to deliver on its profitable growth plans.
"The revised outlook is further proof that #FutureFresenius is paying off. It confirms our focus on profitable growth, liquidity, and capital efficiency. Based on the operational strength of our operating companies Fresenius Kabi and Fresenius Helios, we expect to be within our self-imposed leverage target corridor by year end," said Fresenius CFO Sara Hennicken.
Fresenius is rated investment grade by the three leading rating agencies S&P Global Ratings (BBB/stable), Moody's (Baa3/stable) and Fitch (BBB-/stable). The company expects that it will be within its self-imposed leverage corridor of 3.0 to 3.5x net debt/EBITDA1 by the end of 2024.
1 At expected average exchange rates for both net debt and EBITDA; pro forma closed acquisitions/divestitures; excluding further potential acquisitions/divestitures; before special items; including lease liabilities and Fresenius Medical Care dividend

- Improving Fresenius Helios outlook for FY/24 – Expecting mid-single-digit revenue growth and an EBIT margin of 10% to 11% in FY/24
- Raising ambition level for Fresenius Helios within Fresenius Financial Framework – Targeting organic revenue growth of 4% to 6% p.a. as well as structural EBIT margin band of 10% to 12%
- System-critical and stable businesses – Helios Germany’s and Quirónsalud’s patient-centric, reliable and market-leading provider network driving steady capital-efficient organic growth and consistent cash-flow generation
- Digital and data strategy – Bringing new tools and technologies, such as AI, to clinical practice and tapping opportunities to leverage proprietary data to boost treatment outcomes
- Key value drivers – Clustering and specialization, outpatient integration, and emergency care provision in Germany; technology-focused improvements, enhanced physician value proposition, and selective network expansion in Spain
At its Capital Markets Day in London, global healthcare company Fresenius today presented a strategy update for its Care Provision Platform and improved the outlook for its Operating Company Fresenius Helios. For FY/24, Fresenius Helios now expects organic revenue to grow in a mid-single digit percentage range (previous: low-to-mid-single-digit percentage range) and targets an EBIT margin of 10 to 11% (previous: within structural margin band of 9% to 11%). Furthermore, Fresenius raised its ambition level for Fresenius Helios within the Fresenius Financial Framework, and now targets an annual organic revenue growth of 4% to 6% (previous: 3% to 5%) as well as a structural margin band of 10% to 12% (previous: 9% to 11%). The ambition is to grow EBIT stronger than revenue, hence, underlining accelerated profitable growth. Fresenius Helios further sharpens its focus on optimizing net working capital to improve its sustainable cash flow generation. The expected acceleration of organic revenue growth, targeted productivity improvements, enhanced profitability and rigorous capital allocation measures are contributing to Fresenius Group’s ambition to improve its Return on Invested Capital (ROIC) and its deleveraging efforts.
The improved expectations follow a strong start into 2024 and are based on the key elements and drivers of Fresenius Helios’ growth strategy, which Fresenius outlined to analysts and investors today. The main growth drivers at Helios in Germany are an extended medical cluster & specialization strategy, further improved outpatient integration and a boost of the emergency care provision. At Quirónsalud, the main growth drivers are technology-focused improvements, various physician support initiatives, as well as a selective network expansion. Fresenius Helios is Europe's leading private healthcare provider. It operates around 140 hospitals and more than 400 outpatient facilities under its brands Helios in Germany and Quirónsalud in Spain and Colombia.
Fresenius CEO Michael Sen said: “As a leading therapy-focused company, we are shaping the future of healthcare, which will be digital, data-driven, personalized and human. And this is where our strength lies. We are close to the patients. We are Committed to Life. That is the promise we have made with #FutureFresenius. And we are a simpler and stronger company today. Our sharpened focus on our Operating Companies is paying off. The strong and reliable growth momentum of our Care Provision Platform gives us confidence which is why we are improving the outlook for Fresenius Helios for the full year.”
Hospital markets growing
Hospital markets in Germany and Spain are growing steadily and reliably. In Germany, the total hospital market in 2023 was around €120 billion. It is expected to grow by 3% to 4% per year until 2027, driven by supportive demographic trends including an aging population and inflation-related base rate adjustments. Furthermore, Helios Germany sees itself well positioned to benefit from the planned hospital reform, which fosters hospital network concentration, specialization and a stronger integration of inpatient and outpatient care.
In Spain, where there are distinct public and private healthcare systems, the private provider segment accounted for 20% (€21 billion) of total provider expenditures in 2023 and is expected to grow at an average rate of 4% to 5% annually until 2027. This growth is – like in Germany – also driven by demographic factors, and price adjustments, but also by a continued uptake of private health insurances due to public system pressure, resulting in a growing demand for private provider offerings.
Robert Möller, member of the Fresenius Management Board and CEO of Fresenius Helios, said: “Providing world-class care and high-quality medical outcomes is key to our success. We lead in two steadily growing and highly attractive markets, representing roughly 30% of the EU's total population. It makes us number one in European healthcare provision, and it makes us critical for the systems we serve. With our proven focus on superior medical outcome quality, highly efficient care provision and strong digital and data capabilities, we are well positioned in both countries to drive steady, value-accretive growth.”
Growth strategies for Germany and Spain
In Germany, Helios will further drive its strategy of grouping its hospitals into highly specialized clusters, whereby two to five hospitals in geographic proximity form one multi-site hospital system. Experience shows that these clusters deliver higher medical quality, efficiency and growth by consolidating and better aligning medical and administrative activities as well as promoting specialization among the locations. The cluster and specialization strategy therefore is also well aligned with current and expected future regulatory changes in Germany. This also applies to the stronger integration of inpatient and outpatient care, which Helios expects to support with its own network of around 230 outpatient centers and strong relationships with external partners. These allow for seamless patient journeys and a closer collaboration between physicians resulting in improved patient experience and medical outcome quality.
Quirónsalud in Spain focuses on its core hospital operations and continued value creation based on its leadership position and solid market fundamentals. The Spanish hospital market is highly attractive with a growing private healthcare segment, providing tailwinds to Quirónsalud’s steady and resilient growth going forward. Focus of Quirónsalud will be on further improving clinical pathways, leveraging digital capabilities to optimize processes and performance as well as to boost patient care quality. Already today, Quirónsalud has an outstanding positioning in digitalization in Spain with more than 6 million registered patient portal users and large parts of the patient journey being already fully digitalized. In addition, Quirónsalud will drive value from strengthening its value proposition to attract and retain best-in-market talents as well as in engaging selective network expansion.
Digitalization as enabler to boost medical outcome quality
Given their commitment to highest medical quality, Helios Germany and Quirónsalud highly focus on outcome quality and its continuous further improvement by measurement against internal and external benchmarks. Helios in Germany, for example, delivers better quality performance versus the market average in 89% of its cases and has a patient satisfaction rate of 96%. Meanwhile Quirónsalud is the first private group worldwide to earn the JCI accreditation for healthcare quality at the corporate level and has a 90% patient satisfaction rate. Both Helios Germany and Quirónsalud are currently rolling out a structured benchmarking program to intensify cross company comparison and best practice sharing from best performing hospitals, setting the benchmark for all hospitals in the group.
Leveraging medical data, analytics and AI will further promote improved medical outcomes as well as personalized care and better patient experience. Fresenius Helios aims to systematically utilize medical and clinical data to improve treatment quality and outcomes, as well as unlock experience and efficiency gains for its patients, its people, and its performance at the same time. The clear aim is to have all relevant clinical decision-making supported by digital assistance in the mid-term.
ESG: Zero CO2 emissions by 2040
Fresenius Helios reiterates its ambitious ESG targets across its business activities with clearly defined tracking and connection to management remuneration. Its ESG strategy holistically aims to serve patients, people and the planet and is reflected in respective KPIs. Initiatives focused on patients include the Inpatient Quality Indicator and ISO certifications of Helios hospitals, for instance. The efforts for its people are, for example, captured with the People Engagement Index, reflecting initiatives like employee training. With regard to its planet commitment, Fresenius Helios’ key ambition is to reduce CO2 emissions by 50% by 2030 and to zero by 2040.
Webcast
Presentations will be held on June 5, 2024, starting at 11:30 a.m. CEDT. You are cordially invited to follow the Capital Markets Day in a live webcast at https://www.fresenius.com/capital-markets-day. After the event, a replay will be available on our website.
This release contains forward-looking statements that are subject to various risks and uncertainties. Future results could differ materially from those described in these forward-looking statements due to certain factors, e.g. changes in business, economic and competitive conditions, regulatory reforms, results of clinical trials, foreign exchange rate fluctuations, uncertainties in litigation or investigative proceedings, the availability of financing and unforeseen impacts of international conflicts. Fresenius does not undertake any responsibility to update the forward-looking statements in this release.
At today’s Annual General Meeting in Frankfurt am Main, the shareholders of Fresenius SE & Co. KGaA approved the proposals of the General Partner and the Supervisory Board by a large majority.
Wolfgang Kirsch, Chairman of the Supervisory Board, thanked the Management Board and emphasized Fresenius’ strong performance in extremely challenging geopolitical times. “Against this backdrop, Fresenius has performed well as a leading healthcare company compared to the competition and has improved significantly in operational terms.” He added that the #FutureFresenius program is strengthening Fresenius sustainably in the interests of all stakeholders. “The new Management Board team under the leadership of Michael Sen brings experience and complementary skills, team spirit and abilities, which will allow us to achieve the ambitious corporate goals and successfully implement #FutureFresenius,” said Kirsch.
CEO Michael Sen thanked the shareholders for supporting the #FutureFresenius journey, as well as the members of the Supervisory Board and Chairman Wolfgang Kirsch for their excellent cooperation. “We have successfully completed the first phases of #FutureFresenius and regained trust. We shall now tackle the remaining phases with motivation and optimism,” he stressed.
A large majority of 99.84% of shareholders voted in favor of approving the annual financial statements. The shareholders approved the Compensation Report for the 2023 fiscal year by 93.06%. Large majorities of 96.48% and 95.90% respectively approved the actions of the Management Board and the Supervisory Board in 2023.
At the Annual General Meeting of Fresenius SE & Co. KGaA, 72.65% of the registered capital was represented.
This release contains forward-looking statements that are subject to various risks and uncertainties. Future results could differ materially from those currently expected due to various risk factors and uncertainties, e.g. changes in business, economic and competitive conditions, regulatory reforms, results of clinical trials, foreign exchange rate fluctuations, uncertainties in litigation or investigative proceedings, the availability of financing and unforeseen impacts of international conflicts. Fresenius does not undertake any responsibility to update the forward-looking statements in this release.
-
Michael Sen, Fresenius CEO Download Image (JPG 1.07 MB) -
![]()
Michael Sen, Fresenius CEO Download Image (JPG 1.09 MB) -
![]()
Wolfgang Kirsch, Chairman of the Supervisory Board Download Image (JPG 1.15 MB) -
![]()
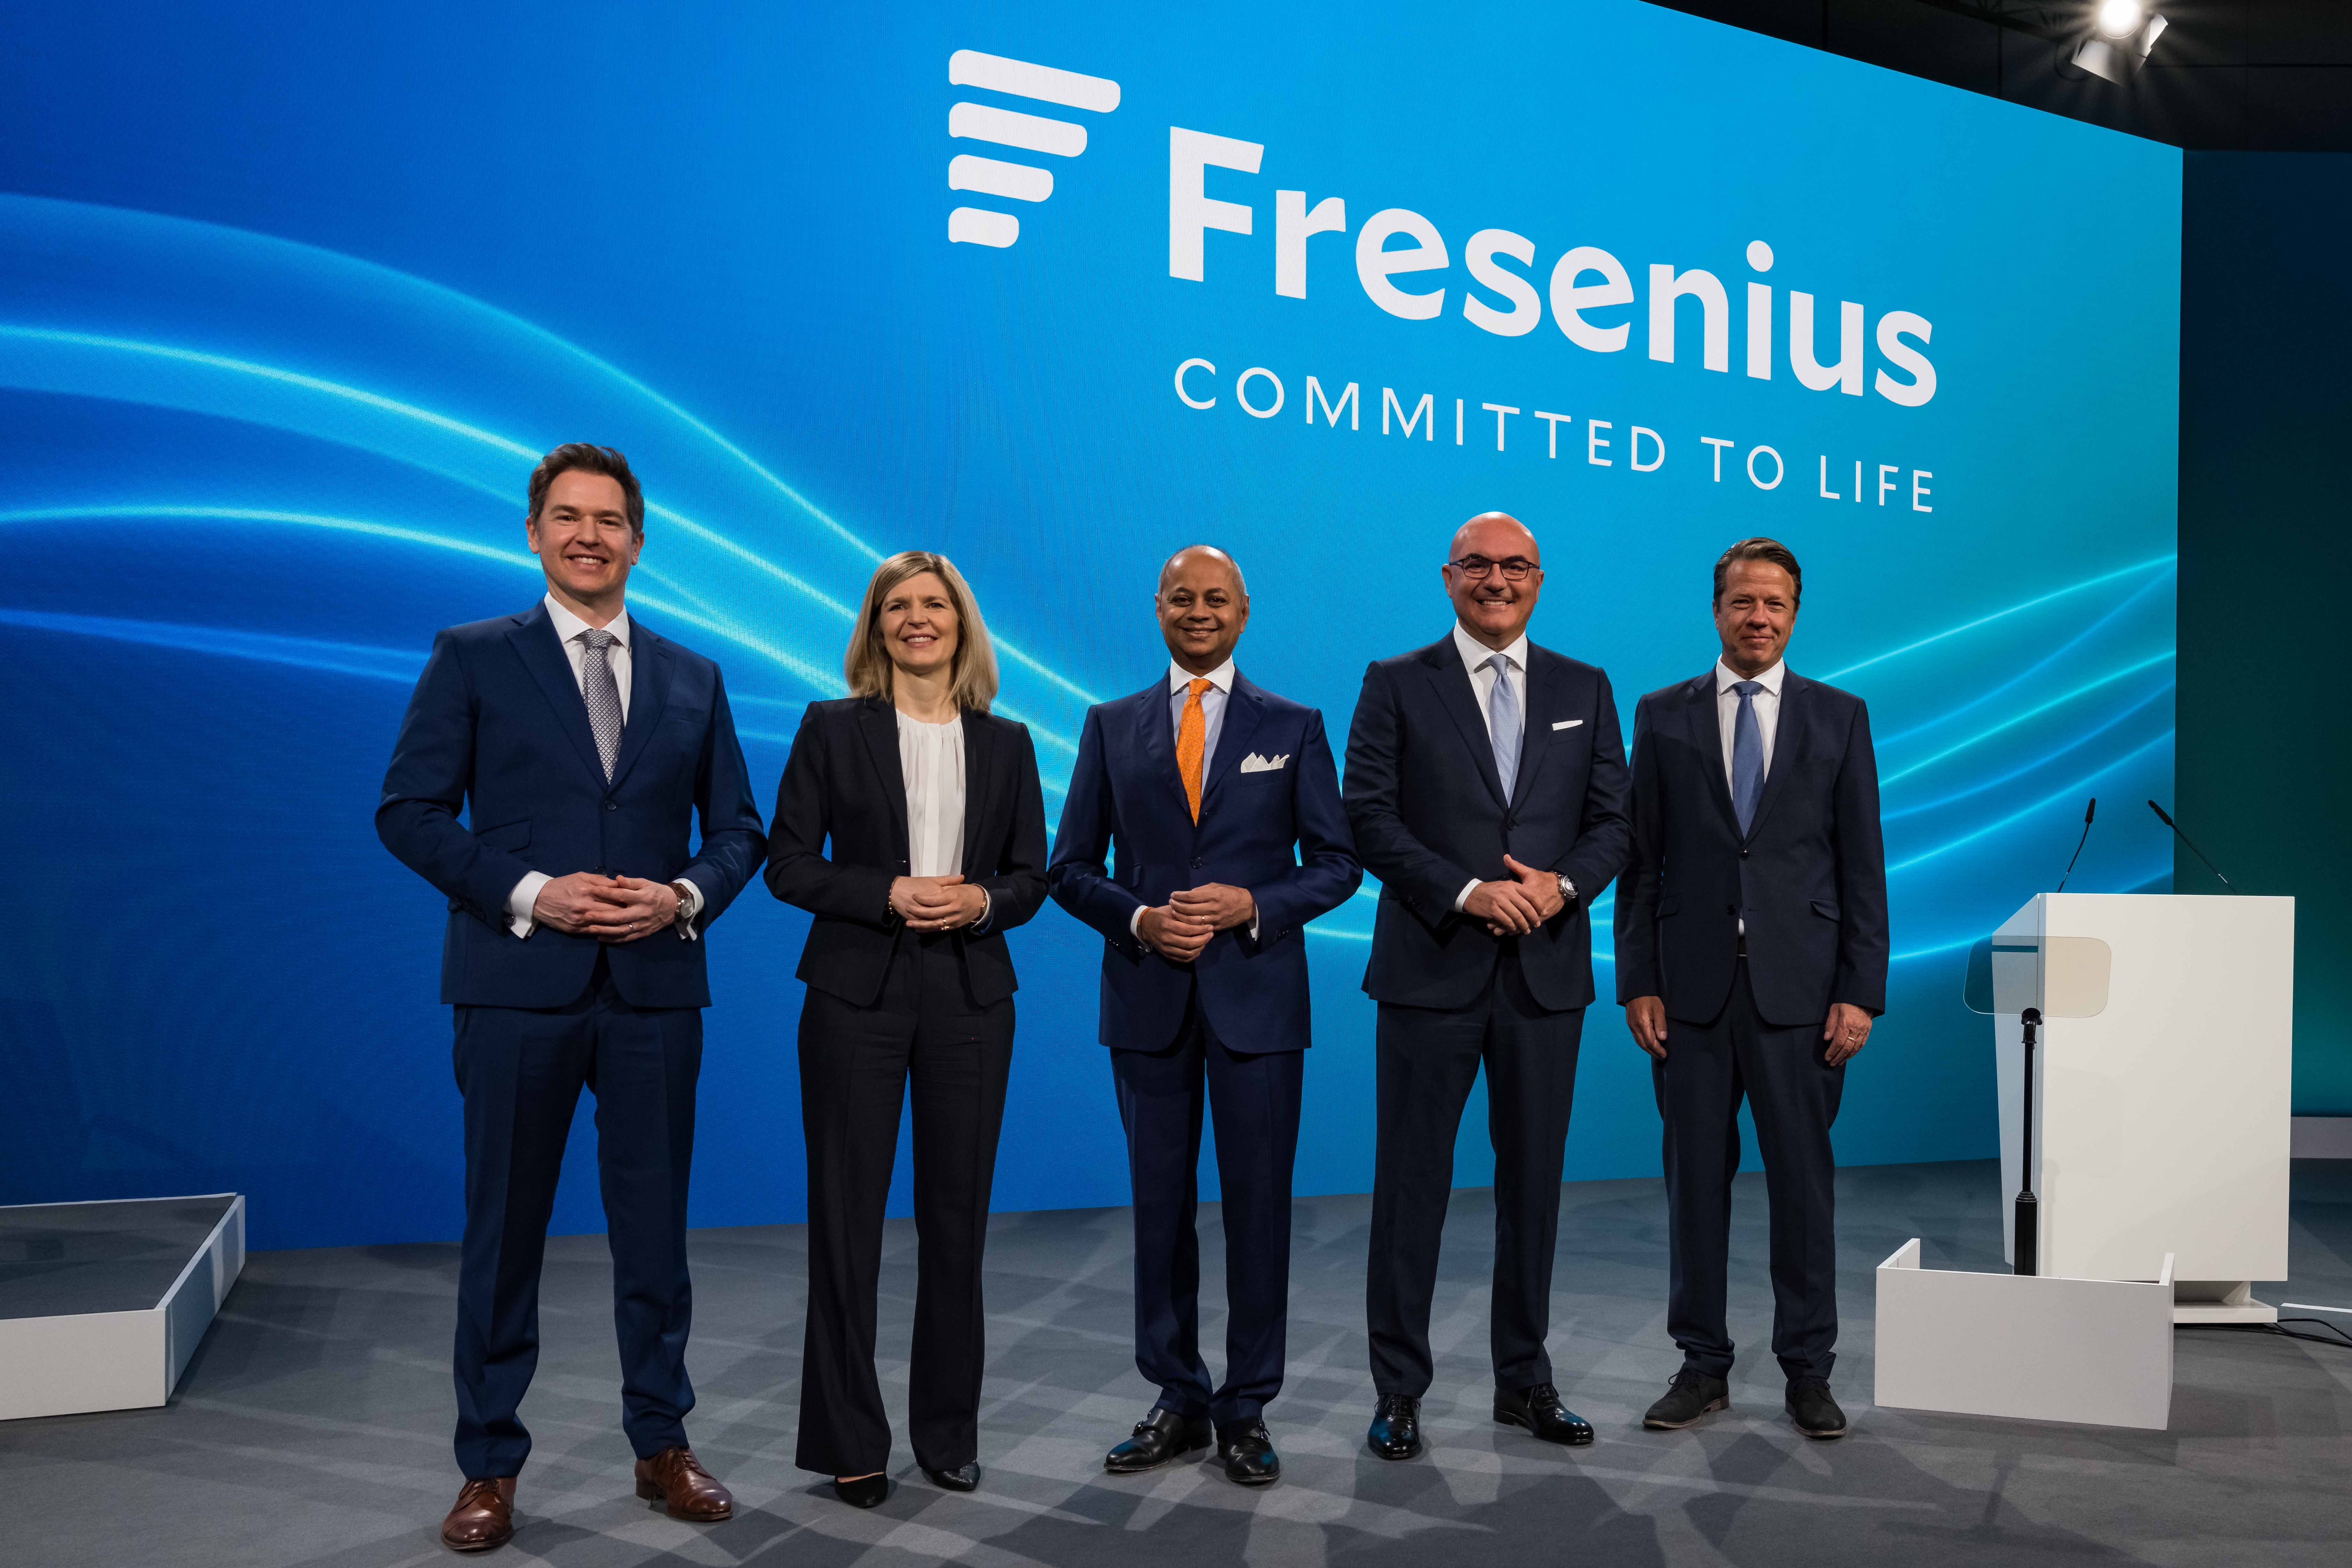
Fresenius Management Board Download Image (JPG 1.24 MB) -
![]()
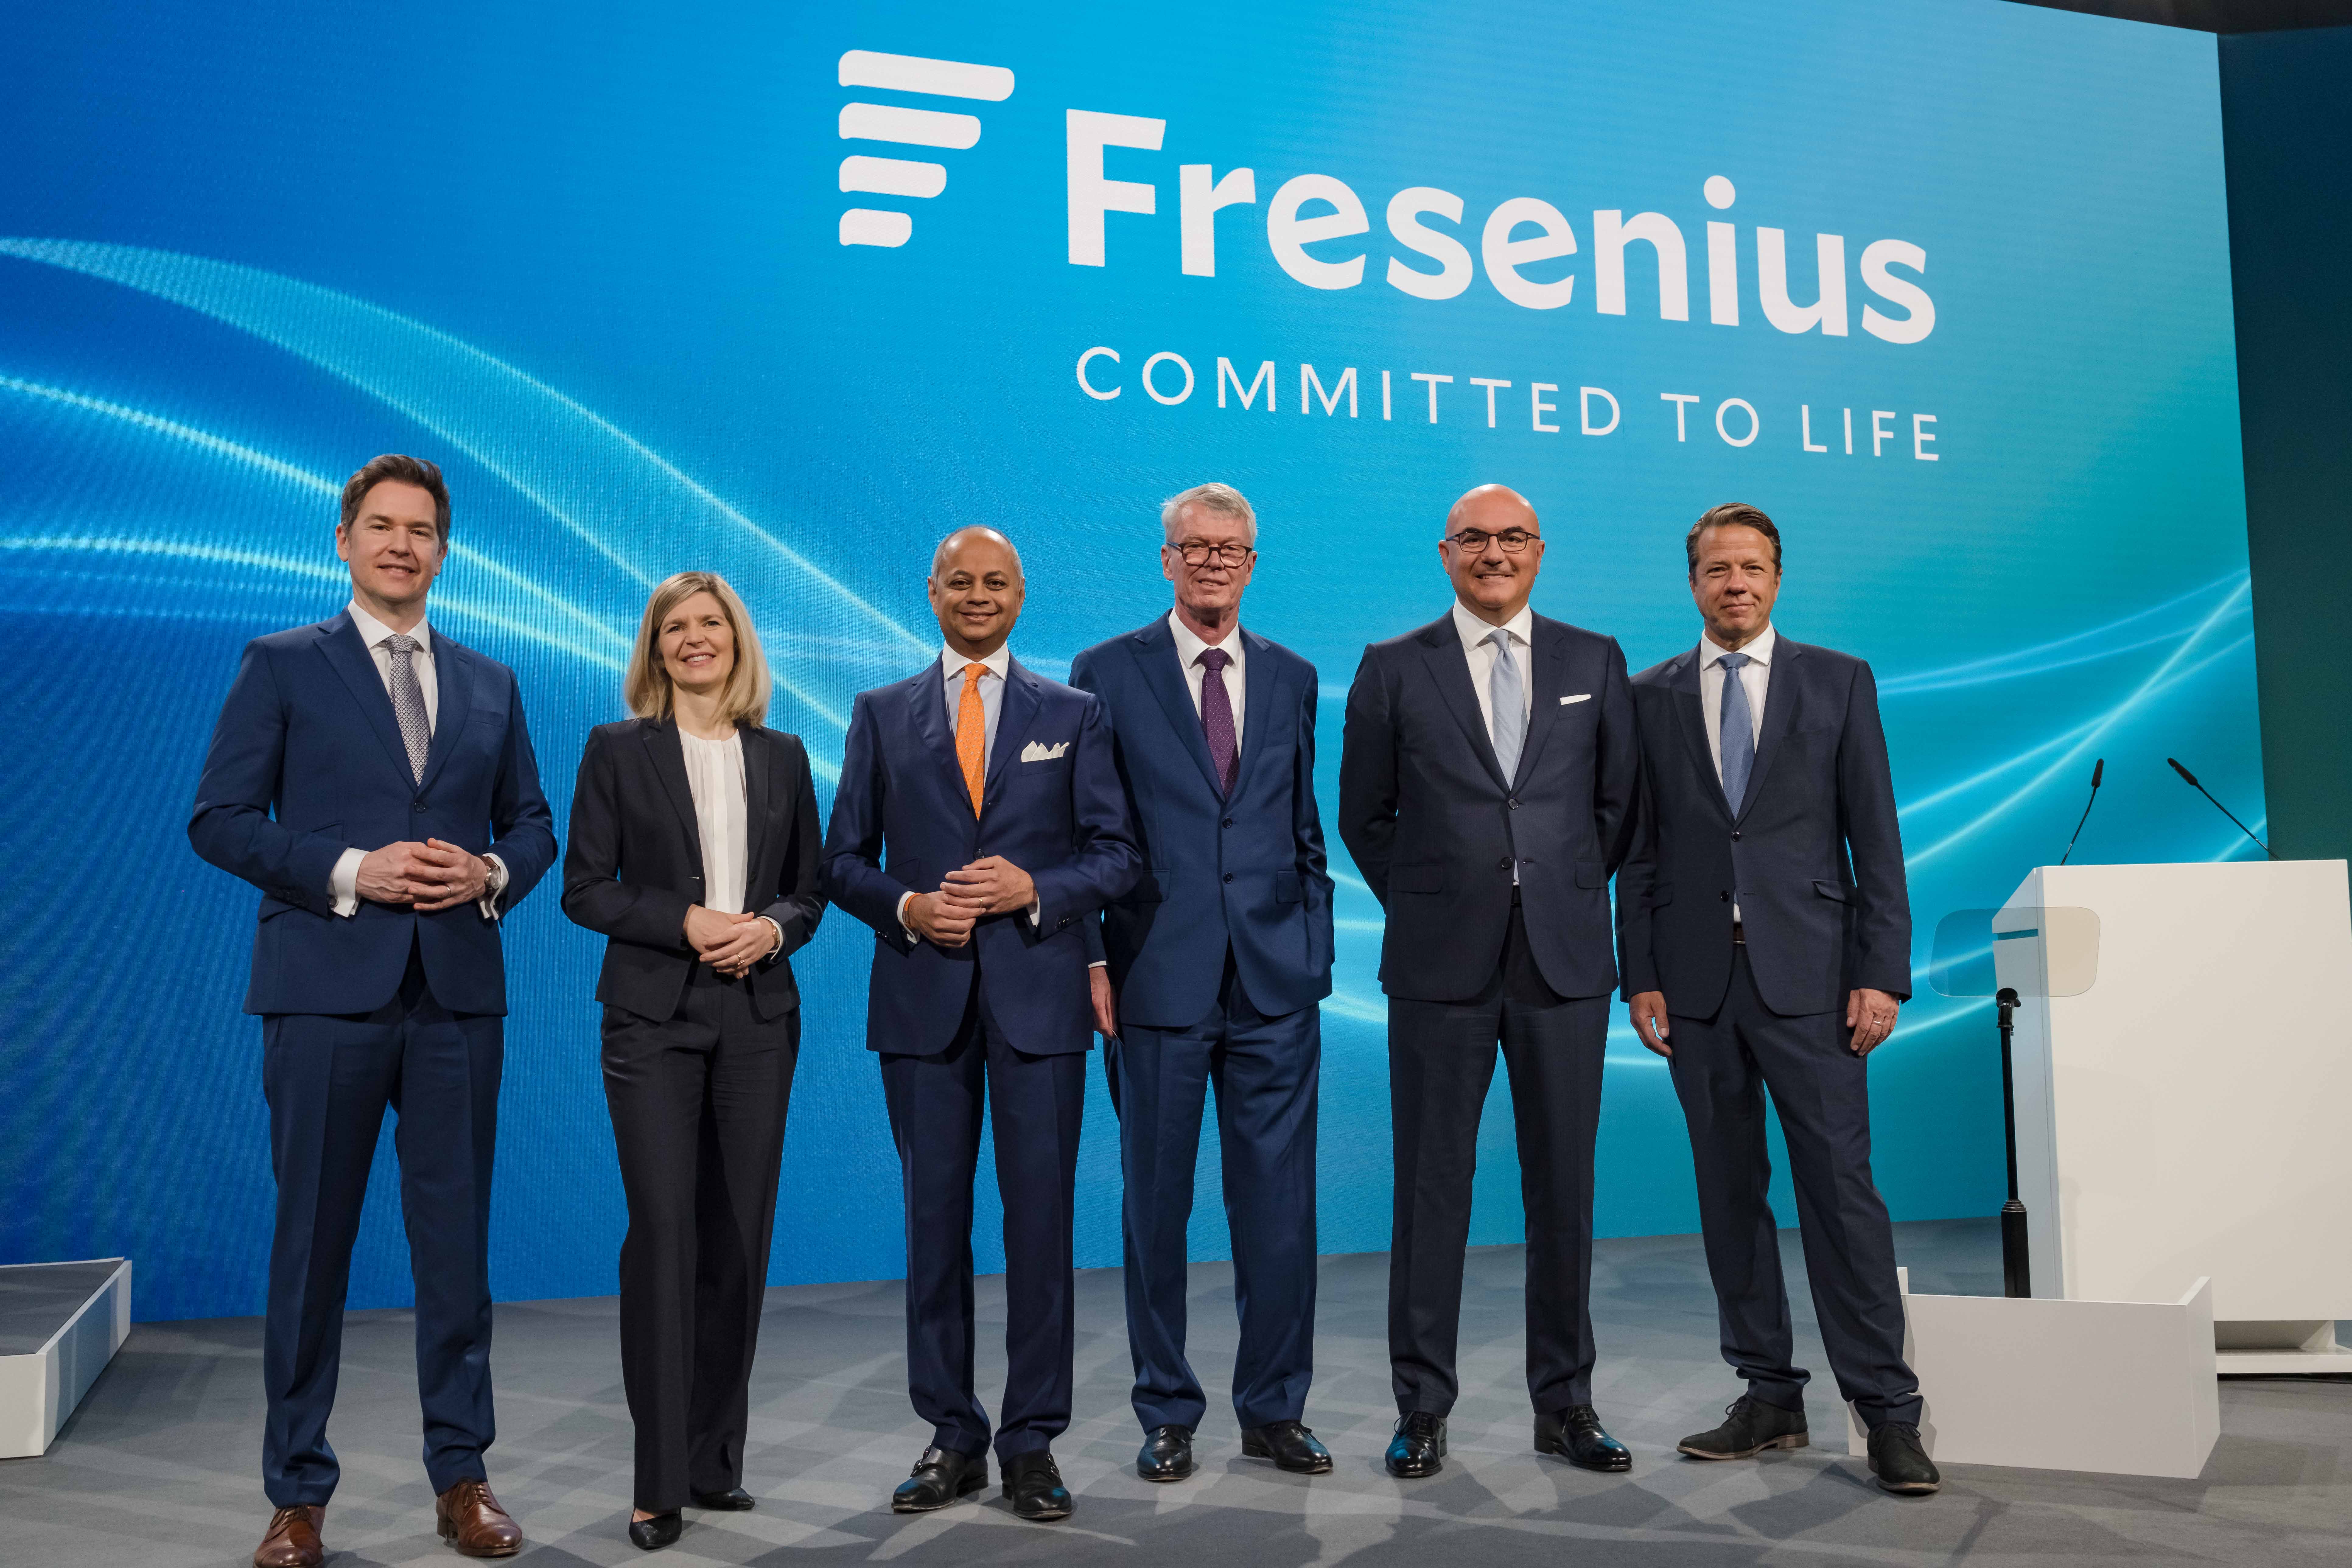
Fresenius Management Board with Wolfgang Kirsch, Chairman of the Supervisory Board (forth from left) Download Image (JPG 1.31 MB)
- Fresenius is simpler, stronger, and more innovative due to #FutureFresenius
- Following a strong first quarter and higher expectations for the year as a whole, outlook improved at the beginning of May
- First in-person Annual General Meeting since 2019
- Fresenius’ new brand identity reflects its restructuring
After an excellent start to the 2024 fiscal year, DAX 40 company Fresenius is looking to the future with confidence. “Our aim for the coming years is to now establish Fresenius as an economically successful, innovative healthcare company focused on modern therapies,” said CEO Michael Sen at this year’s Annual General Meeting on Friday in Frankfurt am Main.
“2023 was a year of change and new beginnings here at Fresenius. We introduced our #FutureFresenius program to restructure our company, sharpen our focus, and continue successfully developing our company. We now want to tap into this positive momentum,” Sen stressed. The structural simplification, including the deconsolidation of Fresenius Medical Care and the exit from Vamed, as well as the focus on Fresenius Kabi and Fresenius Helios, is increasingly paying off. Both core businesses are growing profitably in highly attractive markets and were able to further increase their momentum in the first quarter of 2024.
With the presentation of the financial figures for the first quarter, Fresenius raised the Group’s outlook1 for the current fiscal year last week and now expects organic revenue growth of 4–7% and currency-adjusted EBIT growth of 6–10%.
1 The adjustment of the Group outlook reflects the fact that the forecast now excludes Fresenius Vamed, i.e. it is exclusively for the operating companies Fresenius Kabi and Fresenius Helios.
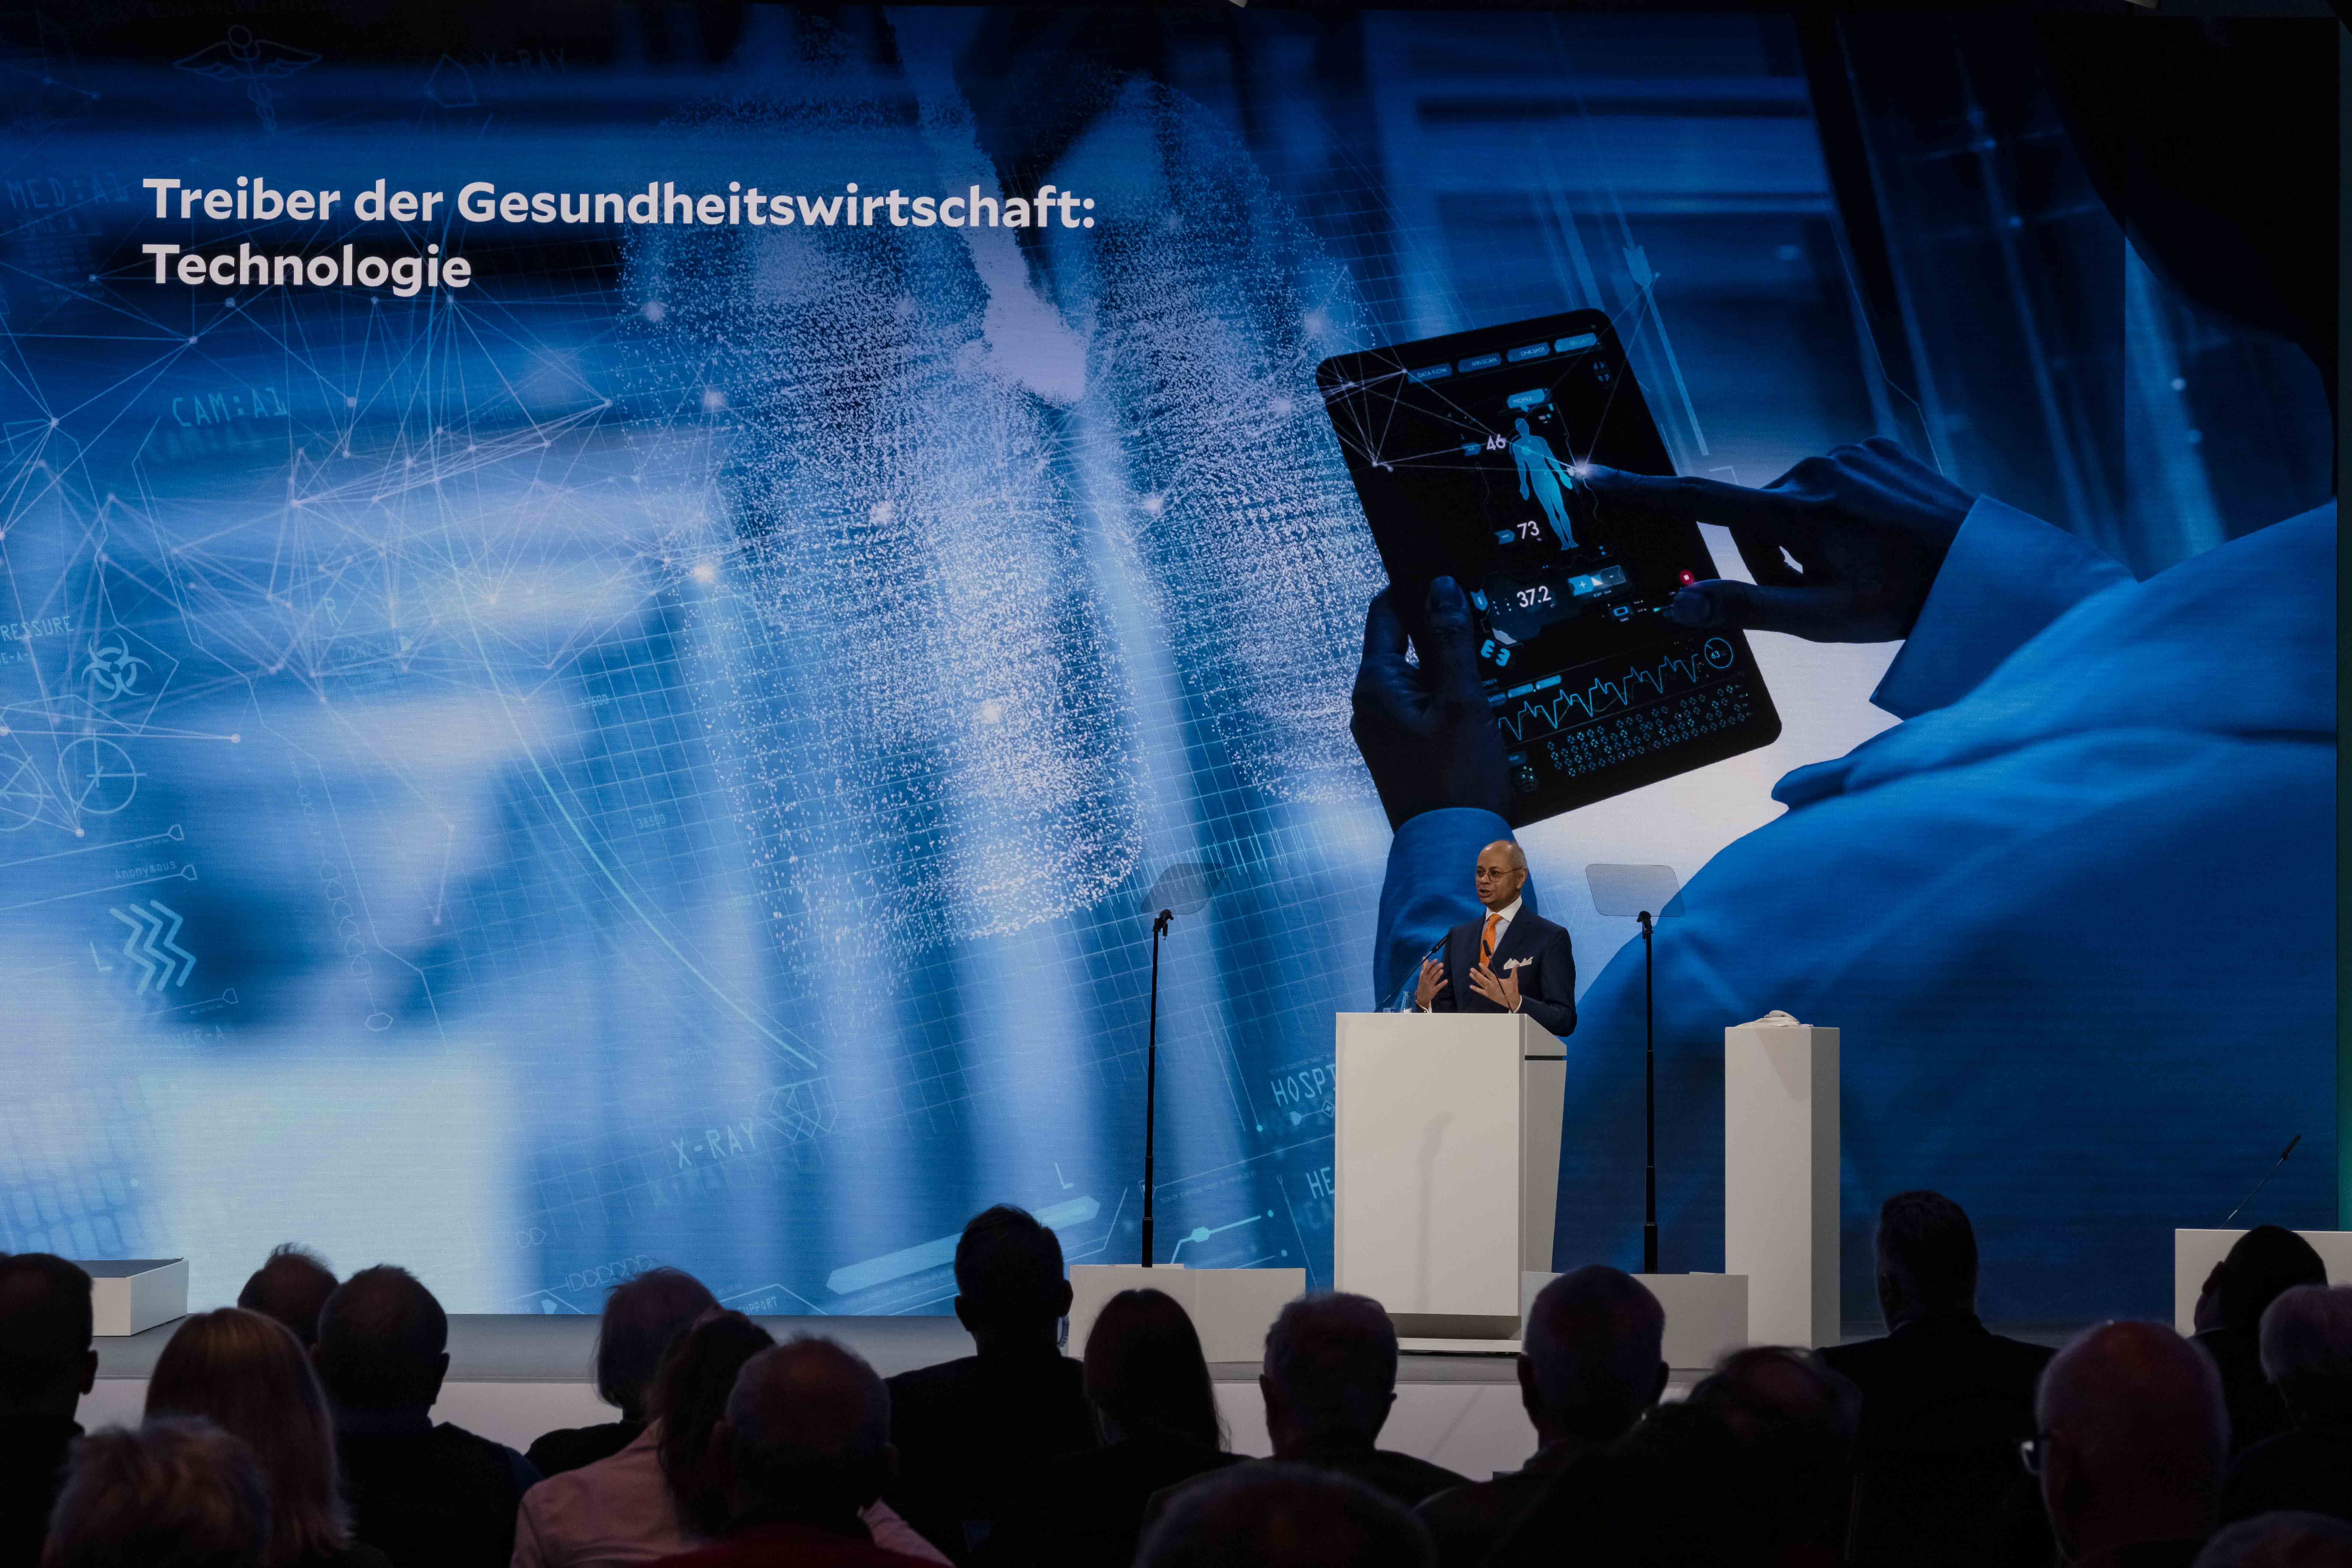
“We have regained our strength at just the right time. The healthcare industry is currently growing robustly and reliably. Indeed, it is one of the most attractive sectors,” Sen said. To this end, Fresenius is focusing its business on three platforms, which together create a market potential of up to €1 trillion: (Bio)Pharma, which includes chemical and biological drugs and clinical nutrition, MedTech, i.e. medical technology, which increasingly involves a combination of hardware and software, and Care Provision, i.e. medical care, whether in-patient or outpatient, or at home. Sen emphasized: “We are close to the patients. And this is exactly what sets us apart from purely pharma and medtech companies. And also from tech companies based in Silicon Valley.”
This proximity to the patients is also demonstrated by innovative products that enhance the medical quality and efficiency of care. Fresenius Kabi recently achieved two major milestones with the market launch of the biosimilar Tyenne for the treatment of inflammatory and autoimmune diseases in the EU and the USA. In Fresenius Helios hospitals, highly precise and tissue-friendly surgical robots assist in minimally invasive procedures. These robots are operated by a doctor by hand control and pedal. A total of 20 Da Vinci surgical robots are currently used at Helios hospitals in Germany.
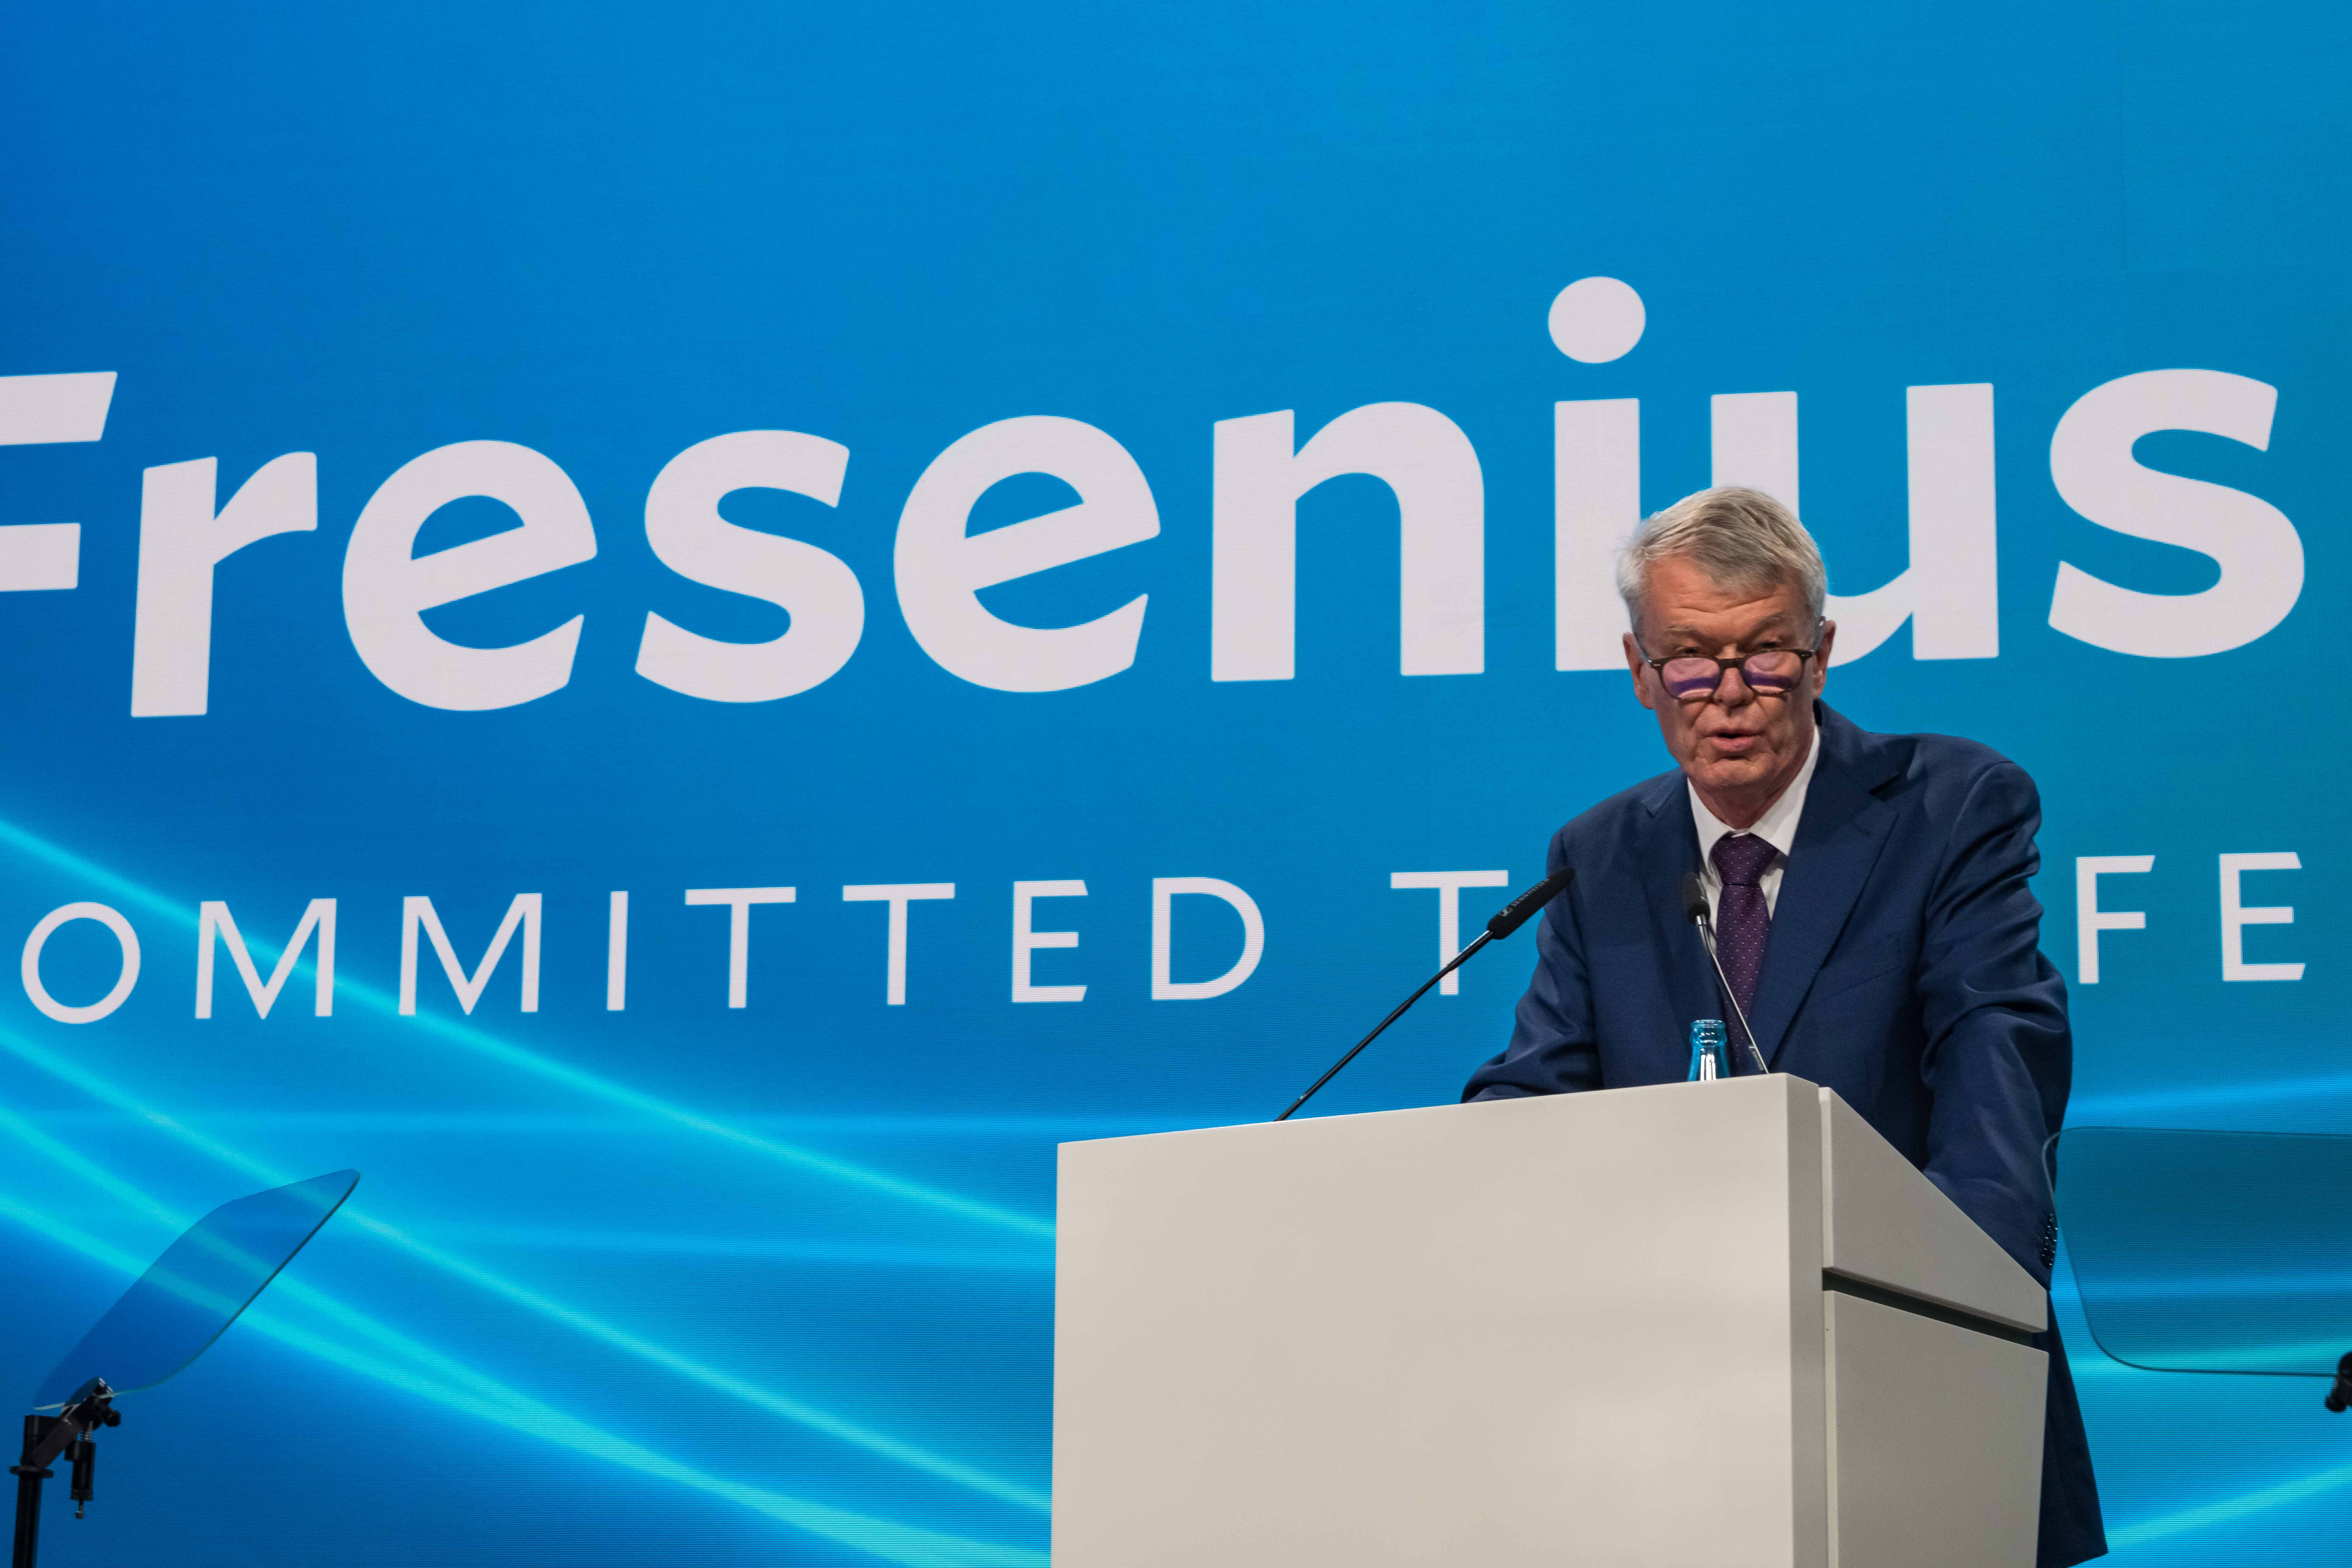
Fresenius introduced a fresh and modernized brand identity at the Annual General Meeting. With its new slogan “Committed to Life”, Fresenius aims to be recognized as a leading healthcare company offering world-class therapies and improving people’s lives.
This year’s Annual General Meeting is the first in-person Fresenius shareholder meeting since 2019. Several hundred shareholders were expected to attend the Annual General Meeting at Messe Frankfurt.
This release contains forward-looking statements that are subject to various risks and uncertainties. Future results could differ materially from those described in these forward-looking statements due to certain factors, e.g. changes in business, economic and competitive conditions, regulatory reforms, results of clinical trials, foreign exchange rate fluctuations, uncertainties in litigation or investigative proceedings, the availability of financing and unforeseen impacts of international conflicts. Fresenius does not undertake any responsibility to update the forward-looking statements in this release.
- Vamed’s operations in Austria to be sold to an Austrian consortium of construction companies, Porr and Strabag.
- Vamed’s hospital services unit to be transferred to the Fresenius Group.
- Vamed's international project business to gradually be scaled back in an orderly manner. Current project contracts are to be fulfilled.
- The exit from Vamed, including the announced divestment of the rehabilitation business, is a further milestone on the path to #FutureFresenius and completes the strategic portfolio restructuring.
- Fresenius has significantly reduced its complexity and underlined its position as a leading therapy-focused company.
Following the announcement of the sale of Vamed’s rehabilitation business, the global healthcare group Fresenius has initiated a structured exit from its Investment Company Vamed. An Austrian consortium of construction companies Porr and Strabag has agreed to acquire Vamed’s activities in its Austrian home market for a total purchase price of 90 million Euros. The transaction includes Vamed’s entities responsible for the technical management of the Vienna General Hospital (AKH Wien), the Austrian project business that is part of Vamed’s Health Tech Engineering segment and shares in several spas throughout Austria. The planned transaction is subject to regulatory approvals and customary conditions.
Vamed’s High-End Services (HES) business unit, which provides services for Fresenius Helios and other hospitals, will be transferred to Fresenius. HES generates around half of its revenue through its provision of services to Helios hospitals. It offers facility and medical technology management for a total of more than 840 hospitals. HES is a stable business with good growth prospects and accounts for around 30% of Vamed's revenue. The profitability of HES is in the mid-single-digit percentage range.
The Health Tech Engineering segment, which is responsible for the international project business and accounts for around 15% of Vamed's revenue, will gradually be scaled back in an orderly manner. The process should largely be completed by 2026. Until then, the business will be reported as a special item outside Fresenius' core business. Current project contracts will be fulfilled.
The divestments lead to non-cash special items of around € 0.6 billion. Due to the exit from the project business, a high triple-digit-million Euro amount of special items are expected, which are spread over the next few years and mostly cash effective.
As of Q2 2024, Vamed will no longer be a reporting segment of Fresenius. In addition to reducing complexity, this step is expected to improve the Group's profitability by more than 50 basis points. It will also reduce net debt and increase the Group's return on invested capital (ROIC). Last but not least, the transparency and quality of earnings will be significantly enhanced.
“We have found a holistic and viable solution for the Vamed businesses, creating good prospects for the future. It is the best outcome for patients, for Vamed, and for Fresenius. With the exit from Vamed, our strategic portfolio restructuring has been completed as planned. Fresenius is already a simpler, stronger, and more innovative company due to the consistent implementation of #FutureFresenius. We now have even more opportunities to provide world-class therapies and improve people’s health,” said Fresenius CEO Michael Sen.
Dr. Michael Moser, the member of the Fresenius Management Board among others responsible for the Vamed business, added: “We are pleased that Vamed’s High-End Services business is joining Fresenius. We have found a very good solution for both the rehabilitation business with PAI and the Austrian project business with the Austrian owners Porr and Strabag. This enables us to create long-term growth opportunities. We are now looking for fair solutions for the employees affected by the gradual ramp-down of our project business outside of Austria.”
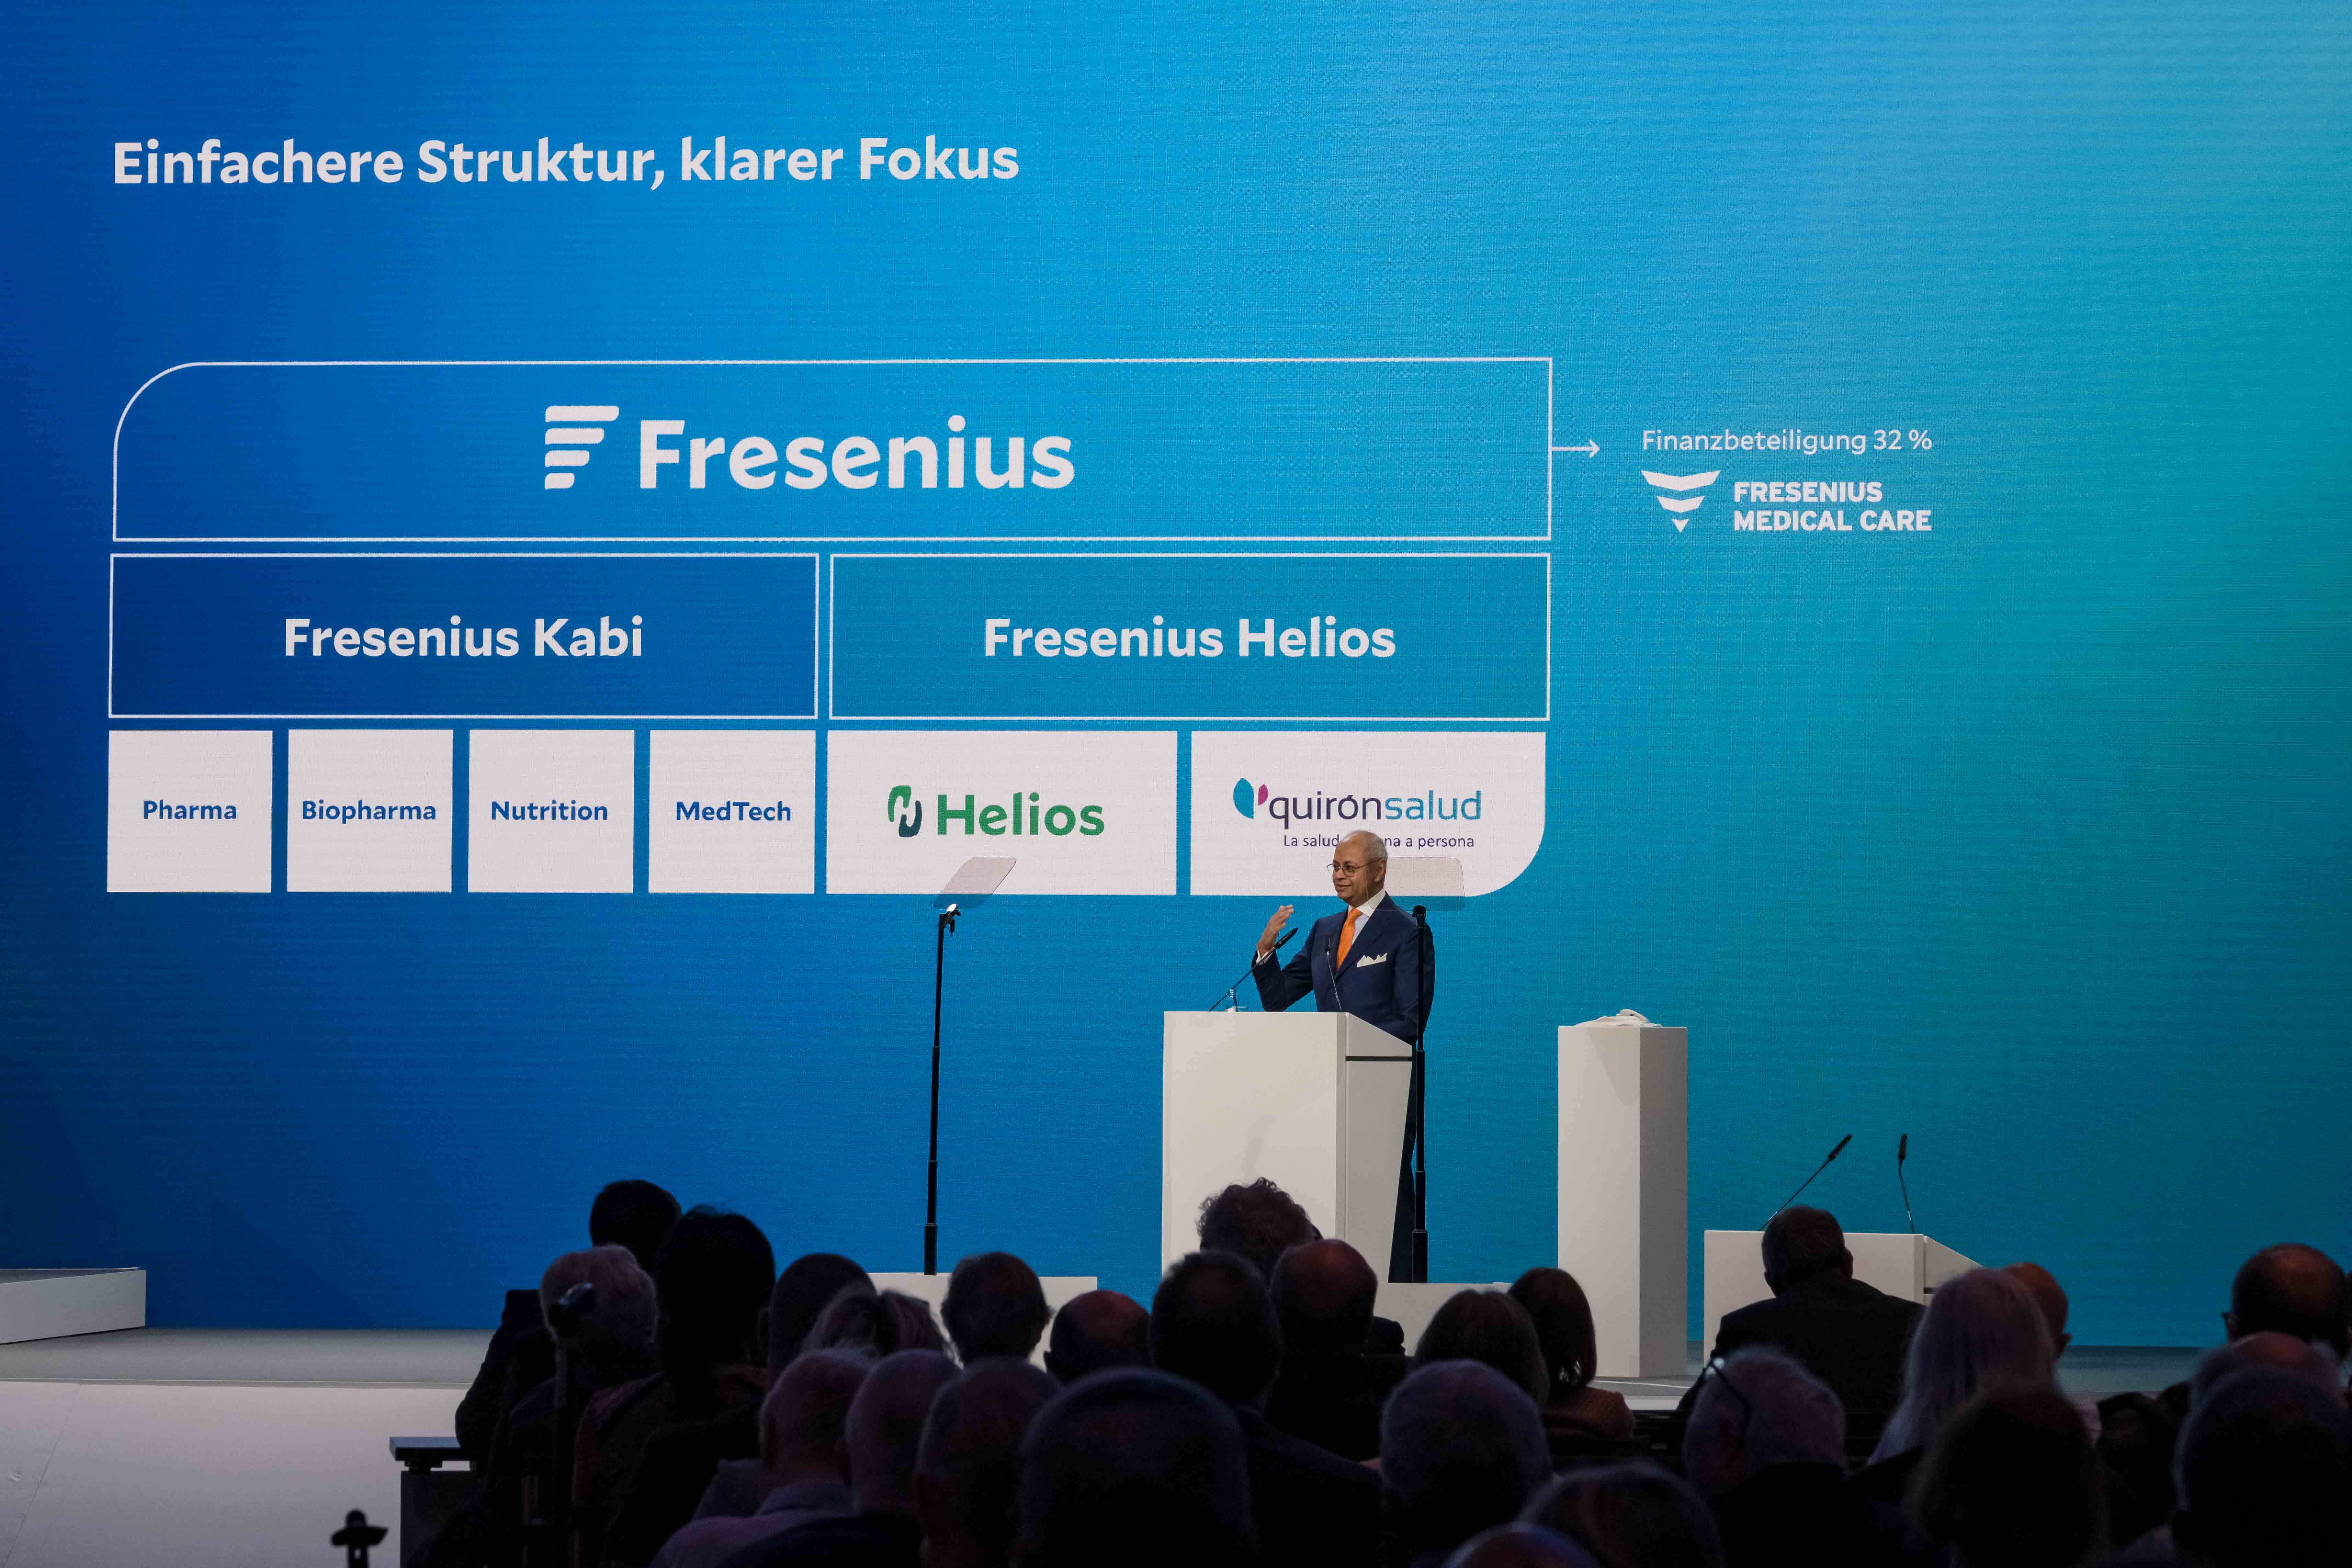
After exiting Vamed, Fresenius will consist of the two Operating Companies Fresenius Kabi and Fresenius Helios (each with 100% ownership share) and the Investment Company Fresenius Medical Care (32% ownership share).
This release contains forward-looking statements that are subject to various risks and uncertainties. Future results could differ materially from those described in these forward-looking statements due to certain factors, e.g. changes in business, economic and competitive conditions, regulatory reforms, results of clinical trials, foreign exchange rate fluctuations, uncertainties in litigation or investigative proceedings, the availability of financing and unforeseen impacts of international conflicts.
Fresenius does not undertake any responsibility to update the forward-looking statements in this release.