
February 22, 2022
Fresenius delivers a strong finish to the year meeting its improved 2021 guidance – Strategic evaluation shows path to accelerated growth
- Further earnings growth in 2022 expected despite ongoing COVID-19 effects, and cost inflation impact
- Accelerated execution of cost and efficiency program leading to earlier and significantly higher savings
- Medium-term growth targets confirmed and specified
- 29th consecutive dividend increase – scrip dividend proposed
- Fresenius to be climate neutral by 2040
If no timeframe is specified, information refers to Q4/2021.
1 Before special items
2 Net income attributable to shareholders of Fresenius SE & Co. KGaA
For a detailed overview of special items please see the reconciliation tables on pages 21-25 in the PDF.
Stephan Sturm, CEO of Fresenius, said: “Our mission is to protect people’s health. Fulfilling that mission has rarely been as difficult as during this pandemic. But we have done our part and have lived up to our responsibility. In business terms, too, 2021 was challenging yet successful: We delivered a strong final quarter and fully met our targets for the year. In 2022 we expect continued profitable growth, despite rising inflation and the ongoing burdens caused by the pandemic. In our cost and efficiency program, we have made faster than expected progress. This is an important factor enabling us to confirm the medium-term targets we set well before the pandemic, giving us all the more reason to look ahead with optimism.”
Path to accelerated growth
Fresenius has defined a strategic path to pursue accelerated profitable growth and hence to sustainably strengthen the Group and each of its business segments by tapping new sources of capital and prioritizing segment capital allocation. All our stakeholders continue to benefit from the advantages of the Group’s current structure, which offers stability through diversification as well as efficiency through economies of scale, access to attractive debt financing and tax savings.
All of Fresenius’ business segments have excellent market positions and ample meaningful growth opportunities. Properly balancing the objectives of all our stakeholder groups requires an even more targeted approach to capital allocation. While Fresenius continues to believe in the virtues of vertical integration, the Company is keen to gradually re-balance the relative weights of its products and service businesses.
Primarily based on its superior profitability and excellent growth prospects, Fresenius Kabi is defined as top priority. With respect to Fresenius Medical Care, which has been particularly hard hit by the pandemic, the transformation program FME25 is expected to result in ever improving profitability and accelerated growth, driving improved valuation for Fresenius’ controlling stake. For Fresenius Helios and Fresenius Vamed, smaller inorganic growth opportunities will continue to be financed from Fresenius Group funds. For larger growth opportunities, Fresenius is open to value-enhancing external equity investments at the level of these business segments. An equity increase on Group level would then be redundant and is hence not foreseen.
By setting this course, Fresenius will accelerate the growth of each of our business segments for the benefit of all stakeholders.
“We are moving Fresenius ahead at speed, with a measured and well-managed transformation of our company. All our business segments have strong market positions, and great growth potential. We intend to harness this potential – guided by clear strategic priorities that will combine additional sources of more dynamic growth with the advantages of a broad business structure. Fresenius remains a diversified healthcare group, with a sharper profile, that will be active in wide-ranging and very exciting areas of medicine,” said Stephan Sturm, CEO of Fresenius.
FY/22 Group guidance
For FY/22, Fresenius projects sales growth1 in a mid-single-digit percentage range in constant currency. Net income2,3 is expected to grow in a low-single-digit percentage range in constant currency. Implicitly, net income2 for the Group excluding Fresenius Medical Care is expected to grow in a low-single-digit percentage range in constant currency.
Without further acquisitions, Fresenius projects an improvement of the net debt/EBITDA4 ratio (December 31, 2021: 3.51x5) into the self-imposed target corridor of 3.0x to 3.5x by the end of 2022.
Assumptions for guidance FY/22
COVID-19 will continue to impact Fresenius’ operations in 2022. The extent of the impact on the Group is to a large degree dependent on the vaccination coverage in Fresenius’ relevant markets and the potential evolution of new virus mutants.
Fresenius closely monitors the development of the COVID-19 pandemic and the associated various containment measures enacted in the Company’s relevant markets. Fresenius expects COVID-19 case numbers to decline from spring 2022 onwards and consequently the number of elective treatments and staff availability to improve. A possible significant deterioration of the situation associated with further containment measures that could have a significant and direct impact on the health care sector without any appropriate compensation is not reflected in the Group’s FY/22 guidance.
1 FY/21 base: €37,520 million
2 Net income attributable to shareholders of Fresenius SE & Co. KGaA
3 FY/21 base: €1,867 million; before special items; FY/22: before special items
4 At LTM average exchange rates for both net debt and EBITDA; pro forma closed acquisitions/divestitures; excluding further potential acquisitions; before special items; including lease liabilities
5 At LTM average exchange rates for both net debt and EBITDA; pro forma closed acquisitions/divestitures; before special items; including lease liabilities
For a detailed overview of special items please see the reconciliation tables on pages 21-25 in the PDF.
Headwinds from cost inflation are reflected. However, Fresenius expects no significant acceleration of inflation effects and supply chain challenges versus the current environment. The Management Board assumes an unchanged corporate tax rate in the United States.
Furthermore, the assumptions for Fresenius Medical Care's FY/22 guidance are also fully applicable to Fresenius Group's FY/22 guidance.
All of these assumptions are subject to considerable uncertainty.
Cost and efficiency program leading to significantly higher savings
Fresenius has successfully completed the first phase of its cost and efficiency program aiming to further safeguard the Group’s medium-term targets and to sustainably enhance profitability. This has led to initial cost savings of ~€20 million and one-time expenses of ~€80 million in 2021. Given the good progress, especially driven by the accelerated implementation of initiatives, Fresenius significantly increases its savings target and now expects cost savings of at least €150 million p.a. after tax and minority interest in 2023. Initially, more than €100 million p.a. after tax and minority interest were projected. For the years thereafter, a further significant increase in sustainable cost savings is expected. The savings will be achieved by all four business segments and the corporate center.
Fresenius anticipates that achieving these sustainable efficiency improvements will require up-front expenses of more than €200 million in 2022 and further expenses of around €100 million in 2023, in each case after taxes and minority interest. No further significant expenses are expected thereafter. In line with previous practice, these expenses are classified as special items.
Growth targets for 2020 – 2023 confirmed and specified
Based on the anticipated positive contributions from the cost and efficiency program as well as the attractive growth opportunities across all business segments, Fresenius expects Group earnings growth to meaningfully accelerate until 2023. The company hence confirms its medium-term targets set in 2019 despite the ongoing challenges posed by COVID-19. At the same time, Fresenius specifies its expectations and now anticipates Group organic sales growth to reach the bottom to middle of the targeted 4% to 7% compounded annual growth rate (CAGR) and Group organic net income1,2 growth to be at the bottom end of the 5% to 9% CAGR during 2020 to 2023. Due to the COVID-19 pandemic, Fresenius now expects small and medium-sized acquisitions to contribute an incremental CAGR of less than 1% to both sales and net income growth.
29th consecutive dividend increase proposed
Consistent with Fresenius’ stated policy, the Management Board of Fresenius will propose to the Supervisory Board a dividend increase of 5% to €0.92 per share for FY/21 (FY/20: €0.88). Provided the proposal is approved by the Supervisory Board and the Annual General Meeting, this will be the 29th consecutive dividend increase.
The Management Board will propose a scrip dividend to the Supervisory Board, thereby giving shareholders the option to receive their dividend (except for the tax portion of the dividend) in the form of new Fresenius shares. The Else Kröner-Fresenius-Foundation has informed Fresenius that it intends to fully participate in the scrip dividend.
Fresenius to be climate neutral by 2040
Fresenius has set a climate target for the Group complementing its existing sustainability targets and programs. The company aims to be climate neutral by 2040 and to reduce 50% of absolute scope 1 and scope 2 emissions by 2030 compared to 2020 levels. Fresenius will continuously assess scope 3 emission impacts for inclusion in targets. Further information at www.fresenius.com/sustainability and in today’s separate press release at www.fresenius.com/news.
1 Net income attributable to shareholders of Fresenius SE & Co. KGaA
2 Before special items
For a detailed overview of special items please see the reconciliation tables on pages 21-25 in the PDF.
5% sales growth in constant currency
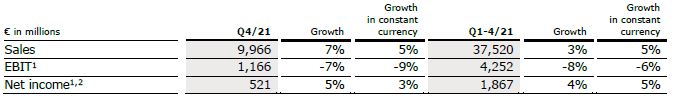
Group sales increased by 7% (5% in constant currency) to €9,966 million (Q4/20: €9,304 million). Organic growth was 4%. Acquisitions/divestitures contributed net 1% to sales growth. Currency translation increased sales growth by 2%. Excluding estimated COVID-19 effects1, Group sales growth would have been 5% to 6% in constant currency.
In FY/21, Group sales increased by 3% (5% in constant currency) to €37,520 million (FY/20: €36,277 million). Organic growth was 4%. Acquisitions/divestitures contributed net 1% to sales growth. Currency translation reduced sales growth by 2%. Excluding estimated COVID-19 effects1, Group sales growth would have been 5% to 6% in constant currency.
5% net income2,3 growth in constant currency
Group EBITDA before special items decreased by 2% (-5% in constant currency) to €1,846 million (Q4/202: €1,886 million). Reported Group EBITDA was €1,868 million (Q4/20: €1,854 million).
In FY/21, Group EBITDA before special items decreased by 4% (-2% in constant currency) to €6,854 million (FY/202: €7,132 million). Reported Group EBITDA was €6,825 million (FY/20: €7,100 million).
Group EBIT before special items decreased by 7% (-9% in constant currency) to €1,166 million (Q4/202: €1,251 million). The decrease is primarily due to COVID-19 related headwinds at Fresenius Medical Care. The EBIT margin before special items was 11.7% (Q4/202: 13.4%). Reported Group EBIT was €1,123 million (Q4/20: €1,024 million).
In FY/21, Group EBIT before special items decreased by 8% (-6% in constant currency) to €4,252 million (FY/202: €4,612 million). The decrease is primarily due to COVID-19 related headwinds at Fresenius Medical Care. The EBIT margin before special items was 11.3% (FY/202: 12.7%). Reported Group EBIT was €4,158 million (FY/20: €4,385 million).
1 For estimated COVID-19 effects in Q4/21 and FY/21 please see table on page 19 in the PDF.
2 Before special items
3 Net income attributable to shareholders of Fresenius SE & Co. KGaA
For a detailed overview of special items please see the reconciliation tables on pages 21-25 in the PDF.
Group net interest before special items improved to -€120 million (Q4/202: -€159 million) mainly due to successful refinancing activities. Reported Group net interest improved to -€122 million (Q4/20: -€156 million).
In FY/21, Group net interest before special items improved to -€504 million (FY/201: - €654 million) while reported Group net interest improved to -€506 million (FY/20: -€659 million).
The Group tax rate before special items was 23.1% (Q4/201: 24.1%) while the reported Group tax rate was 24.2% (Q4/20: 29.4%). In FY/21, the Group tax rate before special items was 22.6% (FY/201: 23.1%) while the reported Group tax rate was 22.8% (FY/20: 24.2%).
Noncontrolling interests before special items were €283 million (Q4/201: €335 million) of which 90% were attributable to the noncontrolling interests in Fresenius Medical Care. Reported noncontrolling interests were €260 million (Q4/20 reported: €203 million).
In FY/21, noncontrolling interests before special items were €1,033 million (FY/201: €1,248 million) of which 91% were attributable to the noncontrolling interests in Fresenius Medical Care. Reported noncontrolling interests were €1,001 million (FY/20 reported: €1,116 million).
Group net income2 before special items increased by 5% (3% in constant currency) to €521 million (Q4/201: €494 million). The increase is driven by the strong development of Fresenius Kabi’s Emerging Market business, a good performance at Helios Germany, an excellent finish to the year by Fresenius Vamed and the favorable net interest development. Excluding estimated COVID-19 effects3, Group net income2 before special items would have grown 3% to 7% in constant currency. Reported Group net income2 increased to €499 million (Q4/20: €410 million).
In FY/21, Group net income2 before special items increased by 4% (5% in constant currency) to €1,867 million (FY/201: €1,796 million). Excluding estimated COVID-19 effects3, Group net income2 before special items would have grown 6% to 10% in constant currency. Reported Group net income2 increased to €1,818 million (FY/20: €1,707 million).
1 Before special items
2 Net income attributable to shareholders of Fresenius SE & Co. KGaA
3 For estimated COVID-19 effects in Q4/21 and FY/21 please see table on page 19 in the PDF.
For a detailed overview of special items please see the reconciliation tables on pages 21-25 in the PDF.
Earnings per share1 before special items increased by 5% (2% in constant currency) to €0.94 (Q4/202: €0.88). Reported earnings per share1 were €0.90 (Q4/20: €0.73). In FY/21, earnings per share1 before special items increased by 4% (5% in constant currency) to €3.35 (FY/202: €3.22). Reported earnings per share1 were €3.26 (FY/20: €3.06).
Continued investment in growth
Spending on property, plant and equipment was €690 million corresponding to 7% of sales (Q4/20: €856 million; 9% of sales). These investments served primarily for the modernization and expansion of dialysis clinics, production facilities as well as hospitals and day clinics. In FY/21, spending on property, plant and equipment was €2,032 million corresponding to 5% of sales (FY/20: €2,398 million; 7% of sales).
Total acquisition spending was €278 million (Q4/20: €251 million). In FY/21, total acquisition spending was €1,085 million (FY/20: €902 million) mainly for the acquisition of the Eugin Group at Fresenius Helios which has been consolidated since April 1, 2021, and the acquisition of dialysis clinics at Fresenius Medical Care.
Strong cash flow development in Q4/21
Group operating cash flow increased by 26% to €1,749 million (Q4/20: €1,390 million) with an improved margin of 17.5% (Q4/20: 14.9%) mainly due to stringent working capital management. The good operating performance at Helios Spain, Fresenius Vamed and Fresenius Kabi also contributed to the positive development. Free cash flow before acquisitions and dividends increased to €1,075 million (Q4/20: €590 million). Free cash flow after acquisitions and dividends increased to €841 million (Q4/20: €329 million).
In FY/21, Group operating cash flow decreased to €5,078 million (FY/20: €6,549 million) with a margin of 13.5% (FY/20: 18.1%) mainly due to the U.S. government’s advanced payments received in 2020 and the partial recoupment of these payments in 2021 at Fresenius Medical Care.
Free cash flow before acquisitions and dividends decreased to €3,061 million (FY/20: €4,183 million). Free cash flow after acquisitions and dividends decreased to €1,193 million (FY/20: €2,478 million).
1 Net income attributable to shareholders of Fresenius SE & Co. KGaA
2 Before special items
For a detailed overview of special items please see the reconciliation tables on pages 21-25 in the PDF.
Solid balance sheet structure
Group total assets increased by 8% (4% in constant currency) to €71,962 million (Dec. 31, 2020: €66,646 million). The increase is mainly due to currency translation effects, acquisitions as well as the expansion of business activities. Current assets increased by 11% (8% in constant currency) to €17,461 million (Dec. 31, 2020: €15,772 million) driven by the increase of cash and cash equivalents, trade accounts receivables and inventories. Non-current assets increased by 7% (3% in constant currency) to €54,501 million (Dec. 31, 2020: €50,874 million).
Total shareholders’ equity increased by 13% (7% in constant currency) to €29,288 million (Dec. 31, 2020: €26,023 million). The increase is due to currency translation effects as well as the good net income development. The equity ratio was 40.7% (Dec. 31, 2020: 39.0%).
Group debt increased by 5% (2% in constant currency) to €27,155 million (Dec. 31, 2020: € 25,913 million). Group net debt increased by 1% (-1% in constant currency) to € 24,391 million (Dec. 31, 2020: € 24,076 million).
As of December 31, 2021, the net debt/EBITDA ratio increased to 3.51x1,2 (Dec. 31, 2020: 3.44x1,2) driven by COVID-19 effects weighing on EBITDA.
1 At LTM average exchange rates for both net debt and EBITDA; pro forma closed acquisitions/divestitures; including lease liabilities
2 Before special items
For a detailed overview of special items please see the reconciliation tables on pages 21-25 in the PDF.
Business Segments
Fresenius Medical Care (Financial data according to Fresenius Medical Care press release)
Fresenius Medical Care is the world's largest provider of products and services for individuals with renal diseases. As of December 31, 2021, Fresenius Medical Care was treating 345,425 patients in 4,171 dialysis clinics. Along with its core business, the Renal Care Continuum, the company focuses on expanding in complementary areas and in the field of critical care.
• Business development significantly impacted by COVID-19 in 2021, effects are expected to continue into 2022
• Decline in excess mortality in the fourth quarter
• Return to earnings growth in 2022 targeted
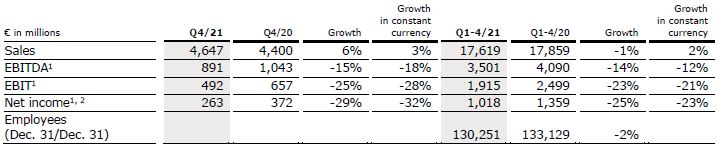
Sales increased by 6% (3% in constant currency) to €4,647 million (Q4/20: €4,400 million). Currency translation increased sales growth by 3%. Organic growth was 2%. Acquisitions/divestitures contributed net 1% to sales growth.
In FY/21, sales decreased by 1% (increased by 2% in constant currency) to €17,619 million (FY/20: €17,859 million). Currency translation decreased sales growth by 3%. Organic growth was 1%. Acquisitions/divestitures contributed net 1% to sales growth.
EBIT decreased by 3% (-7% in constant currency) to €449 million (Q4/20: €462 million) resulting in a margin of 9.7% (Q4/20: 10.5%). EBIT before special items decreased by 25% (-28% in constant currency) to €492 million (Q4/20: €657 million), resulting in a margin of 10.6% (Q4/20: 14.9%). The decline was mainly due to a remeasurement effect on the fair value of investments, higher labor cost, the adverse COVID-19-related net effects and inflationary materials cost increases. These effects were only slightly mitigated by an improved U.S. payor mix, in particular due to an increased number of patients with Medicare Advantage coverage.
1 Before special items
2 Net income attributable to shareholders of Fresenius Medical Care AG & Co. KGaA
For a detailed overview of special items please see the reconciliation tables on pages 21-25 in the PDF.
In FY/21, EBIT decreased by 20% (-17% in constant currency) to €1,852 million (FY/20: €2,304 million) resulting in a margin of 10.5% (FY/20: 12.9%). EBIT before special items decreased by 23% (-21% in constant currency) to €1,915 million (FY/20: €2,499 million), resulting in a margin of 10.9% (FY/20: 14.0%).
Net income1 increased by 29% (23% in constant currency) to €229 million (Q4/20: €177 million). Net income1 before special items decreased by 29% (-32% in constant currency) to €263 million (Q4/20: €372 million) mainly due to the mentioned negative effects on operating income. In FY/21, net income1 decreased by 17% (-14% in constant currency) to €969 million (FY/20: €1,164 million). Net income1 before special items decreased by 25% (-23% in constant currency) to €1,018 million (FY/20: €1,359 million).
Operating cash flow was €669 million (Q4/20: €584 million) with a margin of 14.4% (Q4/20: 13.3%). The increase was mainly due to improved working capital including contributions from FME25 and U.S. federal relief funding, partially offset by continued recoupment of the U.S. government’s payments received in 2020 under the CARES Act and lower tax payments related to COVID-19 reliefs in the prior year. In FY/21, operating cash flow was €2,489 million (FY/20: €4,233 million) with a margin of 14.1% (FY/20: 23.7%).
For FY/22, Fresenius Medical Care expects revenue2 and net income1,3 to grow at low- to mid-single-digit percentage rates in constant currency4. For the underlying assumptions please see Fresenius Medical Care’s press release at www.freseniusmedicalcare.com.
For further information, please see Fresenius Medical Care’s press release at www.freseniusmedicalcare.com.
1 Net income attributable to shareholders of Fresenius Medical Care AG & Co. KGaA
2 FY/21 base: €17,619 million
3 FY/21 base: €1,018 million, before special items; FY/22 before special items
4 These targets are based on the 2021 results excluding the costs related to FME25 of €49 million (for net income). They are based on the outlined assumptions (http://www.freseniusmedicalcare.com), in constant currency and exclude special items. Special items include further costs related to FME25 and other effects that are unusual in nature and have not been foreseeable or not foreseeable in size or impact at the time of giving guidance.
For a detailed overview of special items please see the reconciliation tables on pages 21-25 in the PDF.
Fresenius Kabi
Fresenius Kabi offers intravenously administered generic drugs, clinical nutrition and infusion therapies for seriously and chronically ill patients in the hospital and outpatient environments. The company is also a leading supplier of medical devices and transfusion technology products. In the biosimilars business, Fresenius Kabi develops products with a focus on oncology and autoimmune diseases.
• Good performance in Q4 supported by COVID-driven demand, not expected to continue through 2022
• North America with positive organic sales and EBIT growth despite supply chain challenges
• Asia-Pacific with anticipated organic sales decline due to price effects in China post successful participation in NVBP tenders
• Separate reporting of Biosimilars sales starting Q1/22
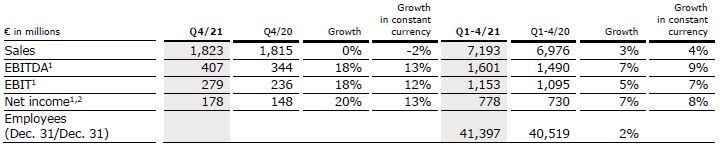
Sales remained on previous year’s level (decreased by -2% in constant currency) at €1,823 million (Q4/20: €1,815 million). Organic growth was -1%. Divestitures reduced sales growth by 1%. Positive currency translation effects (2%) were mainly related to the appreciation of the U.S. dollar and the Chinese yuan against the Euro.
In FY/21, sales increased by 3% (4% in constant currency) to €7,193 million (FY/20: €6,976 million). Organic growth was 4%. Negative currency translation effects of 1% were mainly related to the weakness of the U.S. dollar.
Sales in North America increased by 7% (organic growth: 2%) to €589 million (Q4/20: €549 million) driven by COVID-19 related extra demand. In FY/21, sales in North America decreased by 5% (organic growth: -2%) to €2,258 million (FY/20: €2,376 million).
Sales in Europe decreased by 2% (organic growth: 0%) to €664 million (Q4/20: €680 million) mainly due to the high prior-year base. In FY/21, sales in Europe increased by 3% (organic growth: 3%) to €2,544 million (FY/20: €2,458 million).
1 Before special items
2 Net income attributable to shareholders of Fresenius SE & Co. KGaA
For a detailed overview of special items please see the reconciliation tables on pages 21-25 in the PDF.
Sales in Asia-Pacific decreased by 8% (organic growth: -13%) to €395 million (Q4/20: €428 million) due to the anticipated negative price effects from successful participation in NVBP (National Volume-Based Purchasing) tenders as well as the exceptionally high prior-year base. In FY/21, sales in Asia-Pacific increased by 10% (organic growth: 8%) to €1,643 million (FY/20: €1,497 million).
Sales in Latin America/Africa increased by 11% (organic growth: 12%) to €175 million (Q4/20: €158 million) due to ongoing COVID-19 related extra demand. In FY/21, sales in Latin America/Africa increased by 16% (organic growth: 23%) to €748 million (FY/20: €645 million).
EBIT before special items increased by 18% (12% in constant currency) to €279 million (Q4/201: €236 million) with a margin of 15.3% (Q4/201:13.0%). The excellent performance is primarily due to COVID-19 related extra demand, and cost savings in the Asia-Pacific region, mainly in China. The ongoing competitive situation, supply chain challenges, the flow-through effects of tenders in China were headwinds. There were broadly offsetting one time effects across the regions. In FY/21, EBIT before special items increased by 5% (7% in constant currency) to €1,153 million (FY/201: €1,095 million) with a margin of 16.0% (FY/201: 15.7%).
Net income1,2 increased by 20% (13% in constant currency) to €178 million (Q4/201: €148 million). In FY/21, net income1,2 increased by 7% (8% in constant currency) to €778 million (FY/201: €730 million).
Operating cash flow increased by 9% to €335 million (Q4/20: €307 million) with a margin of 18.4% (Q4/20: 16.9%) mainly due to a healthy operational performance. In FY/21, operating cash flow increased by 5% to €1,203 million (FY/20: €1,143 million) with a margin of 16.7% (FY/20: 16.4%).
For FY/22, Fresenius Kabi expects organic sales3 growth in a low-single-digit percentage range. Constant currency EBIT4 is expected to decline in a high-single- to low-double-digit percentage range. Both sales and EBIT outlook include expected COVID-19 effects.
Starting Q1/22, the sales of the Biosimilars business will be reported on a quarterly basis.
1 Before special items
2 Net income attributable to shareholders of Fresenius SE & Co. KGaA
3 FY/21 base: €7,193 million
4 FY/21 base: €1,153 million, before special items, FY/22 before special items
For a detailed overview of special items please see the reconciliation tables on pages 21-25 in the PDF.
Fresenius Helios
Fresenius Helios is Europe's leading private hospital operator. The company comprises Helios Germany and Helios Spain (Quirónsalud) and the Eugin Group. Helios Germany operates 90 hospitals, ~130 outpatient centers and 6 prevention centers. Quirónsalud operates 49 hospitals in Spain as well as 88 outpatient centers and ~300 occupational risk prevention centers. In addition, the company is active in Latin America with 7 hospitals and as a provider of medical diagnostics.
• Sales growth at Helios Germany driven by increasing admissions and acquisitions
• Helios Spain with strong organic sales growth; EBIT growth influenced by exceptionally high prior-year base
• Separate reporting of Fertility Services starting Q1/22
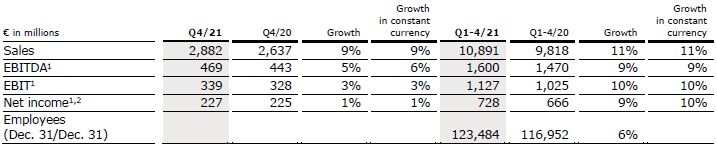
Sales increased by 9% (9% in constant currency) to €2,882 million (Q4/20: €2,637 million). Organic growth was 5%. Acquisitions contributed 4% to sales growth. In FY/21, sales increased by 11% (11% in constant currency) to €10,891 million (FY/20: €9,818 million). Organic growth was 7%. Acquisitions contributed 4% to sales growth.
Sales of Helios Germany increased by 7% (organic growth: 4%) to €1,745 million (Q4/20: €1,637 million) primarily driven by increasing admissions. Acquisitions contributed 3% to sales growth. In FY/21, sales of Helios Germany increased by 6% (organic growth: 2%) to €6,733 million (FY/20: €6,340 million). Acquisitions contributed 4% to sales growth.
Sales of Helios Spain increased by 9% (9% in constant currency) to €1,084 million (Q4/20: €999 million). Organic growth of 9% was driven by the continuous high level of treatment activity and a consistently high level of demand for the occupational risk prevention services as well as good contributions from Latin America. In FY/21, sales of Helios Spain increased by 16% (17% in constant currency) to €4,021 million (FY/20: €3,475 million). Organic growth was 15%. Acquisitions contributed 2% to sales growth.
1 Before special items
2 Net income attributable to shareholders of Fresenius SE & Co. KGaA
For a detailed overview of special items please see the reconciliation tables on pages 21-25 in the PDF.
EBIT1 of Fresenius Helios increased by 3% (3% in constant currency) to €339 million (Q4/20: €328 million) with a margin1 of 11.8% (Q4/20: 12.4%). In FY/21, EBIT1 of Fresenius Helios increased by 10% (10% in constant currency) to €1,127 million (FY/20: €1,025 million) with a margin1 of 10.3% (FY/20: 10.4%).
EBIT1 of Helios Germany increased by 9% to €171 million (Q4/20: €157 million) with a margin1 of 9.8% (Q4/20: 9.6%) driven by the positive business development as well as the compensation for COVID-19 related revenue shortfalls. In FY/21, EBIT1 of Helios Germany increased by 2% to €613 million (FY/20: €602 million) with a margin1 of 9.1% (FY/20: 9.5%).
EBIT1 of Helios Spain increased by 2% (3% in constant currency) to €162 million (Q4/20: €159 million) with a margin1 of 14.9% (Q4/20: 15.9%). EBIT growth was influenced by the exceptionally high prior-year base. In addition, higher costs for personnel, personal protective equipment and selected medical products, among others, had a negative impact.
In FY/21, EBIT1 of Helios Spain increased by 22% (24% in constant currency) to €514 million (FY/20: €420 million) with a margin1 of 12.8% (FY/20: 12.1%).
Net income1,2 increased by 1% to €227 million (Q4/20: €225 million). In FY/21, net income1,2 increased by 9% to €728 million (FY/20: €666 million).
Operating cash flow increased to €609 million (Q4/20: €434 million) with a margin of 21.1% (Q4/20: 16.5%) driven by the positive business development as well as stringent working capital management. In FY/21, operating cash flow increased to €1,204 million (FY/20: €1,149 million) with a margin of 11.1% (FY/20: 11.7%).
For FY/22, Fresenius Helios expects organic sales3 growth in a low- to mid-single-digit percentage range and constant currency EBIT4 growth in a mid-single-digit percentage range. Both sales and EBIT outlook include expected COVID-19 effects.
The Eugin Group contributed €133 million to sales and €19 million EBIT in 2021, with first-time consolidation effective April 1, 2021. Starting Q1/22, sales and EBIT of the Eugin Group will be reported under “Fertility Services” on a quarterly basis.
1 Before special items
2 Net income attributable to shareholders of Fresenius SE & Co. KGaA
3 FY/21 base: €10,891 million
4 FY/21 base: €1,127 million, FY/22 before special items
For a detailed overview of special items please see the reconciliation tables on pages 21-25 in the PDF.
Fresenius Vamed
Fresenius Vamed manages projects and provides services for hospitals and other health care facilities worldwide and is a leading post-acute care provider in Central Europe. The portfolio ranges along the entire value chain: from project development, planning, and turnkey construction, via maintenance and technical management to total operational management.
• Strong finish to the year with excellent organic sales and EBIT growth
• Project business recovering - back to the typical phasing with a strong Q4
• Rehabilitation business developing steadily despite continuous COVID-19 impact; technical service business remains robust
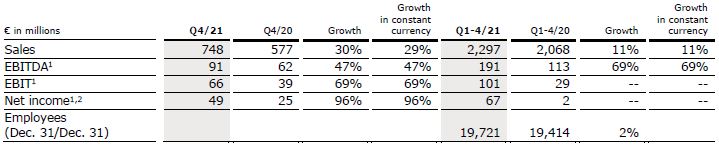
Sales increased by 30% (29% in constant currency) to €748 million (Q4/20: €577 million). Organic growth was 29%. In FY/21, sales increased by 11% (11% in constant currency) to €2,297 million (FY/20: €2,068 million). Organic growth was 11%.
Sales in the service business increased by 12% to €415 million (Q4/20: €372 million). Sales in the project business increased by 62% to €333 million (Q4/20: €205 million), driven by the good operating performance across all regions. In FY/21, sales in the service business increased by 10% to €1,580 million (FY/20: €1,435 million). Sales in the project business increased by 13% to €717 million (FY/20: €633 million).
1 Before special items
2 Net income attributable to shareholders of VAMED AG
For a detailed overview of special items please see the reconciliation tables on pages 21-25 in the PDF.
EBIT1 increased by 69% (69% in constant currency) to €66 million (Q4/20: €39 million) with a margin1 of 8.8% (Q4/20: 6.8%). This significant recovery is due to the good business performance in all regions. In FY/21, EBIT1 more than tripled (248% in constant currency) to €101 million (FY/20: €29 million) with a margin1 of 4.4% (FY/20: 1.4%).
Net income1,2 increased to €49 million (Q4/20: €25 million). In FY/21, net income1,2 increased to €67 million (FY/20: €2 million).
Order intake was €319 million in Q4/21 (Q4/20: €648 million) and €1,290 million in FY/21 (FY/20: €1,010 million). As of December 31, 2021, order backlog was at €3,473 million (December 31, 2020: €3,055 million).
Operating cash flow increased to €128 million (Q4/20: €74 million) with a margin of 17.1% (Q4/20: 12.8%) mainly due to an improved working capital development. In FY/21, operating cash flow increased to €151 million (FY/20: €78 million) with a margin of 6.6% (FY/20: 3.8%).
For FY/22, Fresenius Vamed expects organic sales3 growth in a high-single to low-double-digit percentage range and constant currency EBIT4 to return to absolute pre-COVID-19 levels (FY/19: €134 million). Both sales and EBIT outlook include expected negative COVID-19 effects.
1 Before special items
2 Net income attributable to shareholders of VAMED AG
3 FY/21 base: €2,297 million
4 FY/21 base: €101 million; FY/22 before special items
For a detailed overview of special items please see the reconciliation tables on pages 21-25 in the PDF.
Conference Call
As part of the publication of the results for FY 2021, a conference call will be held on February 22, 2022 at 1:30 p.m. CET (7:30 a.m. EST). All investors are cordially invited to follow the conference call in a live broadcast over the Internet at www.fresenius.com/investors. Following the call, a replay will be available on our website.
For additional information on the performance indicators used please refer to our website www.fresenius.com/alternative-performance-measures.
This release contains forward-looking statements that are subject to various risks and uncertainties. Future results could differ materially from those described in these forward-looking statements due to certain factors, e.g. changes in business, economic and competitive conditions, regulatory reforms, results of clinical trials, foreign exchange rate fluctuations, uncertainties in litigation or investigative proceedings, and the availability of financing. Fresenius does not undertake any responsibility to update the forward-looking statements in this release.