

August 1, 2016
Fresenius raises earnings guidance after strong second quarter; Double-digit earnings growth
If no timeframe is specified, information refers to H1/2016
Q2/2016:
- Sales: €7.1 billion (+2%, +5% in constant currency)
- EBIT1: €1,051 million (+8%, +11% in constant currency)
- Net income1,2: €393 million (+12%, +15% in constant currency)
H1/2016:
- Sales: €14.0 billion (+4%, +6% in constant currency)
- EBIT1: €2,010 million (+10%, +11% in constant currency)
- Net income1,2: €755 million (+18%, +18% in constant currency)
12015 before special items2Net income attributable to shareholders of Fresenius SE & Co. KGaA
For a detailed overview of special items please see the reconciliation tables on pages 13-14 of the pdf file.
Stephan Sturm, CEO of Fresenius, said: “Once again, all four business segments contributed to strong organic growth. This confirms Fresenius’ sound strategic position as a healthcare Group. We have continued to grow even in regions where economies have slowed. This confirms the stability of our markets and businesses. Even compared with an excellent prior-year quarter, Fresenius has again achieved double-digit earnings growth. This confirms that we are providing the right products and services to patients worldwide. Fresenius has now delivered the 50th consecutive quarter of earnings growth. We continue to look forward with great confidence, and are raising our 2016 earnings guidance.”
2016 Group earnings guidance raised
Based on the Group’s excellent financial results in the first half of 2016 and strong prospects for the remainder of the year, Fresenius raises its 2016 Group earnings guidance. Net income1,2 is now expected to grow by 11% to 14% in constant currency. Previously, Fresenius expected net income1,2 growth of 8% to 12% in constant currency. The company confirms its Group sales guidance. Sales are expected to increase by 6% to 8% in constant currency.
The net debt/EBITDA3 ratio is expected to be approximately 2.5 at the end of 2016.
1Net income attributable to shareholders of Fresenius SE & Co. KGaA22015 before special items3Calculated at FY average exchange rates for both net debt and EBITDA; excluding potential acquisitions
For a detailed overview of special items please see the reconciliation tables on page 13-14 of the pdf file.
6% sales growth in constant currency
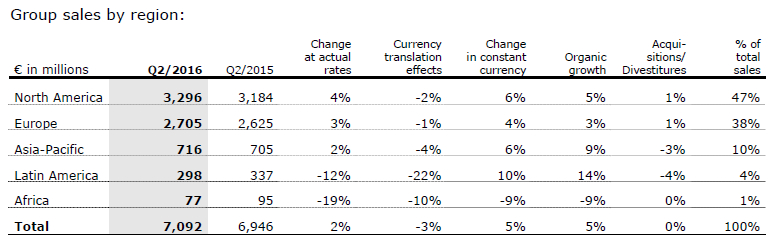
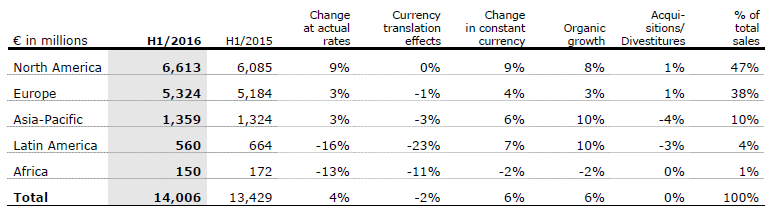
Group sales increased by 4% (6% in constant currency) to €14,006 million (H1/2015: €13,429 million). Organic sales growth was 6%. Acquisitions contributed 1% and divestitures reduced sales by 1%. Negative currency translation effects (-2%) were mainly driven by the devaluation of Latin American currencies against the Euro. In Q2/2016, Group sales increased by 2% (5% in constant currency) to €7,092 million (Q2/2015: €6,946 million). Organic sales growth was 5%. Acquisitions contributed 1%, while divestitures reduced sales by 1%.


18% net income1,2 growth in constant currency
Group EBITDA2 increased by 9% (10% in constant currency) to €2,576 million (H1/2015: €2,364 million). Group EBIT2 increased by 10% (11% in constant currency) to €2,010 million (H1/2015: €1,822 million). The EBIT margin2 increased to 14.4% (H1/2015: 13.6%). In Q2/2016, Group EBIT2 increased by 8% (11% in constant currency) to €1,051 million (Q2/2015: €971 million), the EBIT margin was 14.8% (Q2/2015: 14.0%).
Group net interest decreased to -€291 million (H1/2015: -€330 million), mainly due to more favorable financing terms and lower net debt.
With 28.6%, the Group tax rate (before special items) was on Q1/2016 level (28.4%) and hence in line with expectations. In Q2/2016, the Group tax rate was 28.7% (Q2/2015: 29.0%).
Noncontrolling interest increased to €473 million (H1/2015: €409 million), of which 96% was attributable to the noncontrolling interest in Fresenius Medical Care.
Group net income , increased by 18% (18% in constant currency) to €755 million (H1/2015: €642 million). Earnings per share1,2 increased by 17% (18% in constant currency) to €1.38 (H1/2015: €1.18). In Q2/2016, Group net income1,2 increased by 12% (15% in constant currency) to €393 million (Q2/2015: €350 million). Earnings per share1,2 increased by 12% (14% in constant currency) to €0.72 (Q2/2015: €0.64).
Continued investment in growth
Spending on property, plant and equipment was €670 million (H1/2015: €611 million), primarily for the modernization and expansion of dialysis clinics, production facilities and hospitals. Total acquisition spending was €505 million (H1/2015: €194 million).
Cash flow development
Operating cash flow increased by 6% to €1,330 million (H1/2015: €1,251 million) with a margin of 9.5% (H1/2015: 9.3%). Operating cash flow in Q2/2016 increased to €996 million (Q2/2015: €720 million). The cash flow margin increased to 14.0% (Q2/2015: 10.4%). As expected, the operating cashflow of Fresenius Medical Care improved considerably in Q2/2016.
Free cash flow before acquisitions and dividends increased slightly to €650 million (H1/2015: €646 million). Free cash flow after acquisitions and dividends was -€206 million (H1/2015: €107 million).
Solid balance sheet structure
The Group’s total assets increased by 2% (3% in constant currency) to €43,821 million (Dec. 31, 2015: €42,959 million). The increase is mainly driven by business expansion. Current assets grew by 5% (6% in constant currency) to €11,000 million (Dec. 31, 2015: €10,479 million). Non-current assets increased by 1% (2% in constant currency) to €32,821 million (Dec. 31, 2015: € 32,480 million).
Total shareholders’ equity grew by 3% (also 3% in constant currency) to €18,458 million (Dec. 31, 2015: €18,003 million). The equity ratio increased to 42.1% (Dec. 31, 2015: 41.9%).
Group debt increased by 1% (2% in constant currency) to €14,960 million (Dec. 31, 2015: € 14,769 million). As of June 30, 2016, the net debt/EBITDA ratio was 2.62 , (Dec. 31, 2015: 2.681).
12015 before special items; at LTM average exchange rates for both net debt and EBITDA2Pro forma acquisitionsFor a detailed overview of special items please see the reconciliation tables on page 13-14 of the pdf file.
Business Segments
Fresenius Medical Care
Fresenius Medical Care is the world's largest provider of products and services for individuals with renal diseases. As of June 30, 2016, Fresenius Medical Care was treating 301,548 patients in 3,504 dialysis clinics. Along with its core business, the company seeks to expand the range of medical services in the field of care coordination.


- 7% sales growth in constant currency in Q2
- 22% net income growth in Q2
- 2016 outlook confirmed
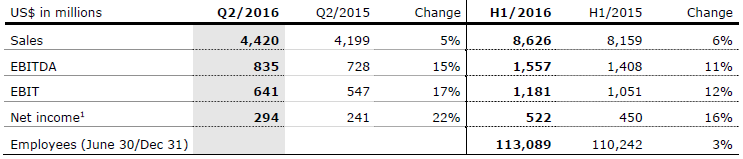
Sales increased by 6% (8% in constant currency) to US$8,626 million (H1/2015: US$8,159 million). Organic sales growth was 7%. Acquisitions contributed 1%. Currency translation effects reduced sales by 2%. In Q2/2016, sales increased by 5% (7% in constant currency) to US$4,420 million (Q2/2015: US$4,199 million). Organic sales growth was 6%.
Health Care services sales (dialysis services and care coordination) increased by 7% (9% in constant currency) to US$6,985 million (H1/2015: US$6,527 million). Dialysis product sales increased by 1% (4% in constant currency) to US$1,640 million (H1/2015: US$1,631 million).
In North America, sales increased by 9% to US$6,212 million (H1/2015: US$5,717 million). Health Care services sales grew by 9% to US$5,770 million (H1/2015: US$5,293 million). Dialysis product sales increased by 4% to US$441 million (H1/2015: US$424 million).
Sales outside North America decreased by 1% (increased by 6% in constant currency) to US$2,406 million (H1/2015: US$2,427 million). Health Care services sales decreased by 2% (increased by 7% in constant currency) to US$1,215 million (H1/2015: US$1,234 million). Dialysis product sales remained nearly unchanged at (increased by 5% in constant currency to) US$1,191 million (H1/2015: US$1,193 million).
1Net income attributable to shareholders of Fresenius Medical Care AG & Co. KGaA
EBIT increased by 12% (13% in constant currency) to US$1,181 million (H1/2015: US$1,051 million). The EBIT margin was 13.7% (H1/2015: 12.9%). In Q2/2016, EBIT increased by 17% (17% in constant currency) to US$641 million (Q2/2015: US$547 million). The EBIT margin was 14.5% (Q2/2015: 13.0%).
Net income increased by 16% (16% in constant currency) to US$522 million (H1/2015: US$450 million). In Q2/2016, net income grew by 22% (22% in constant currency) to US$294 million (Q2/2015: US$241 million).
Operating cash flow increased by 3% to US$857 million (H1/2015: US$832 million). The cash flow margin was 9.9% (H1/2015: 10.2%). In Q2/2016, operating cash flow increased to US$678 million (Q2/2015: US$385 million) with a cash flow margin of 15.3% (Q2/2015: 9.2%). The sequential improvement is mainly driven by the anticipated catch-up effect after the adjustment in invoicing in Q1/2016.
Fresenius Medical Care confirms its outlook for 2016. The company expects sales to grow by 7% to 10% in constant currency and net income1 is expected to increase by 15% to 20% in 2016.
1Net income attributable to shareholders of Fresenius Medical Care AG & Co. KGaA
22015 before GranuFlo®/NaturaLyte® settlement costs (-US$37 million after tax) and before acquisitions (US$9 million after tax); hence the basis for expected net income growth is US$1,057 million.
For further information, please see Fresenius Medical Care’s Press Release at www.freseniusmedicalcare.com.
Fresenius Kabi
Fresenius Kabi offers intravenously administered generic drugs, clinical nutrition and infusion therapies for seriously and chronically ill patients in the hospital and outpatient environments. The company is also a leading supplier of medical devices and transfusion technology products.


- 3% organic sales growth in Q2
- 1% constant currency EBIT1 growth in Q2
- 2016 outlook raised: both, organic sales growth and EBIT1 growth in constant currency of 3% to 5% expected
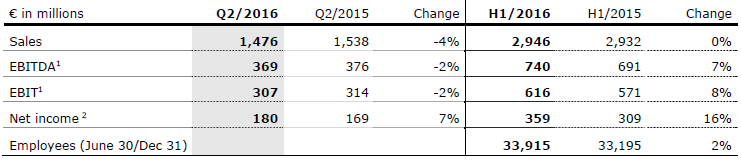
Sales increased slightly (by 4% in constant currency) to €2,946 million (H1/2015: €2,932 million). Organic sales growth was 6%. Divestitures reduced sales by 2%. In Q2/2016, sales decreased by 4% (increased by 1% in constant currency) to €1,476 million (Q2/2015: €1,538 million). Negative currency translation effects (-5%) were mainly driven by the devaluation of the Chinese yuan, the U.S. dollar and the Argentine peso against the Euro. Organic sales growth was 3%.
Sales in Europe remained nearly unchanged at €1,048 million (H1/2015: €1,052 million). Organic sales growth was 2%. Divestitures reduced sales by 1%. Also in Q2/2016, sales were almost unchanged at €536 million (Q2/2015: €534 million). Organic sales growth was 2%.
Sales in North America increased by 6% (organic growth: 6%) to €1,086 million (H1/2015: €1,026 million), driven by persisting drug shortages as well as new product launches in Q1/2016. In Q2/2016, sales decreased by 8% (organic: 6%) to €510 million (Q2/2015: €553 million), mainly due to the high prior-year basis driven by significant new product launches.
12015 before special items2Net income attributable to shareholders of Fresenius Kabi AG; 2015 before special items
For a detailed overview of special items please see the reconciliation tables on page 13-14.
Sales in Asia-Pacific decreased by 6% (organic growth: 7%) to €531 million (H1/2015: €564 million). Adverse currency translation effects reduced sales by 5%, divestitures by another 8%. In Q2/2016, sales decreased by 6% (organic growth: 8%) to €277 million (Q2/2015: €296 million).
Given adverse currency translation effects, sales in Latin America/Africa decreased by 3% (organic growth: 21%, in particular due to inflation driven price increases) to €281 million (H1/2015: €290 million). In Q2/2016, sales decreased by 1% (organic growth 22%) to €153 million (Q2/2015: €155 million).
EBIT2 increased by 8% (10% in constant currency) to €616 million (H1/2015: €571 million). The EBIT margin2 improved to 20.9% (H1/2015: 19.5%). In Q2/2016, EBIT2 decreased by 2% (increased by 1% in constant currency) to €307 million (Q2/2015: €314 million). The EBIT margin2 increased to 20.8% (Q2/2015: 20.4%).
Net income1 increased by 16% (37% in constant currency) to €359 million (H1/2015: €309 million). In Q2/2016, net income1 increased by 7% (30% in constant currency) to €180 million (Q2/2015: €169 million).
Given adverse currency translation effects, operating cash flow decreased by 5% to €335 million (H1/2015: €354 million) with a margin of 11.4% (H1/2015: 12.1%). While operating cash flow reached a very strong €211 million in Q2/2016, it could not match the exceptional prior-year quarter (Q2/2015: €271 million). The same applies to the margin of 14.3% (Q2/2015: 17.6%).
Fresenius Kabi raises its outlook for 2016 and now expects organic sales growth of 3% to 5% and EBIT2 growth in constant currency of 3% to 5%. Previously, Fresenius Kabi projected low single-digit organic sales growth and EBIT2 in constant currency to be roughly flat compared with 2015.
1Net income attributable to shareholders of Fresenius Kabi AG; 2015 before special items22015 before special items
For a detailed overview of special items please see the reconciliation tables on page 13-14 of the pdf file.
Fresenius Helios
Fresenius Helios is Germany’s largest hospital operator. HELIOS operates 112 hospitals, thereof 88 acute care clinics (including seven maximum care hospitals in Berlin-Buch, Duisburg, Erfurt, Krefeld, Schwerin, Wiesbaden and Wuppertal) and 24 post-acute care clinics. HELIOS treats more than 4.7 million patients per year, thereof approximately 1.3 million inpatients, and operates more than 34,000 beds.
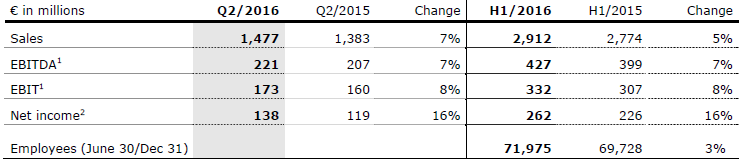


- 6% organic sales growth in Q2
- 60 bps sequential EBIT margin increase
- 2016 outlook confirmed
Sales increased by 5% to €2,912 million (H1/2015: €2,774 million). Organic sales growth was 4% (H1/2015: 3%). Acquisitions and divestitures had no material effect. In Q2/2016, sales increased by 7% to €1,477 million (Q2/2015: €1,383 million). Organic sales growth was 6% (Q2/2015: 2%).
EBIT1 grew by 8% to €332 million (H1/2015: €307 million). The EBIT margin1 increased to 11.4% (H1/2015: 11.1%). In Q2/2016, EBIT1 increased by 8% to €173 million (Q2/2015: €160 million). Sequentially, the EBIT margin increased by 60 bps to 11.7%.
Net income2 increased by 16% to €262 million (H1/2015: €226 million). In Q2/2016, net income2 increased by 16% to €138 million (Q2/2015: €119 million).
Fresenius Helios confirms its outlook for 2016 and projects organic sales growth of 3% to 5%. EBIT is expected to increase to €670 to €700 million.
12015 before special items2Net income attributable to shareholders of HELIOS Kliniken GmbH; 2015 before special items
For a detailed overview of special items please see the reconciliation tables on page 13-14 of the pdf file.
Fresenius Vamed
Fresenius Vamed manages projects and provides services for hospitals and other health care facilities worldwide. The portfolio ranges along the entire value chain: from project development, planning, and turnkey construction, via maintenance and technical management, to total operational management.
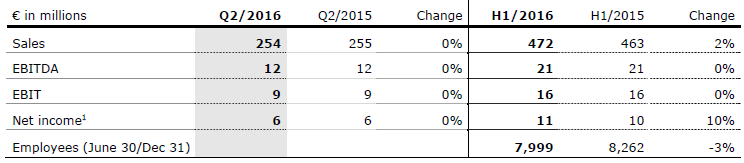


- Sales development reflects typical quarterly fluctuations in the project business
- Strong order intake of €228 million in Q2
- 2016 outlook confirmed
Sales increased by 2% (2% in constant currency) to €472 million (H1/2015: €463 million). Organic sales growth was 3%. Sales in the project business decreased by 3% to €195 million (H1/2015: €202 million). Sales in the service business grew by 6% to €277 million (H1/2015: €261 million). In Q2/2016, sales remained nearly unchanged at €254 million (Q2/2015: €255 million). Organic sales growth was 1%.
EBIT remained unchanged at €16 million (H1/2015: €16 million). The EBIT margin was 3.4% (H1/2015: 3.5%). In Q2/2016, EBIT remained unchanged at €9 million (Q2/2015: €9 million). The EBIT margin of 3.5% was at prior-year level.
Net income1 grew by 10% to €11 million (H1/2015: €10 million). In Q2/2016, net income1 of €6 million was at prior-year level.
Order intake increased by 64% to €465 million (H1/2015: €284 million). As of June 30, 2016, order backlog grew to €1,917 million (December 31, 2015: €1,650 million).
Fresenius Vamed confirms its outlook for 2016 and expects organic sales growth in the range of 5% to 10% and EBIT growth of 5% to 10%.
1Net income attributable to shareholders of VAMED AG
Conference Call
As part of the publication of the results for the first half of 2016, a conference call will be held on August 2, 2016 at 2 p.m. CEDT (8 a.m. EDT). All investors are cordially invited to follow the conference call in a live broadcast over the Internet at www.fresenius.com/investors. Following the call, a replay will be available on our website.
For additional information on the performance indicators used please refer to pages 25, 40, 56f., 100f. and 194 of the Annual Report 2015 of Fresenius SE & Co. KGaA. Constant currencies for income and expenses are calculated using prior year average rates; constant currencies for assets and liabilities are calculated using the mid-closing rate on the date of the respective statement of financial position (cf. Annual Report 2015, page 111). (https://www.fresenius.com/financial_reporting/Fresenius_GB_US_GAAP_2015_englisch.pdf).
This release contains forward-looking statements that are subject to various risks and uncertainties. Future results could differ materially from those described in these forward-looking statements due to certain factors, e.g. changes in business, economic and competitive conditions, regulatory reforms, results of clinical trials, foreign exchange rate fluctuations, uncertainties in litigation or investigative proceedings, and the availability of financing. Fresenius does not undertake any responsibility to update the forward-looking statements in this release.